| Param | Original file | Final file |
|---|---|---|
| Filename | modeM0/AS1G08_058T09_9000002300_15539cztM0_level2.evt | modeM0/AS1G08_058T09_9000002300_15539cztM0_level2_quad_clean.evt |
| Size (bytes) | 1,253,931,840 | 226,955,520 |
| Size | 1.2 GB | 216.4 MB |
| Events in quadrant A | 8,895,190 | 1,419,960 |
| Events in quadrant B | 9,180,622 | 1,430,995 |
| Events in quadrant C | 8,932,446 | 1,380,946 |
| Events in quadrant D | 9,706,737 | 1,357,914 |
| Mode M0 | |||
|---|---|---|---|
| Quadrant | BADHDUFLAG | Total packets | Discarded packets |
| A | 0 | 38550 | 6 |
| B | 0 | 39649 | 5 |
| C | 0 | 38845 | 5 |
| D | 0 | 41688 | 5 |
| Mode M9 | |||
|---|---|---|---|
| Quadrant | BADHDUFLAG | Total packets | Discarded packets |
| A | 0 | 22 | 0 |
| B | 0 | 22 | 0 |
| C | 0 | 22 | 0 |
| D | 0 | 22 | 0 |
| Mode SS | |||
|---|---|---|---|
| Quadrant | BADHDUFLAG | Total packets | Discarded packets |
| A | 0 | 378 | 0 |
| B | 0 | 378 | 0 |
| C | 0 | 378 | 0 |
| D | 0 | 378 | 0 |
| Quadrant | Total seconds | Saturated seconds | Saturation percentage |
|---|---|---|---|
| A | 18645 | 142 | 0.761598% |
| B | 18645 | 230 | 1.233575% |
| C | 18645 | 280 | 1.501743% |
| D | 18645 | 213 | 1.142397% |
Noise dominated data is calculated using 1-second bins in cleaned event files. If a bin has >2000 counts, and if more than 50% of those come from <1% of pixels, then it is considered to be noise-dominated and hence unusable.
| Quadrant | # 1 sec bins | Bins with >0 counts | Bins with >2000 counts | High rate bins dominated by noise | Noise dominated (total time) | Noise dominated (detector-on time) | Marked lightcurve |
|---|---|---|---|---|---|---|---|
| A | 20781 | 18651 | 18 | 18 | 0.09% | 0.10% | 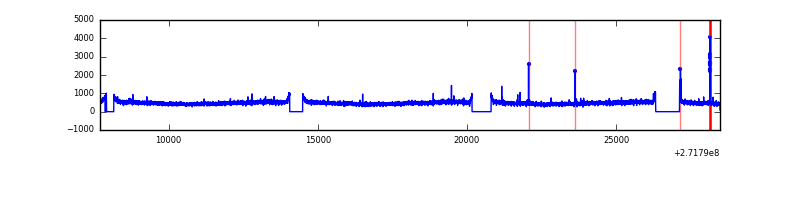 |
| B | 20781 | 18651 | 30 | 30 | 0.14% | 0.16% | 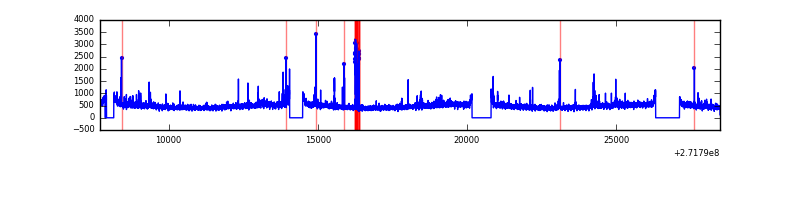 |
| C | 20781 | 18650 | 5 | 5 | 0.02% | 0.03% | 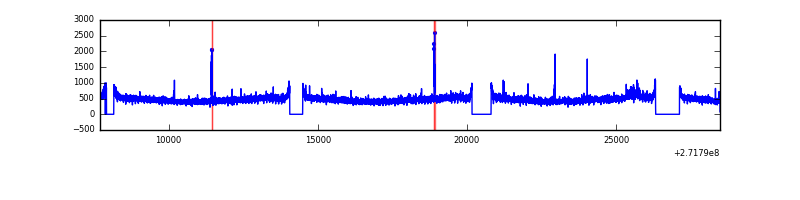 |
| D | 20781 | 18650 | 104 | 104 | 0.50% | 0.56% | 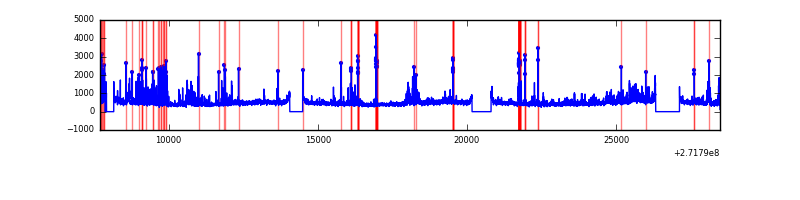 |
Top three noisy pixels from each quadrant. If the there are fewer than three noisy pixels in the level2.evt file, extra rows are filled as -1
| Pixel properties | Quadrant properties | ||||||
|---|---|---|---|---|---|---|---|
| Quadrant | DetID | PixID | Counts | Sigma | Mean | Median | Sigma |
| A | 0 | 253 | 294401 | 649.68 | 2233 | 2184 | 449.8 |
| A | 0 | 226 | 19600 | 38.72 | 2233 | 2184 | 449.8 |
| A | 12 | 194 | 16825 | 32.55 | 2233 | 2184 | 449.8 |
| B | 15 | 222 | 124557 | 286.01 | 2231 | 2174 | 427.9 |
| B | 0 | 213 | 53041 | 118.88 | 2231 | 2174 | 427.9 |
| B | 12 | 111 | 51950 | 116.33 | 2231 | 2174 | 427.9 |
| C | 14 | 238 | 325748 | 645.81 | 2138 | 2150 | 501.1 |
| C | 3 | 233 | 116276 | 227.76 | 2138 | 2150 | 501.1 |
| C | 7 | 247 | 77394 | 150.17 | 2138 | 2150 | 501.1 |
| D | 5 | 222 | 1035888 | 1951.26 | 2173 | 2111 | 529.8 |
| D | 2 | 33 | 166675 | 310.62 | 2173 | 2111 | 529.8 |
| D | 1 | 52 | 153338 | 285.44 | 2173 | 2111 | 529.8 |
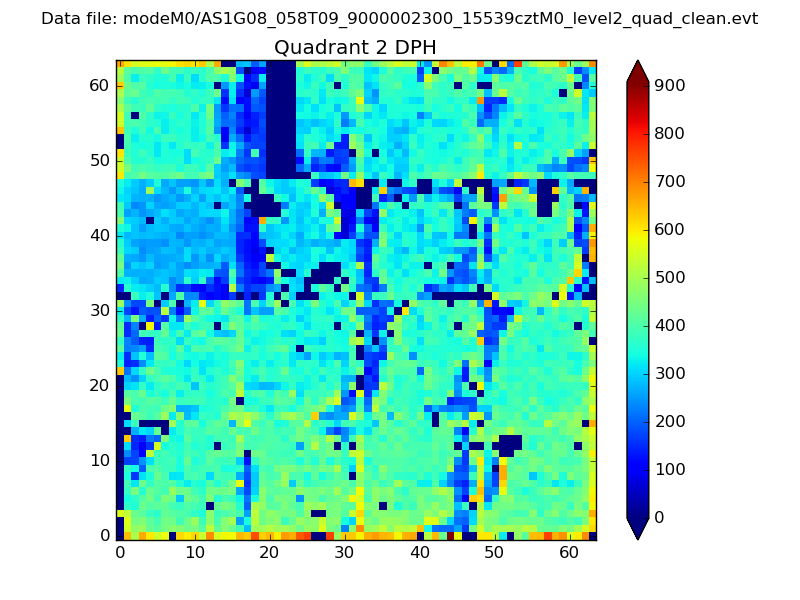
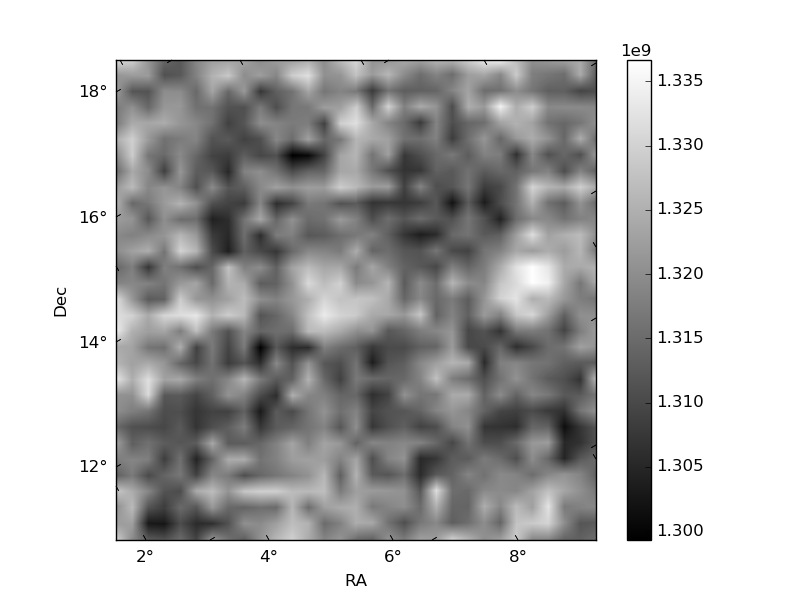
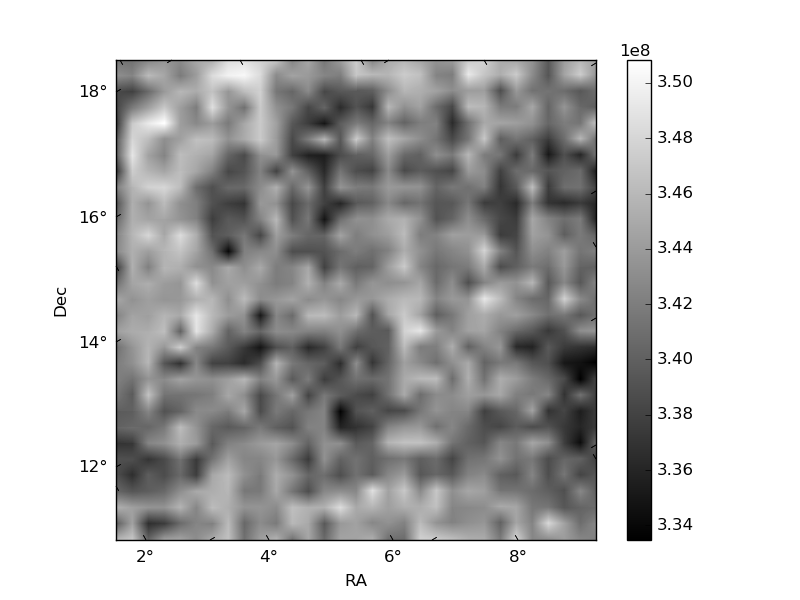
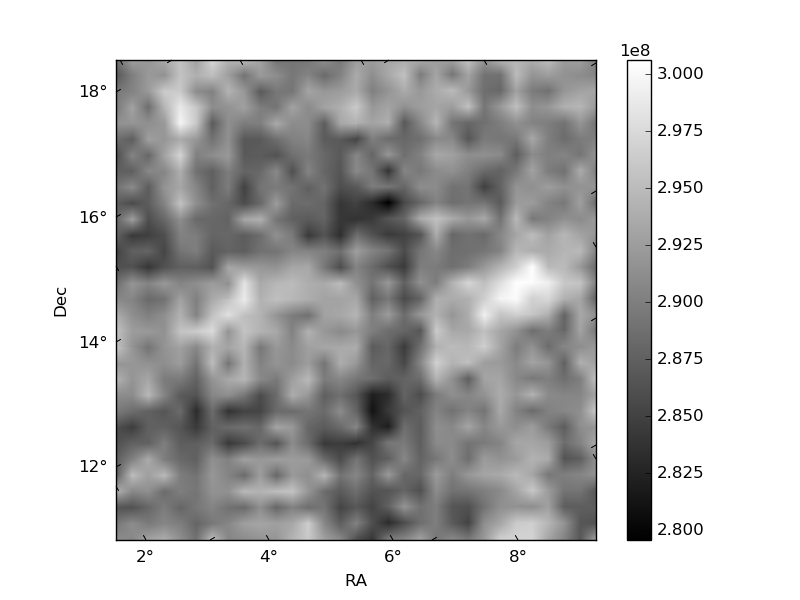
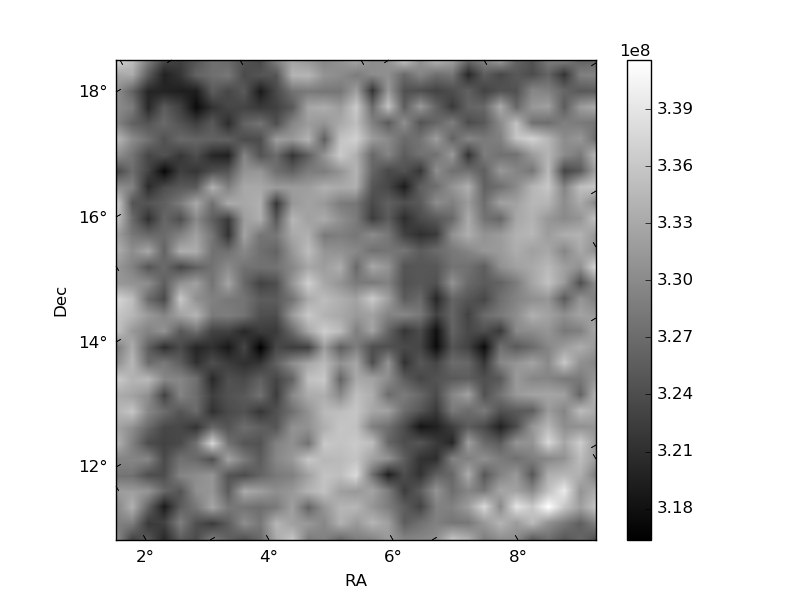
Histogram calculated using DETX and DETY for each event in the final _common_clean file
| Quadrant A | 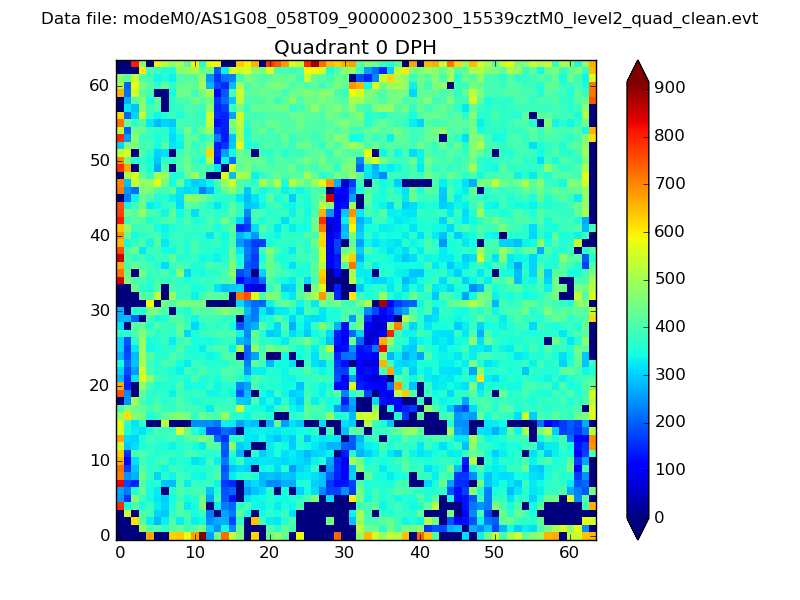 |
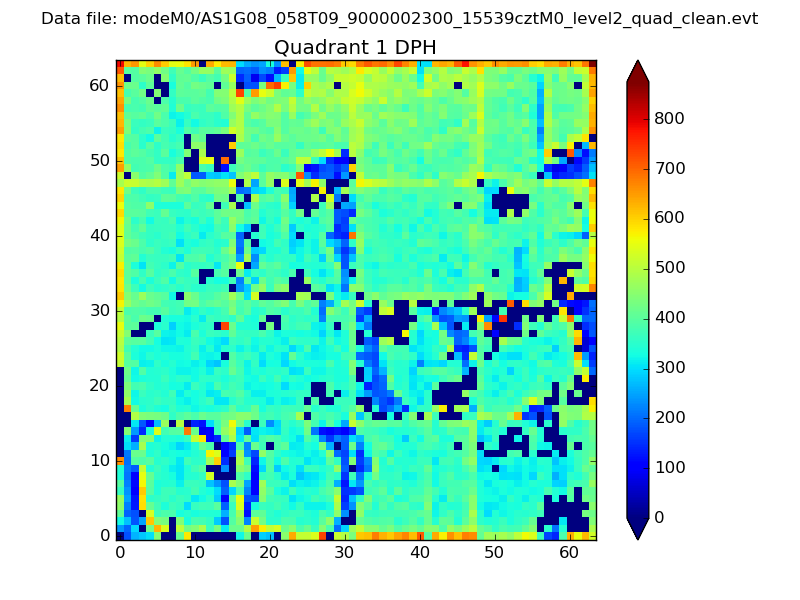 |
Quadrant B |
|---|---|---|---|
| Quadrant D | 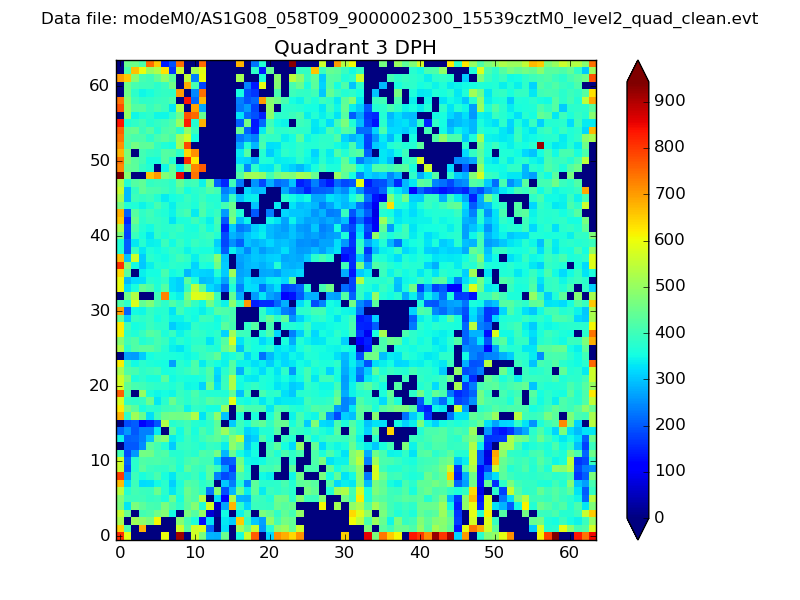 |
 |
Quadrant C |
| Plot type | Count rate plots | Images |
|---|---|---|
| Comparison with Poisson distribution Blue bars denote a histogram of data divided into 1 sec bins. Red curve is a Poisson curve with rate = median count rate of data. |
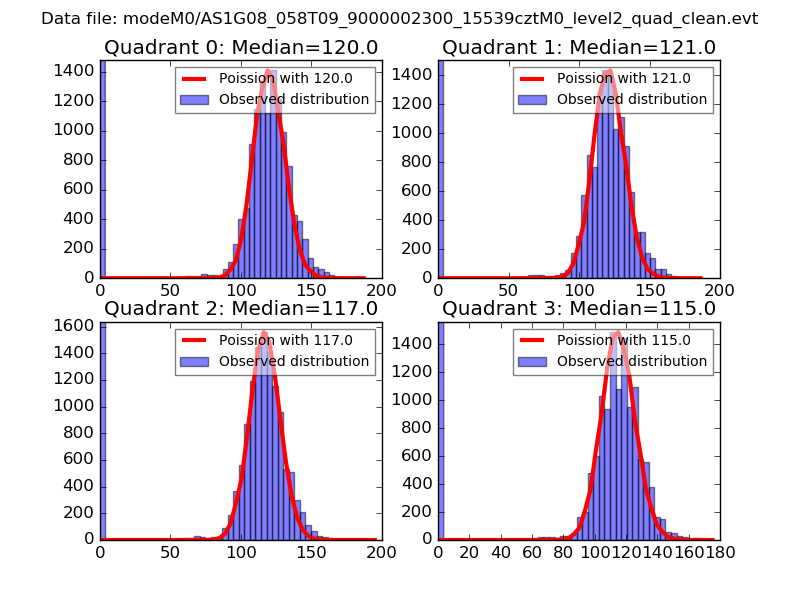 |
 |
| Quadrant-wise count rates Data is divided into 100 sec bins |
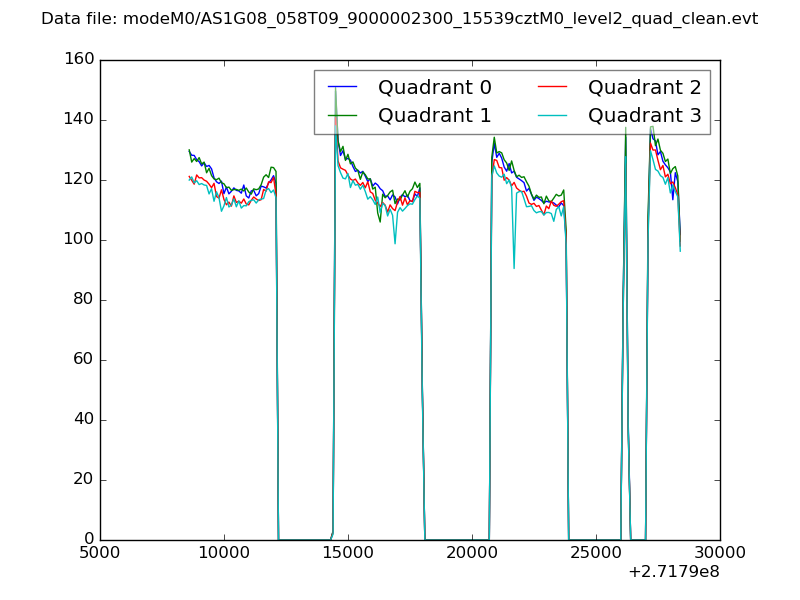 |
|
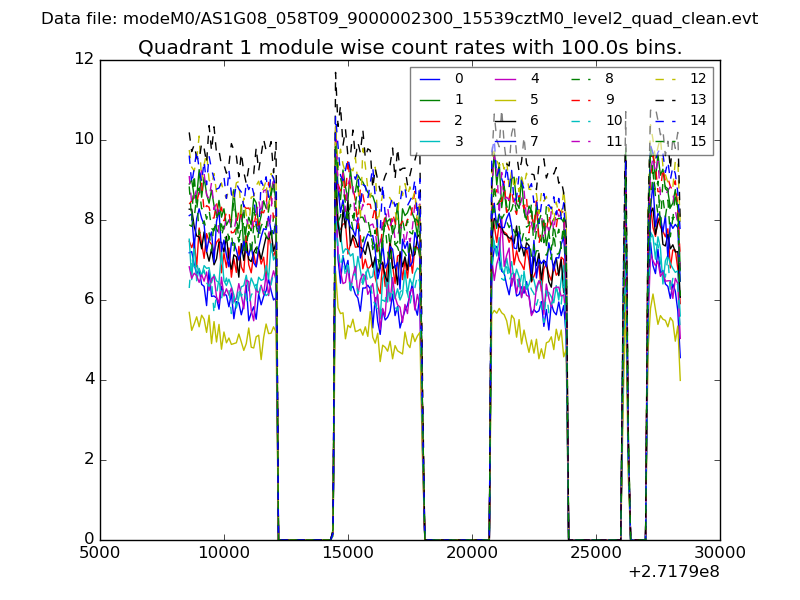
| Module-wise count rates for Quadrant A Data is divided into 100 sec bins |
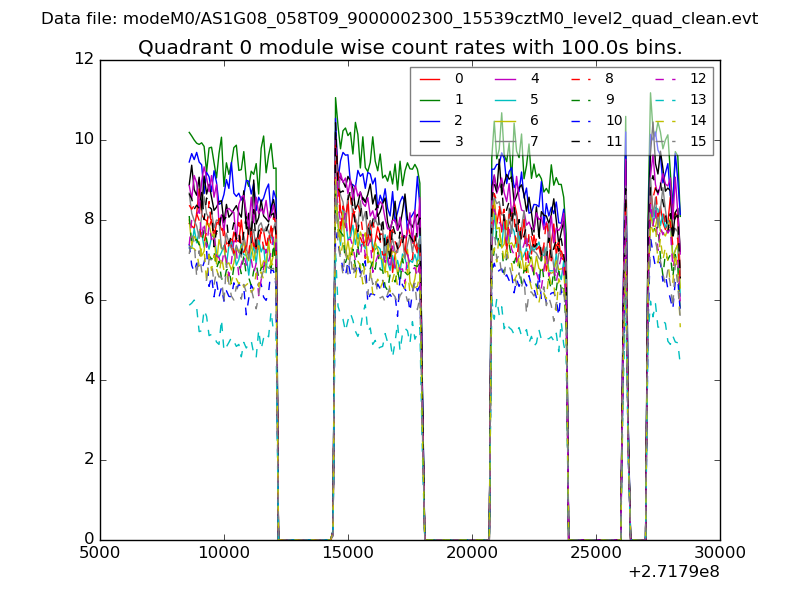 |
 |
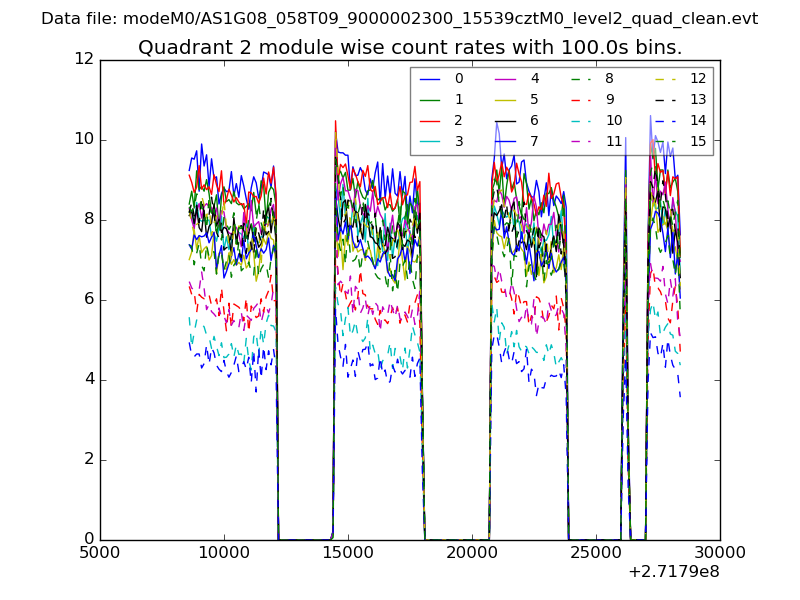
| Module-wise count rates for Quadrant B Data is divided into 100 sec bins |
 |
 |
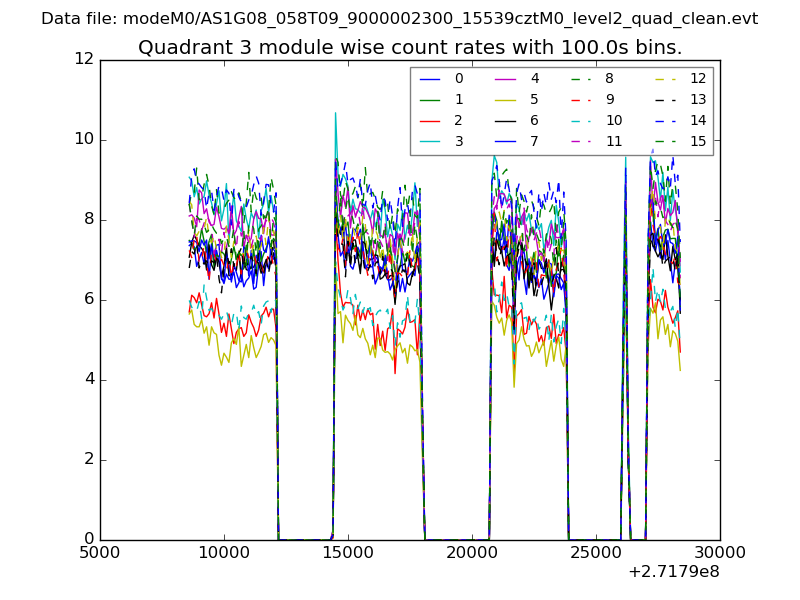
| Module-wise count rates for Quadrant C Data is divided into 100 sec bins |
 |
 |
| Module-wise count rates for Quadrant D Data is divided into 100 sec bins |
 |
 |
| Parameter | Plot |
|---|---|
| CZT HV Monitor | 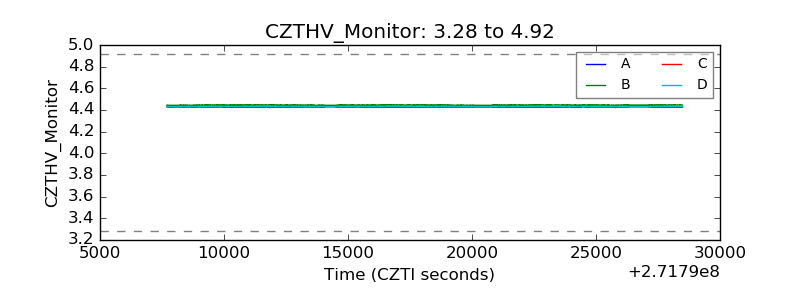 |
| D_VDD | 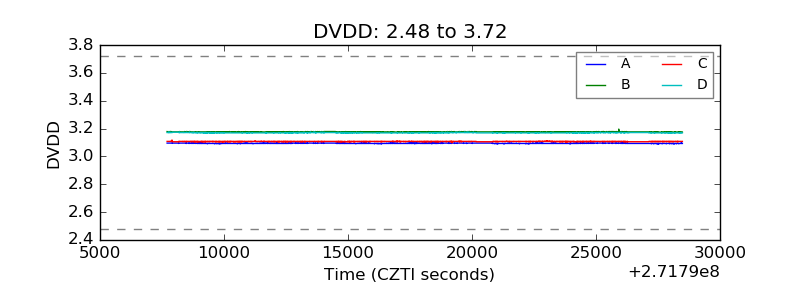 |
| Temperature 1 | 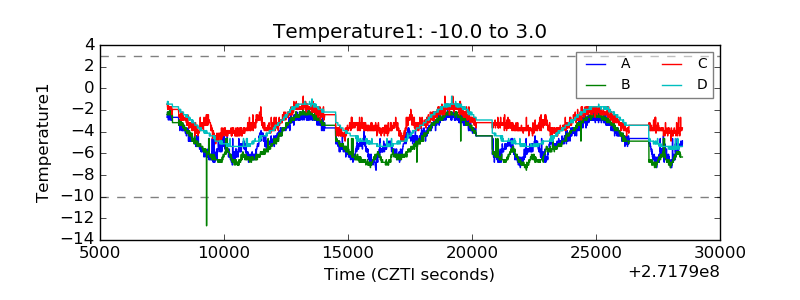 |
| Veto HV Monitor | 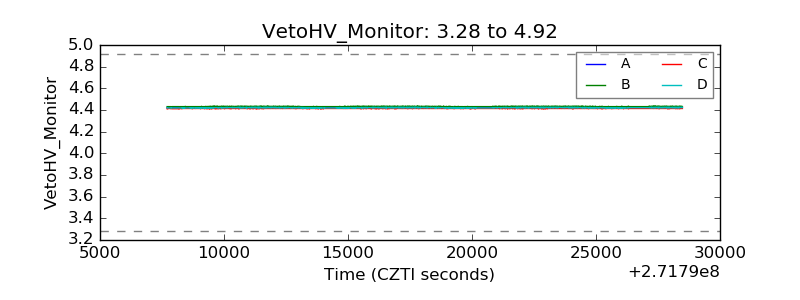 |
| Veto LLD | 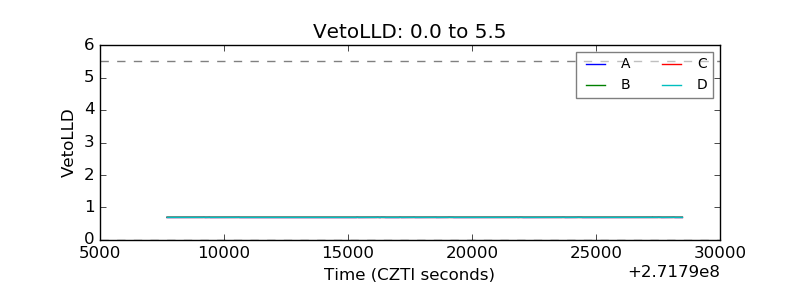 |
| Alpha Counter | 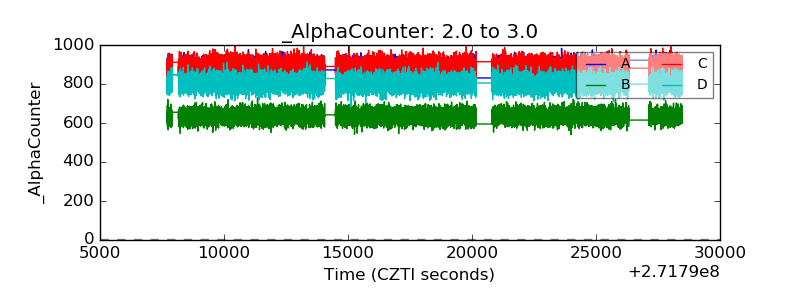 |
| _CPM_Rate | 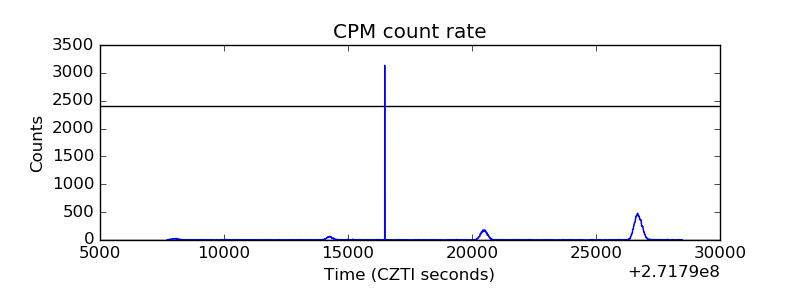 |
| CZT Counter | 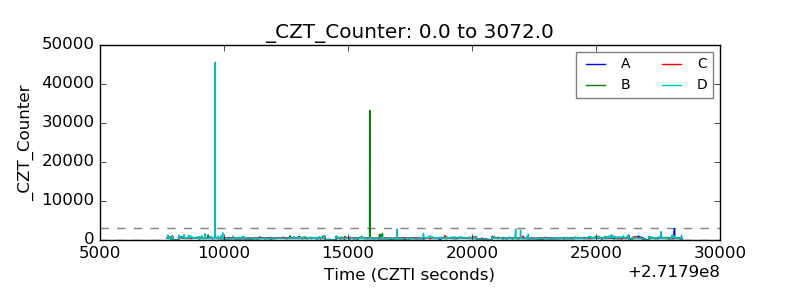 |
| +2.5 Volts monitor |  |
| +5 Volts monitor |  |
| _ROLL_ROT | 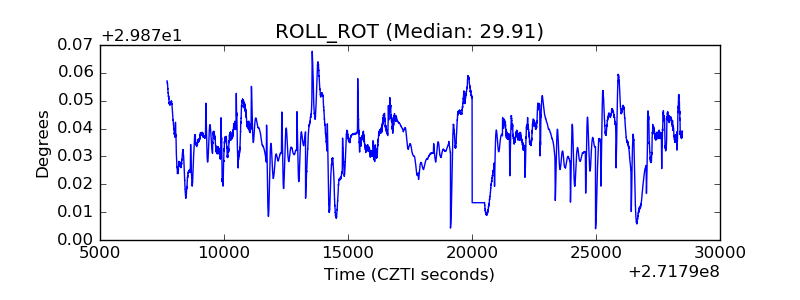 |
| _Roll_DEC | 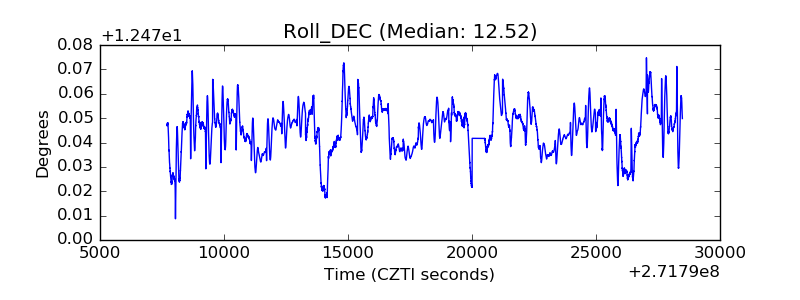 |
| _Roll_RA | 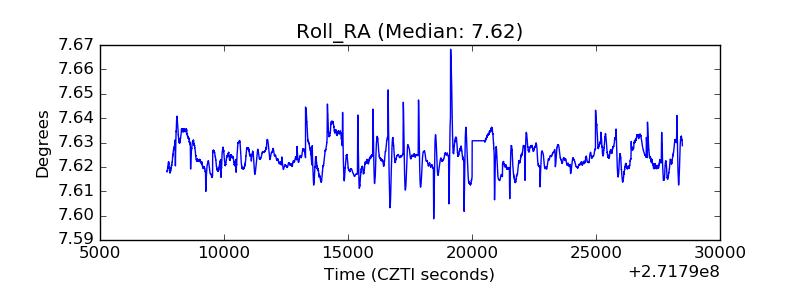 |
| Veto Counter | 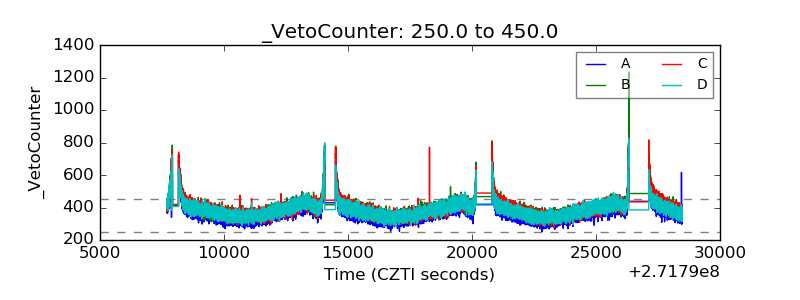 |