| Param | Original file | Final file |
|---|---|---|
| Filename | modeM0/AS1G08_058T09_9000002300_15540cztM0_level2.evt | modeM0/AS1G08_058T09_9000002300_15540cztM0_level2_quad_clean.evt |
| Size (bytes) | 591,192,000 | 92,871,360 |
| Size | 563.8 MB | 88.6 MB |
| Events in quadrant A | 3,655,476 | 597,130 |
| Events in quadrant B | 3,605,007 | 607,633 |
| Events in quadrant C | 3,662,505 | 579,499 |
| Events in quadrant D | 6,478,953 | 512,540 |
| Mode M0 | |||
|---|---|---|---|
| Quadrant | BADHDUFLAG | Total packets | Discarded packets |
| A | 0 | 15473 | 3 |
| B | 0 | 15474 | 2 |
| C | 0 | 15681 | 2 |
| D | 0 | 24435 | 2 |
| Mode M9 | |||
|---|---|---|---|
| Quadrant | BADHDUFLAG | Total packets | Discarded packets |
| A | 0 | 18 | 0 |
| B | 0 | 18 | 0 |
| C | 0 | 18 | 0 |
| D | 0 | 18 | 0 |
| Mode SS | |||
|---|---|---|---|
| Quadrant | BADHDUFLAG | Total packets | Discarded packets |
| A | 0 | 150 | 0 |
| B | 0 | 150 | 0 |
| C | 0 | 150 | 0 |
| D | 0 | 150 | 0 |
| Quadrant | Total seconds | Saturated seconds | Saturation percentage |
|---|---|---|---|
| A | 7412 | 93 | 1.254722% |
| B | 7412 | 95 | 1.281705% |
| C | 7412 | 109 | 1.470588% |
| D | 7412 | 1120 | 15.110631% |
Noise dominated data is calculated using 1-second bins in cleaned event files. If a bin has >2000 counts, and if more than 50% of those come from <1% of pixels, then it is considered to be noise-dominated and hence unusable.
| Quadrant | # 1 sec bins | Bins with >0 counts | Bins with >2000 counts | High rate bins dominated by noise | Noise dominated (total time) | Noise dominated (detector-on time) | Marked lightcurve |
|---|---|---|---|---|---|---|---|
| A | 9153 | 7414 | 16 | 16 | 0.17% | 0.22% | 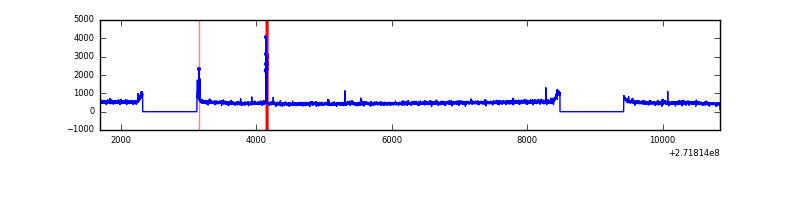 |
| B | 9153 | 7414 | 1 | 1 | 0.01% | 0.01% | 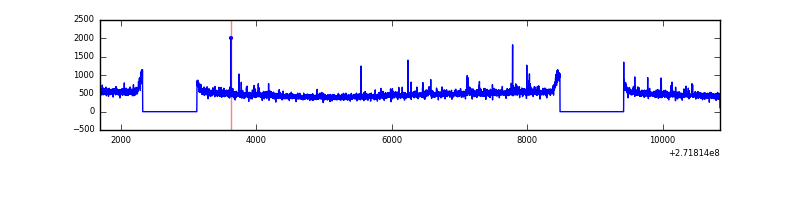 |
| C | 9153 | 7414 | 2 | 2 | 0.02% | 0.03% | 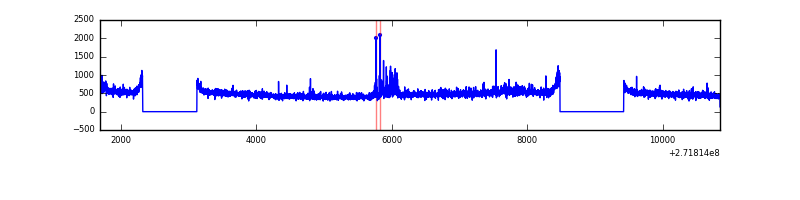 |
| D | 9153 | 7414 | 874 | 874 | 9.55% | 11.79% | 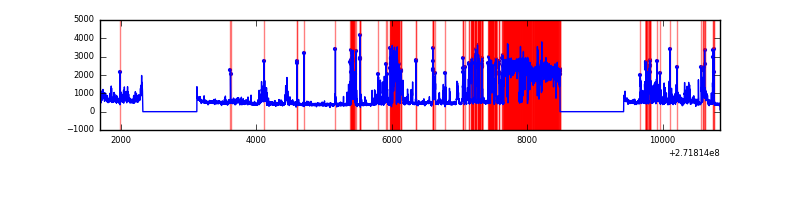 |
Top three noisy pixels from each quadrant. If the there are fewer than three noisy pixels in the level2.evt file, extra rows are filled as -1
| Pixel properties | Quadrant properties | ||||||
|---|---|---|---|---|---|---|---|
| Quadrant | DetID | PixID | Counts | Sigma | Mean | Median | Sigma |
| A | 0 | 253 | 186667 | 1014.12 | 902 | 883 | 183.2 |
| A | 0 | 226 | 7918 | 38.4 | 902 | 883 | 183.2 |
| A | 12 | 194 | 6732 | 31.93 | 902 | 883 | 183.2 |
| B | 0 | 214 | 23129 | 128.18 | 900 | 877 | 173.6 |
| B | 12 | 111 | 21233 | 117.25 | 900 | 877 | 173.6 |
| B | 0 | 213 | 19711 | 108.49 | 900 | 877 | 173.6 |
| C | 14 | 238 | 130317 | 635.1 | 863 | 867 | 203.8 |
| C | 7 | 247 | 121834 | 593.48 | 863 | 867 | 203.8 |
| C | 3 | 233 | 30406 | 144.92 | 863 | 867 | 203.8 |
| D | 1 | 52 | 3117182 | 16416.52 | 780 | 758 | 189.8 |
| D | 5 | 222 | 348432 | 1831.46 | 780 | 758 | 189.8 |
| D | 9 | 68 | 28917 | 148.33 | 780 | 758 | 189.8 |
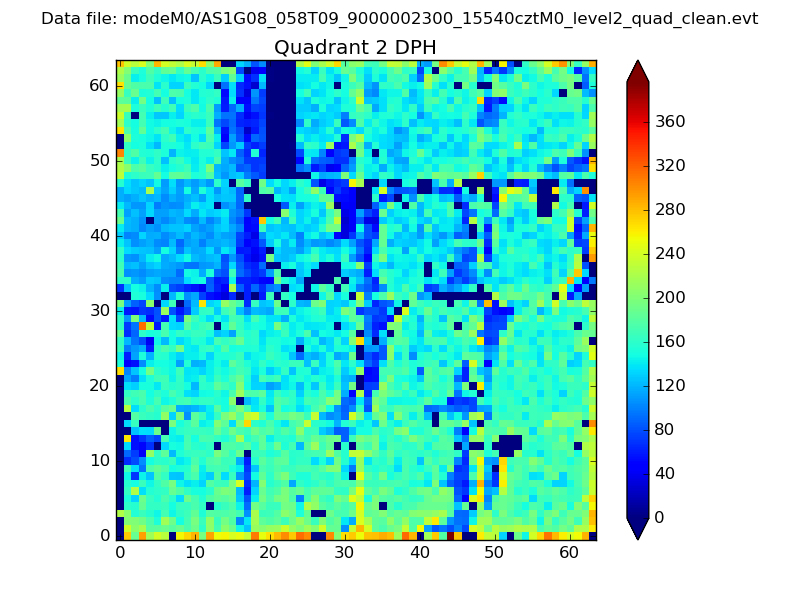
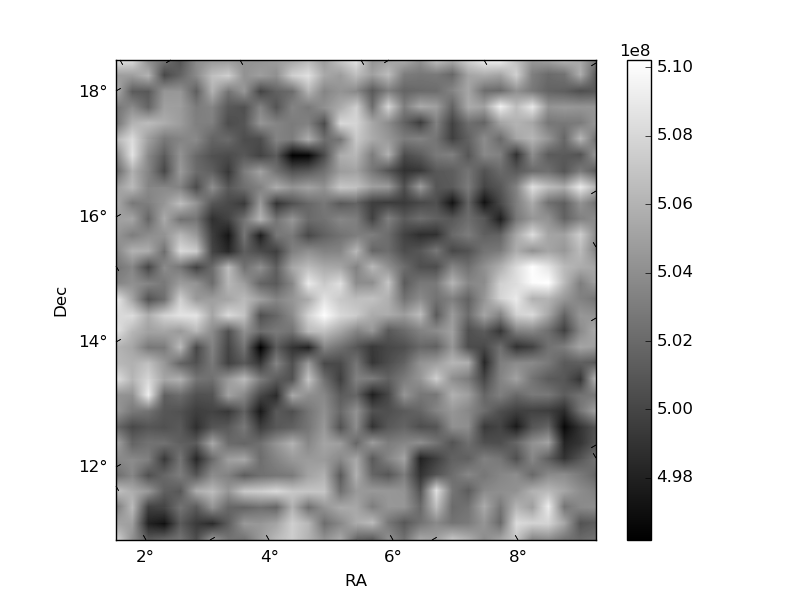
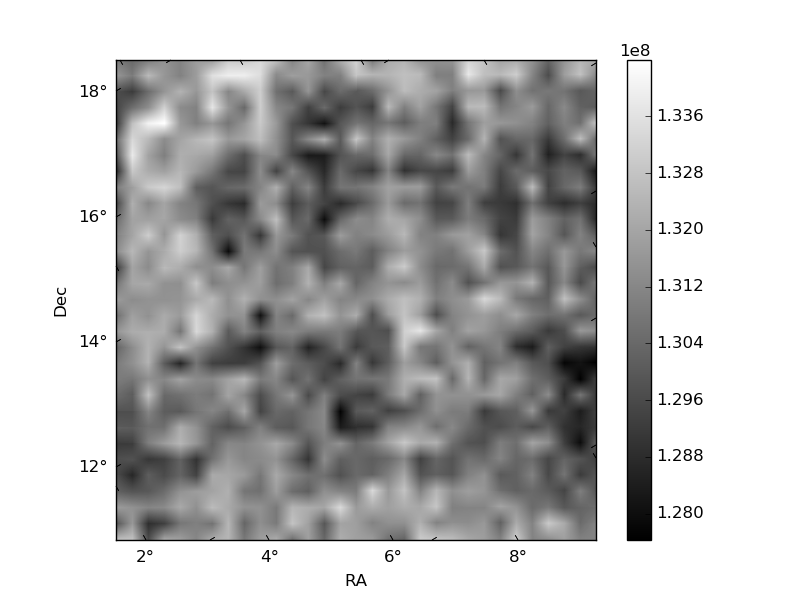
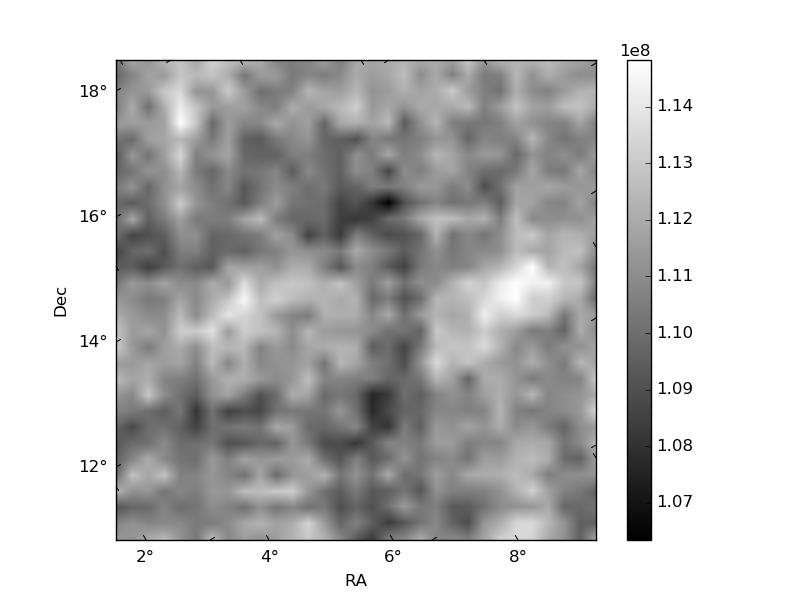
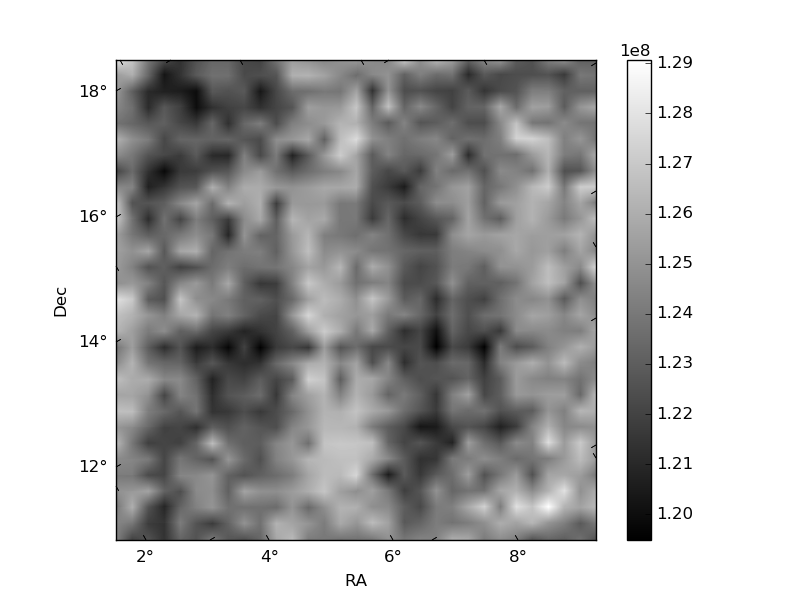
Histogram calculated using DETX and DETY for each event in the final _common_clean file
| Quadrant A | 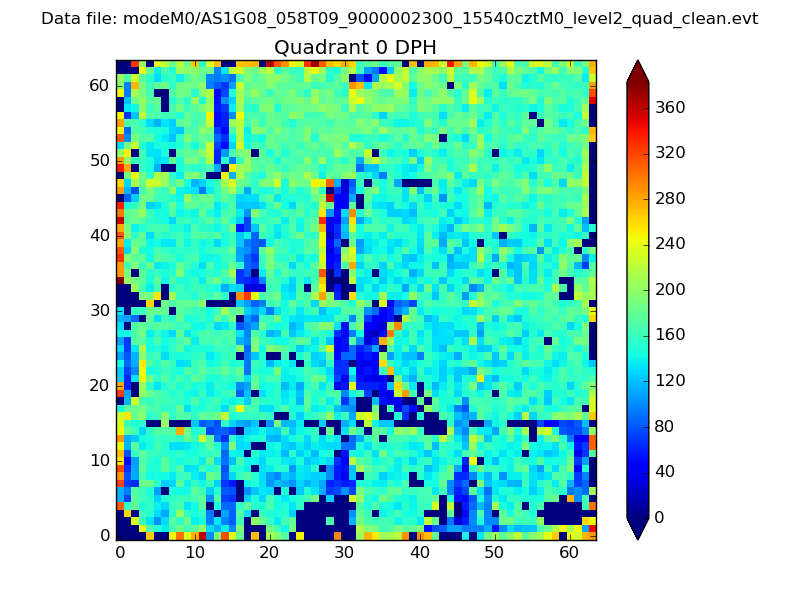 |
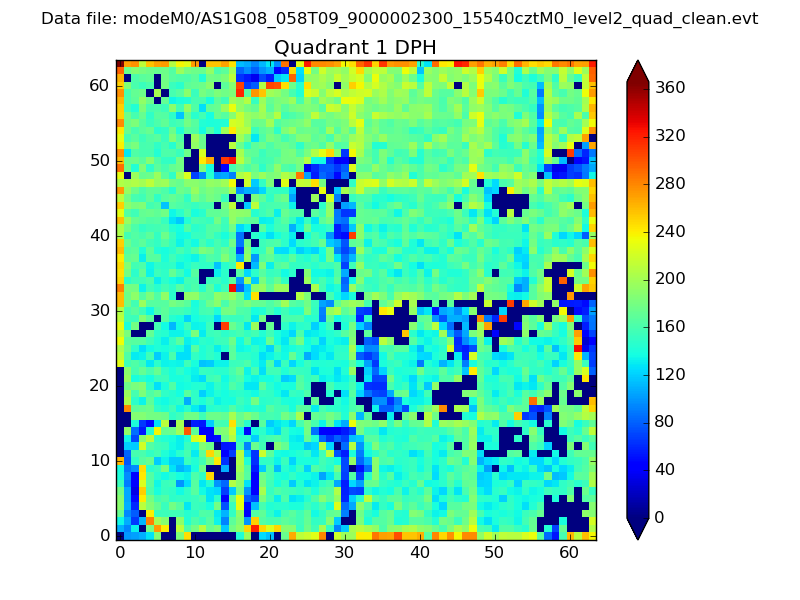 |
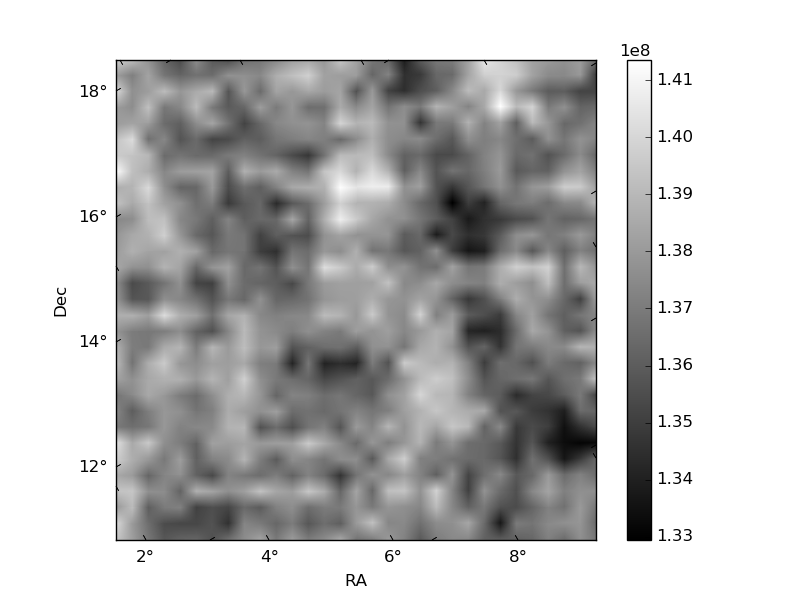
Quadrant B |
|---|---|---|---|
| Quadrant D | 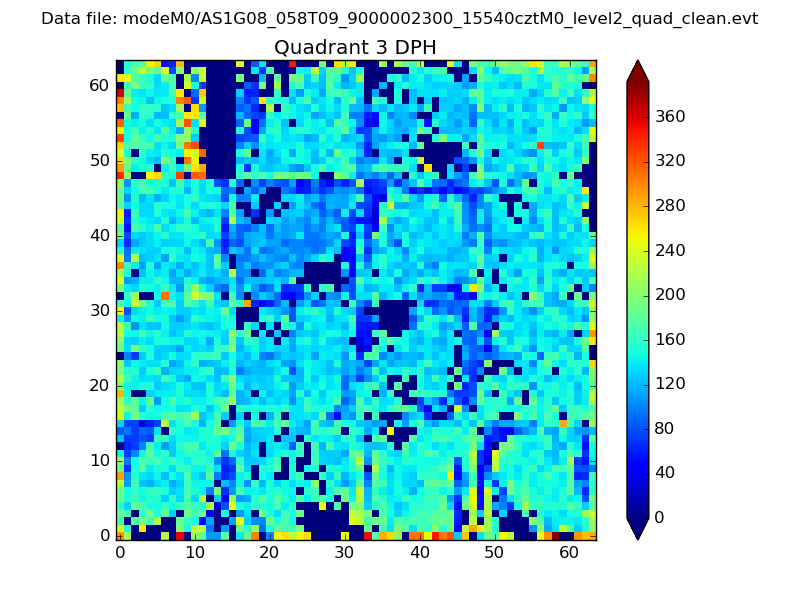 |
 |
Quadrant C |
| Plot type | Count rate plots | Images |
|---|---|---|
| Comparison with Poisson distribution Blue bars denote a histogram of data divided into 1 sec bins. Red curve is a Poisson curve with rate = median count rate of data. |
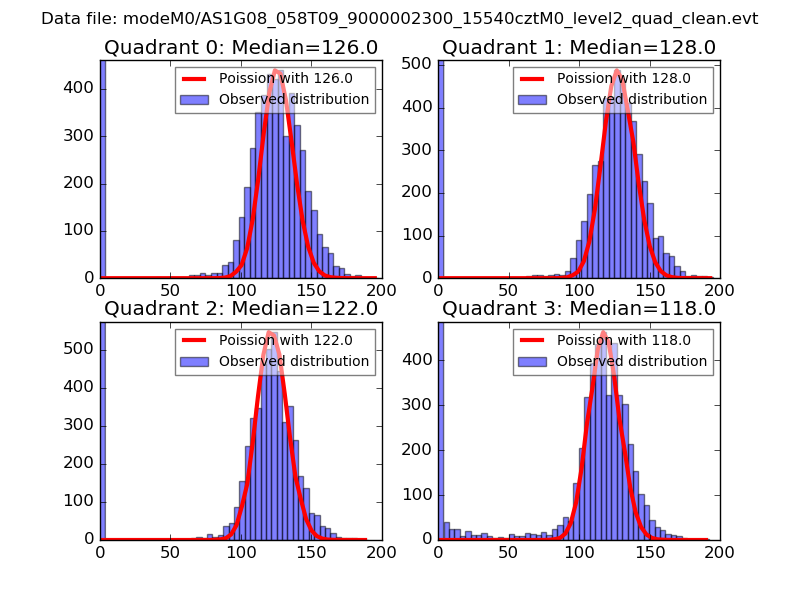 |
 |
| Quadrant-wise count rates Data is divided into 100 sec bins |
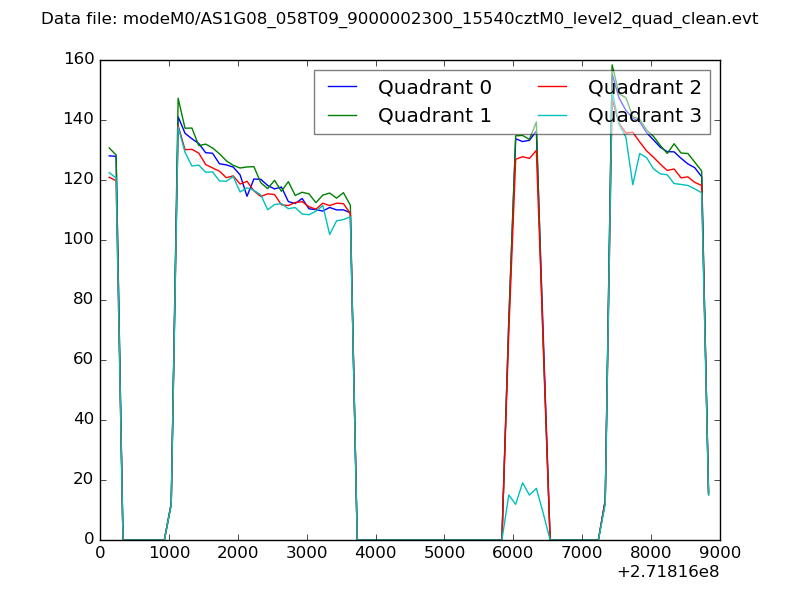 |
|
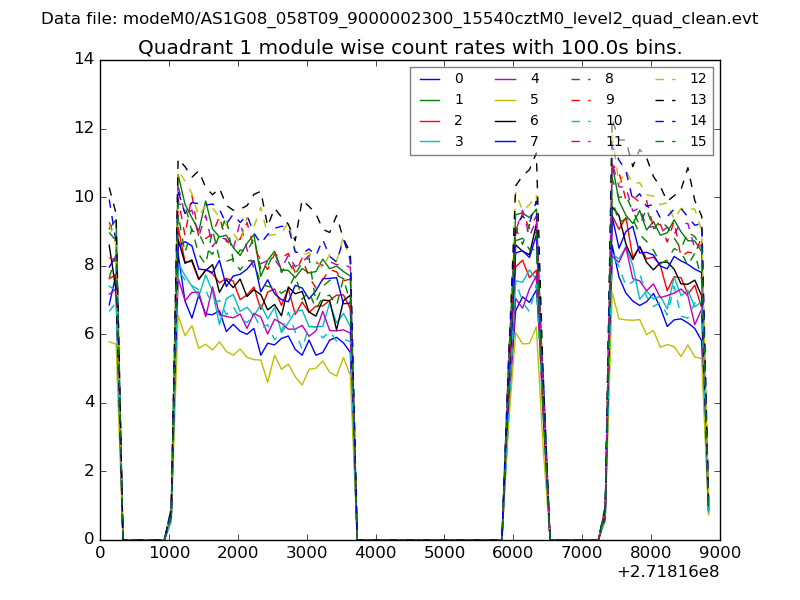
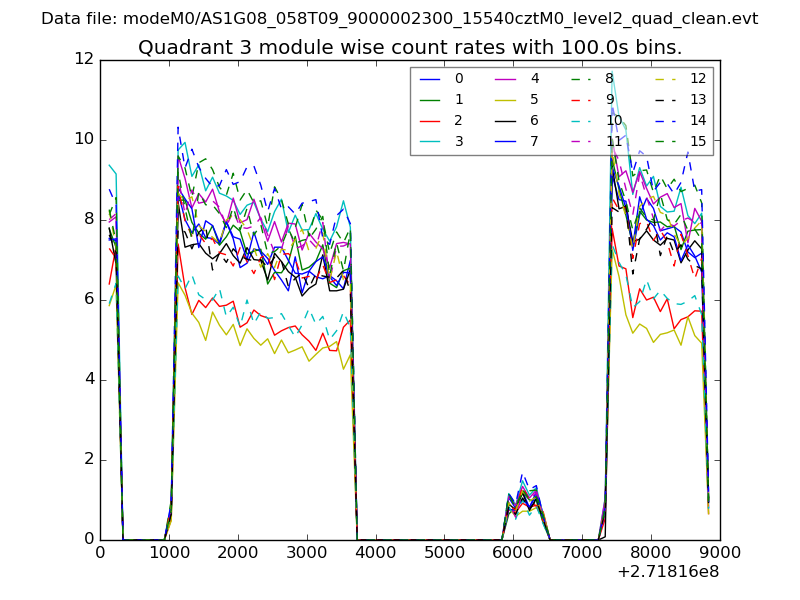
| Module-wise count rates for Quadrant A Data is divided into 100 sec bins |
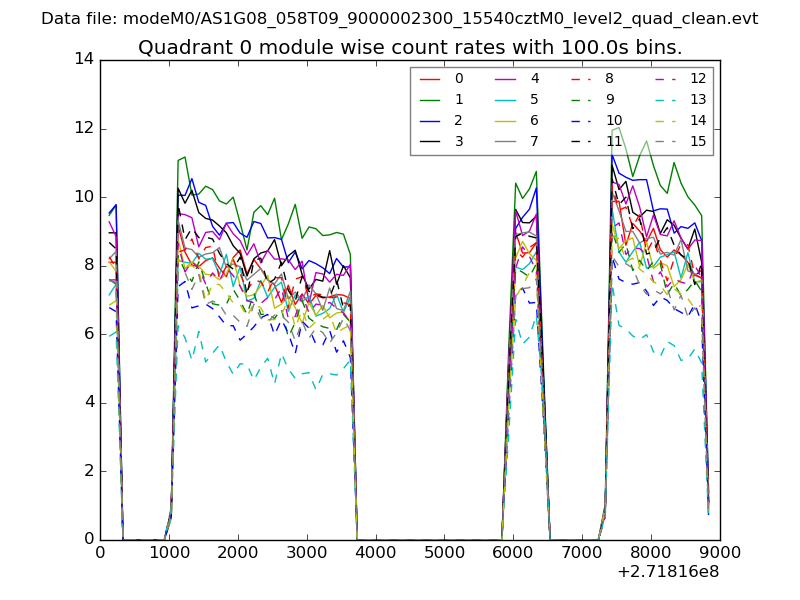 |
 |
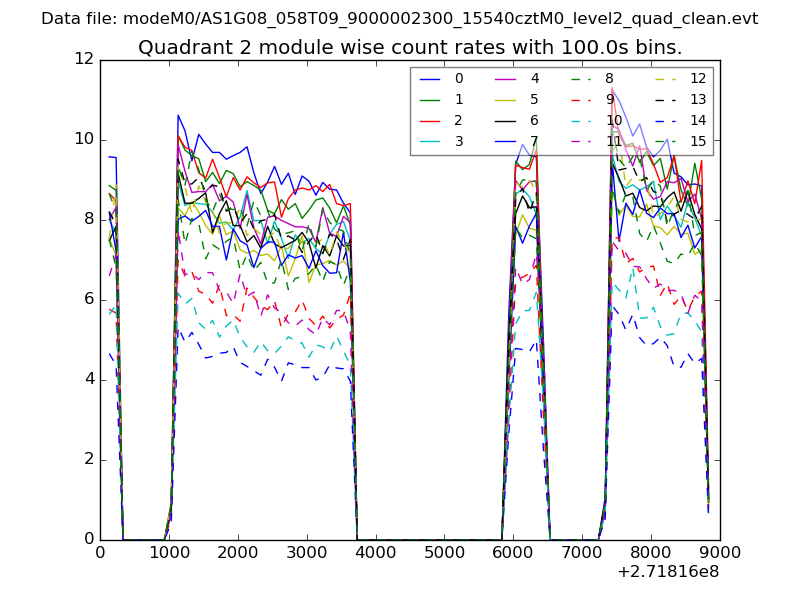
| Module-wise count rates for Quadrant B Data is divided into 100 sec bins |
 |
 |
| Module-wise count rates for Quadrant C Data is divided into 100 sec bins |
 |
 |
| Module-wise count rates for Quadrant D Data is divided into 100 sec bins |
 |
 |
| Parameter | Plot |
|---|---|
| CZT HV Monitor | 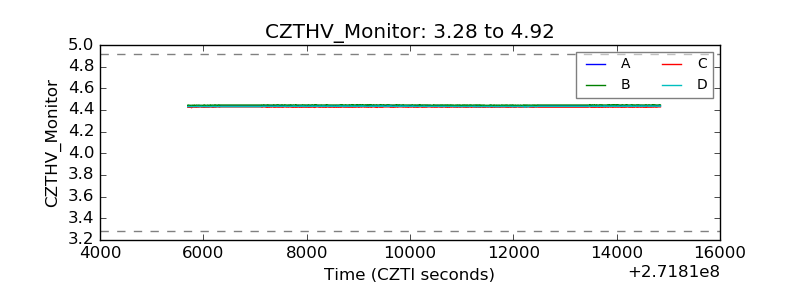 |
| D_VDD | 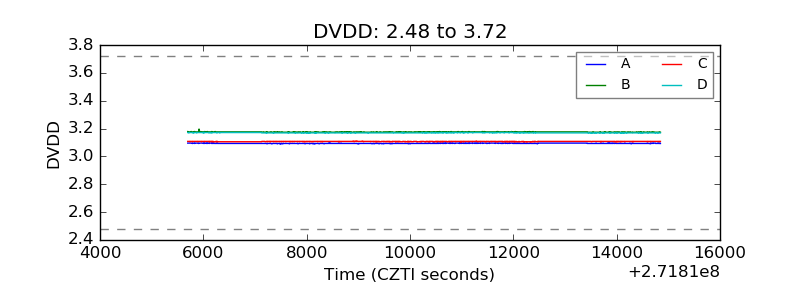 |
| Temperature 1 |  |
| Veto HV Monitor | 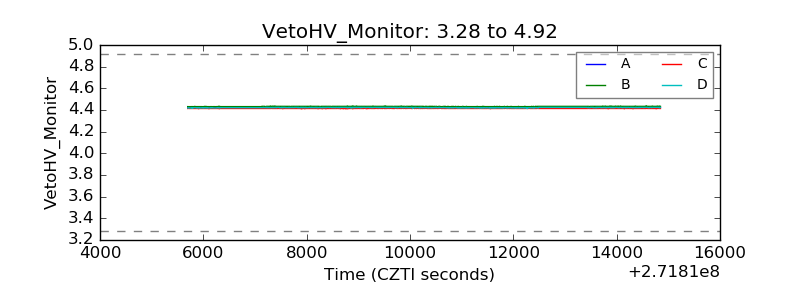 |
| Veto LLD | 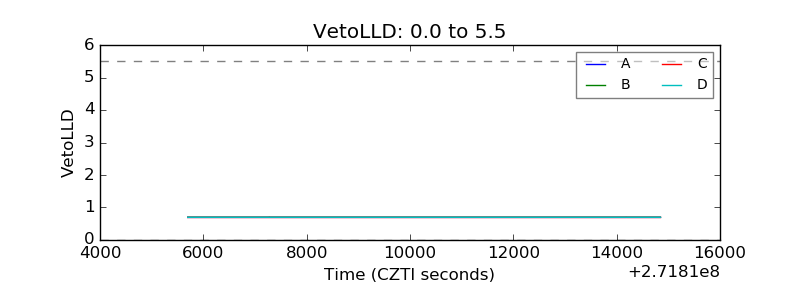 |
| Alpha Counter | 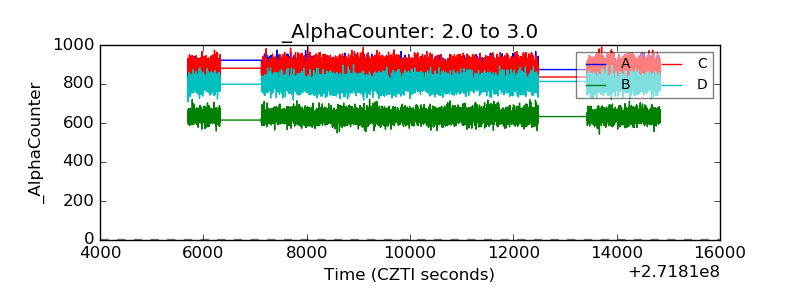 |
| _CPM_Rate | 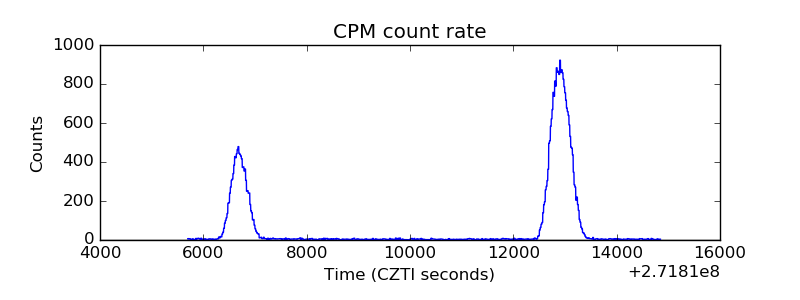 |
| CZT Counter | 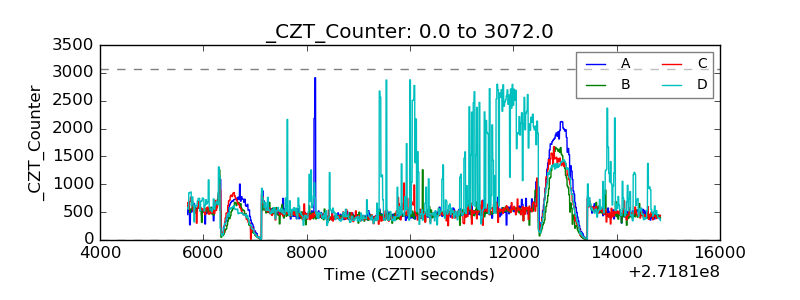 |
| +2.5 Volts monitor |  |
| +5 Volts monitor |  |
| _ROLL_ROT | 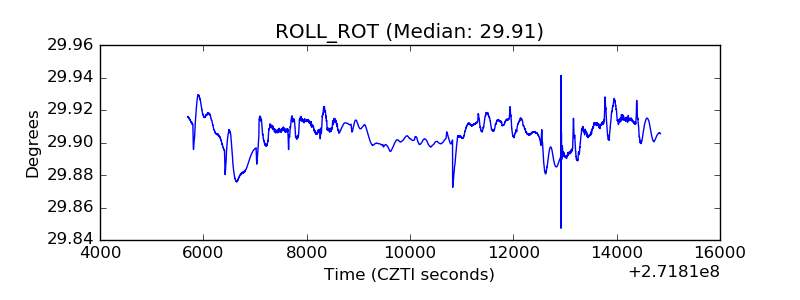 |
| _Roll_DEC |  |
| _Roll_RA | 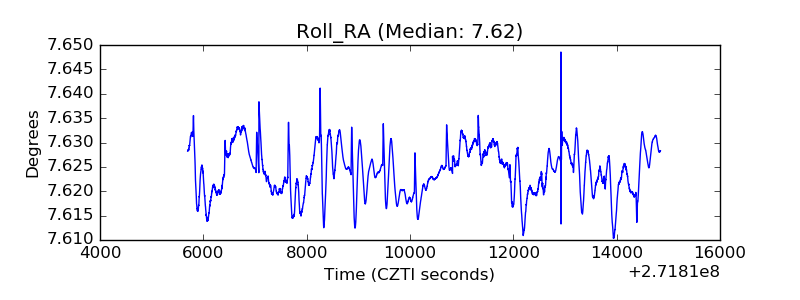 |
| Veto Counter | 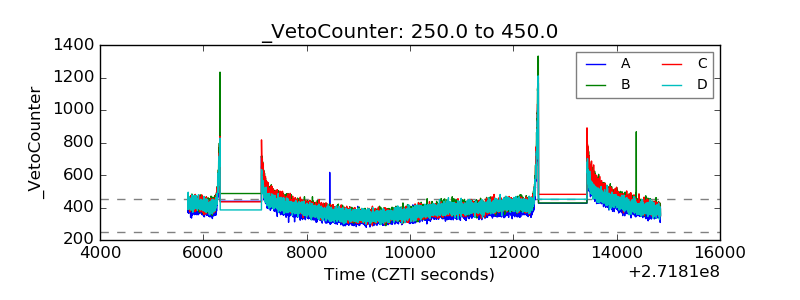 |