| Param | Original file | Final file |
|---|---|---|
| Filename | modeM0/AS1G08_058T09_9000002300_15543cztM0_level2.evt | modeM0/AS1G08_058T09_9000002300_15543cztM0_level2_quad_clean.evt |
| Size (bytes) | 436,224,960 | 84,980,160 |
| Size | 416.0 MB | 81.0 MB |
| Events in quadrant A | 3,200,904 | 548,924 |
| Events in quadrant B | 3,152,019 | 553,236 |
| Events in quadrant C | 3,096,114 | 520,634 |
| Events in quadrant D | 3,339,753 | 516,965 |
| Mode M0 | |||
|---|---|---|---|
| Quadrant | BADHDUFLAG | Total packets | Discarded packets |
| A | 0 | 13051 | 2 |
| B | 0 | 13050 | 1 |
| C | 0 | 12874 | 1 |
| D | 0 | 13823 | 1 |
| Mode M9 | |||
|---|---|---|---|
| Quadrant | BADHDUFLAG | Total packets | Discarded packets |
| A | 0 | 12 | 0 |
| B | 0 | 12 | 0 |
| C | 0 | 12 | 0 |
| D | 0 | 12 | 0 |
| Mode SS | |||
|---|---|---|---|
| Quadrant | BADHDUFLAG | Total packets | Discarded packets |
| A | 0 | 128 | 0 |
| B | 0 | 128 | 0 |
| C | 0 | 128 | 0 |
| D | 0 | 128 | 0 |
| Quadrant | Total seconds | Saturated seconds | Saturation percentage |
|---|---|---|---|
| A | 6206 | 36 | 0.580084% |
| B | 6206 | 46 | 0.741218% |
| C | 6206 | 40 | 0.644538% |
| D | 6206 | 52 | 0.837899% |
Noise dominated data is calculated using 1-second bins in cleaned event files. If a bin has >2000 counts, and if more than 50% of those come from <1% of pixels, then it is considered to be noise-dominated and hence unusable.
| Quadrant | # 1 sec bins | Bins with >0 counts | Bins with >2000 counts | High rate bins dominated by noise | Noise dominated (total time) | Noise dominated (detector-on time) | Marked lightcurve |
|---|---|---|---|---|---|---|---|
| A | 7422 | 6208 | 1 | 1 | 0.01% | 0.02% | 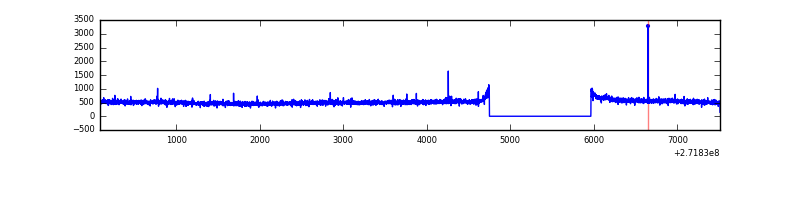 |
| B | 7422 | 6207 | 8 | 8 | 0.11% | 0.13% | 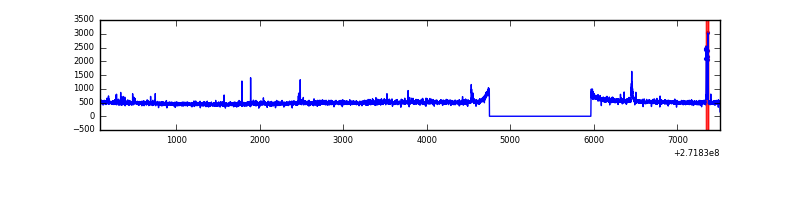 |
| C | 7422 | 6208 | 2 | 2 | 0.03% | 0.03% | 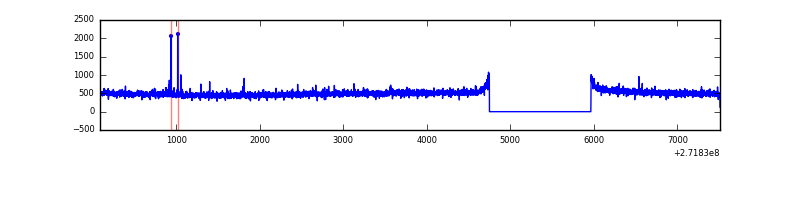 |
| D | 7422 | 6208 | 39 | 39 | 0.53% | 0.63% | 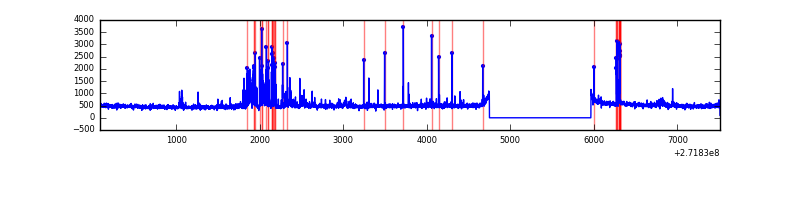 |
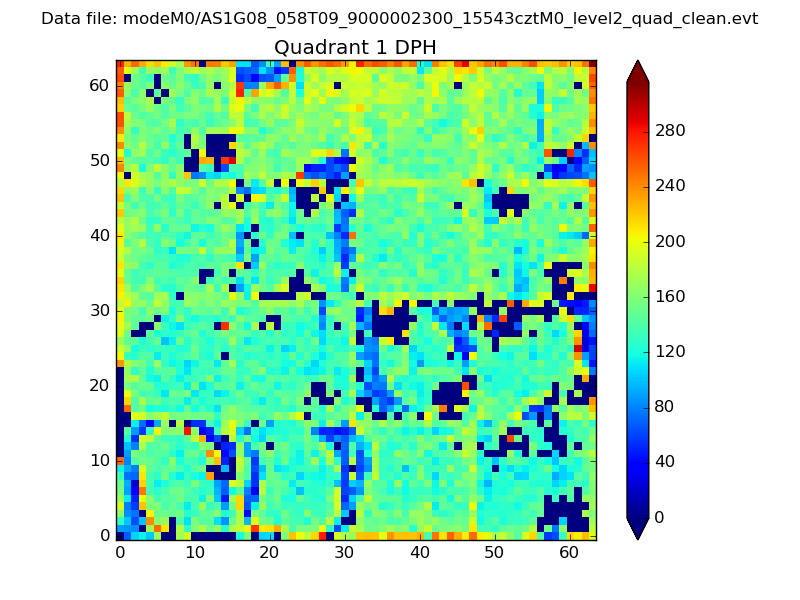
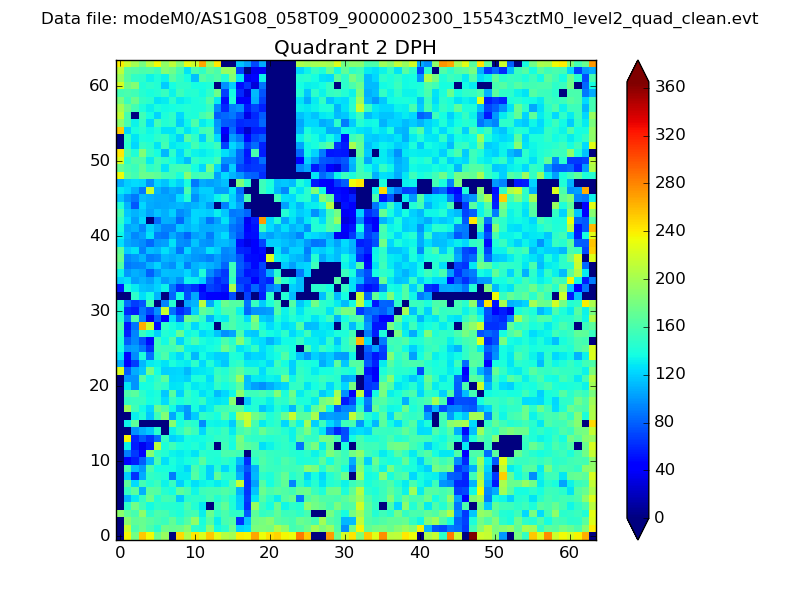
Top three noisy pixels from each quadrant. If the there are fewer than three noisy pixels in the level2.evt file, extra rows are filled as -1
| Pixel properties | Quadrant properties | ||||||
|---|---|---|---|---|---|---|---|
| Quadrant | DetID | PixID | Counts | Sigma | Mean | Median | Sigma |
| A | 0 | 253 | 133270 | 829.67 | 797 | 783 | 159.7 |
| A | 0 | 226 | 7150 | 39.87 | 797 | 783 | 159.7 |
| A | 9 | 143 | 6392 | 35.12 | 797 | 783 | 159.7 |
| B | 15 | 201 | 29382 | 192.02 | 785 | 766 | 149.0 |
| B | 12 | 111 | 17342 | 111.23 | 785 | 766 | 149.0 |
| B | 15 | 222 | 15561 | 99.28 | 785 | 766 | 149.0 |
| C | 14 | 238 | 116719 | 668.52 | 746 | 752 | 173.5 |
| C | 3 | 233 | 28277 | 158.67 | 746 | 752 | 173.5 |
| C | 10 | 22 | 27522 | 154.32 | 746 | 752 | 173.5 |
| D | 5 | 222 | 316039 | 1683.12 | 766 | 743 | 187.3 |
| D | 1 | 52 | 87579 | 463.55 | 766 | 743 | 187.3 |
| D | 2 | 234 | 24211 | 125.28 | 766 | 743 | 187.3 |
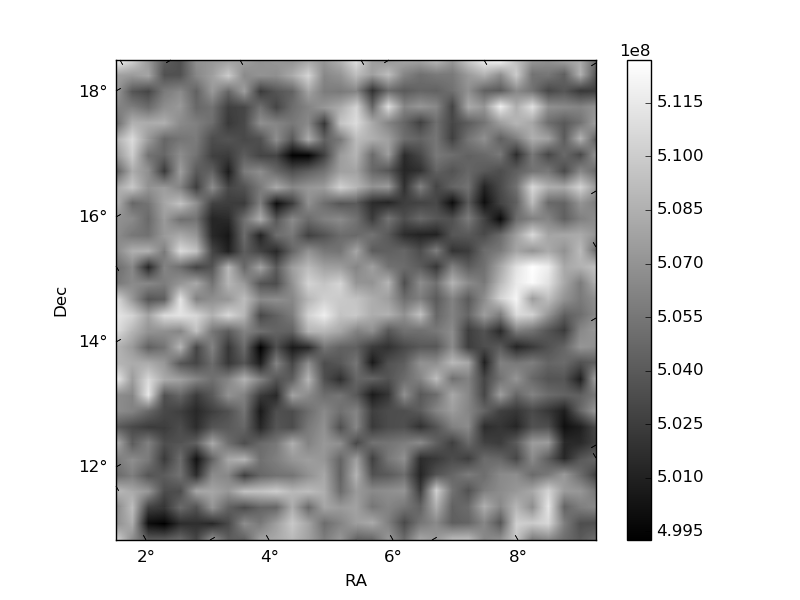
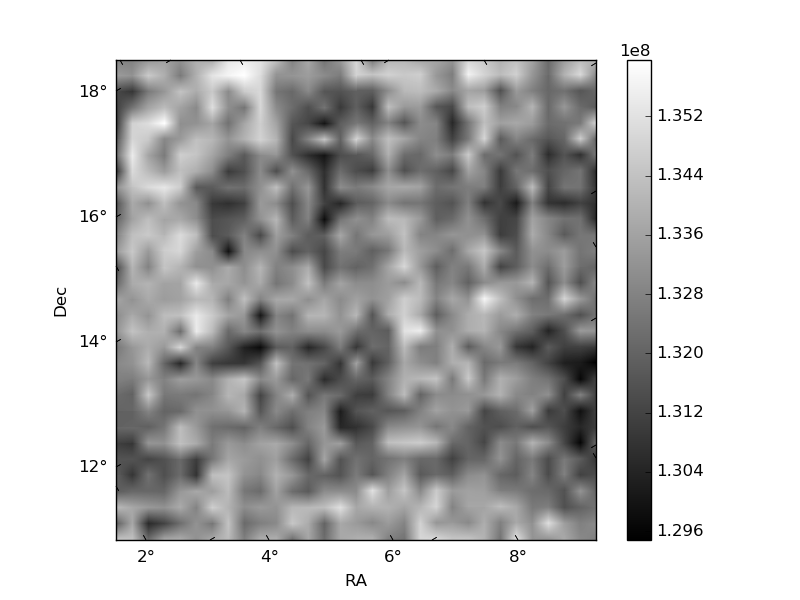
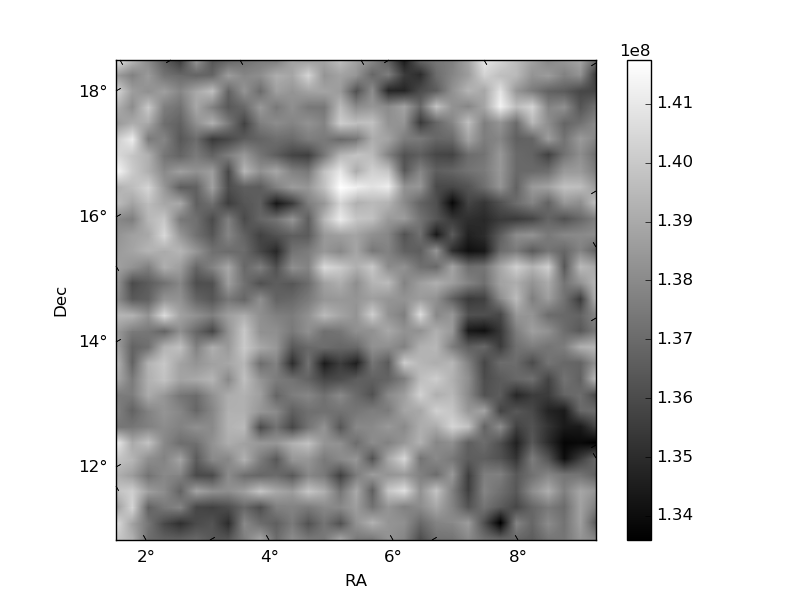
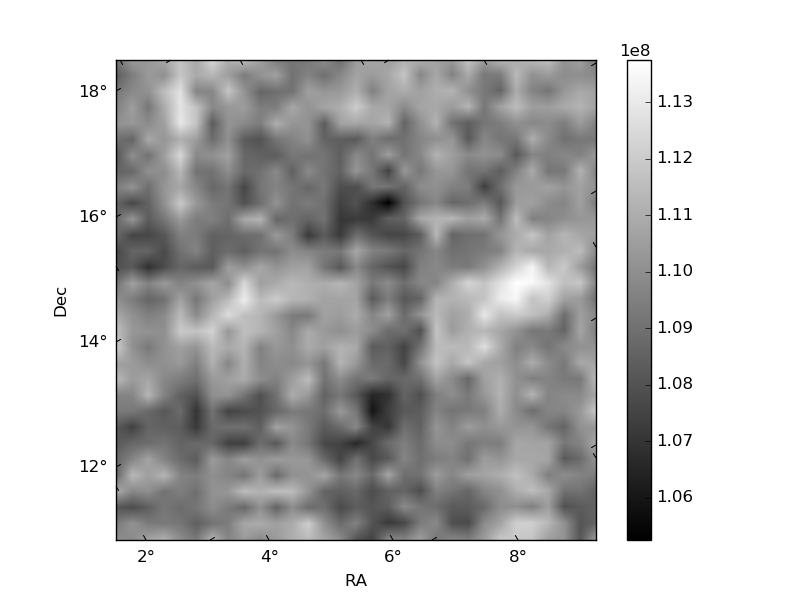
Histogram calculated using DETX and DETY for each event in the final _common_clean file
| Quadrant A | 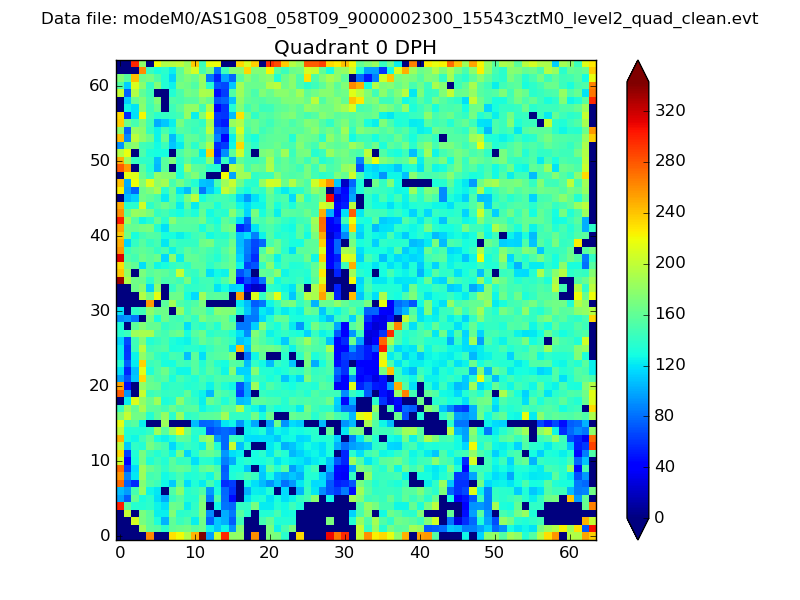 |
 |
Quadrant B |
|---|---|---|---|
| Quadrant D | 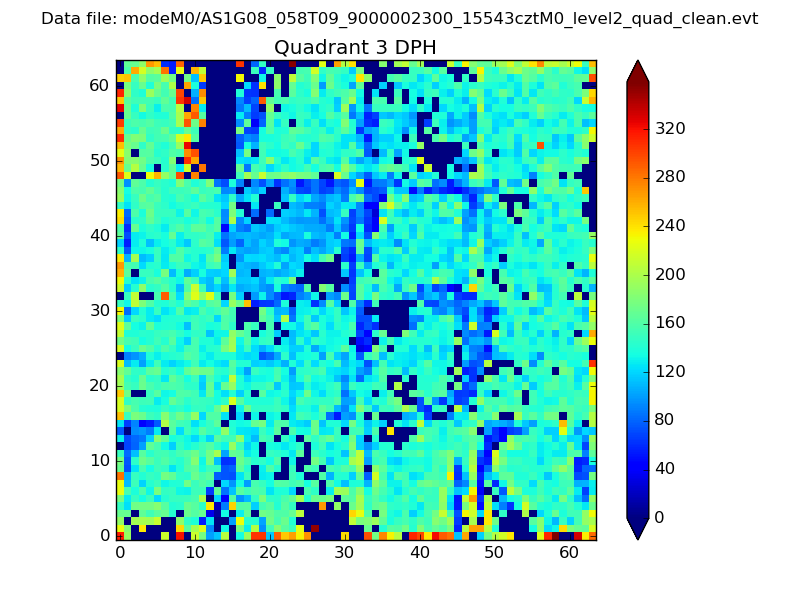 |
 |
Quadrant C |
| Plot type | Count rate plots | Images |
|---|---|---|
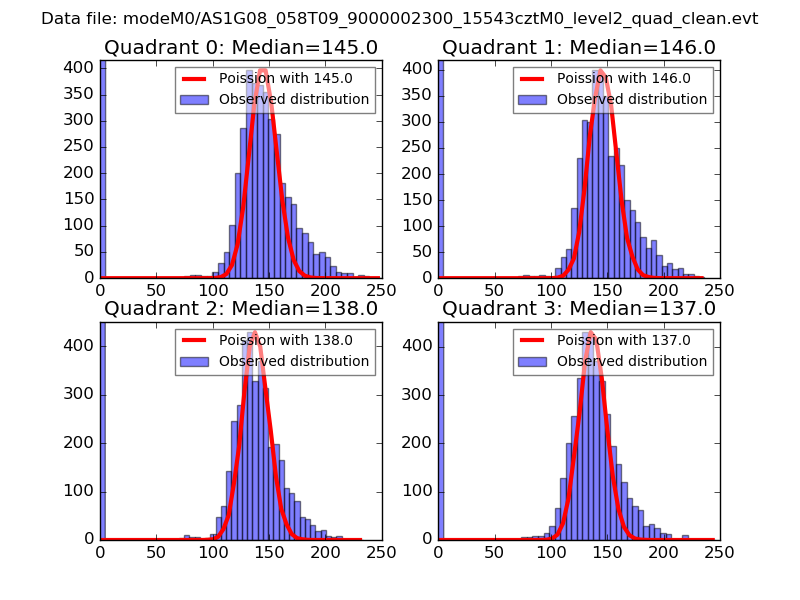
| Comparison with Poisson distribution Blue bars denote a histogram of data divided into 1 sec bins. Red curve is a Poisson curve with rate = median count rate of data. |
 |
 |
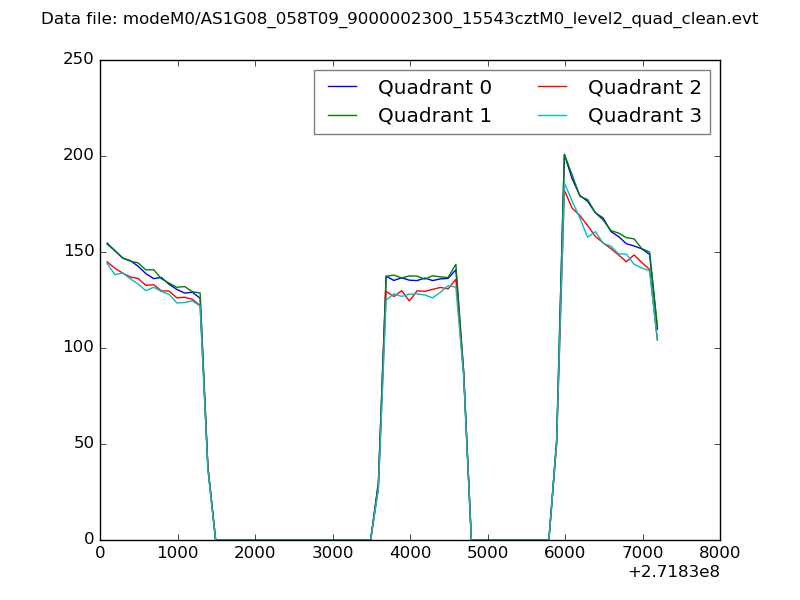
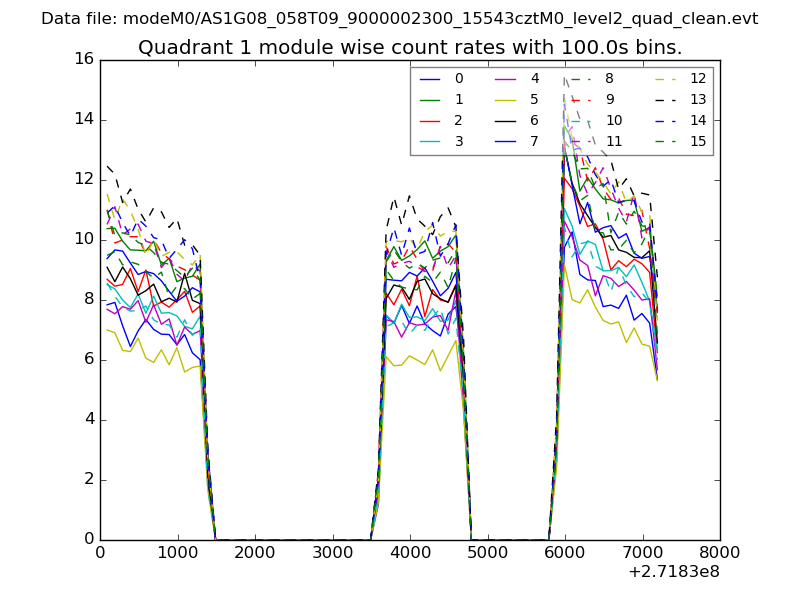
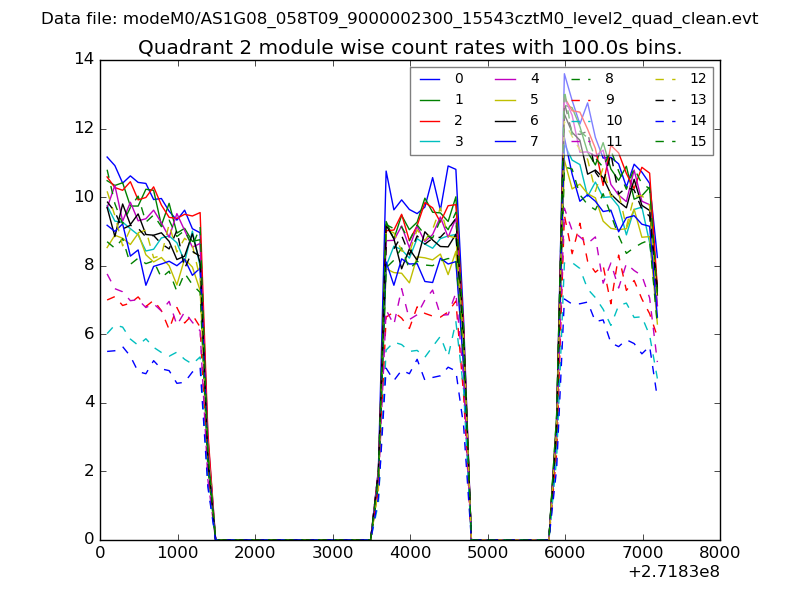
| Quadrant-wise count rates Data is divided into 100 sec bins |
 |
|
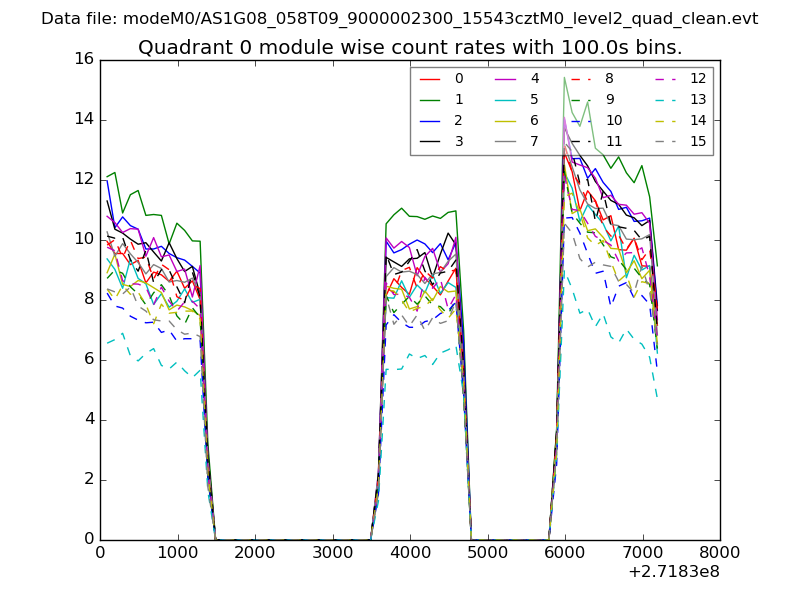
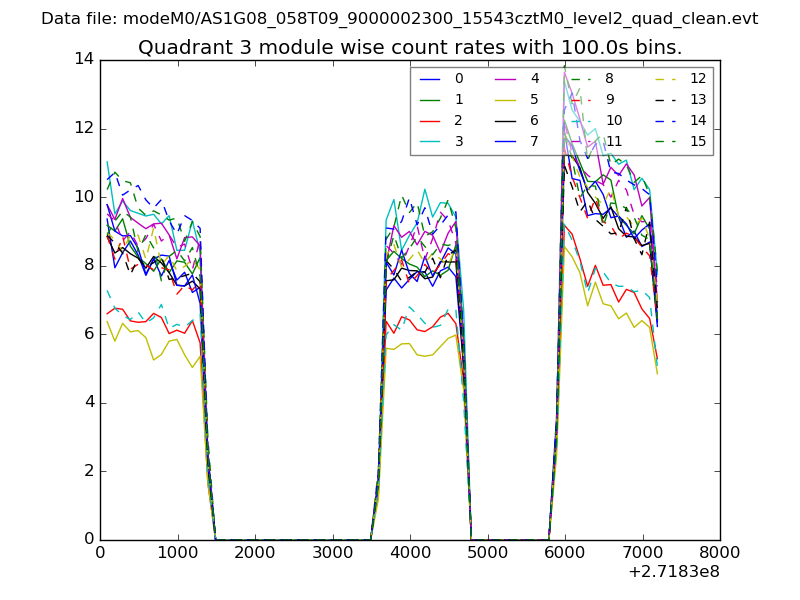
| Module-wise count rates for Quadrant A Data is divided into 100 sec bins |
 |
 |
| Module-wise count rates for Quadrant B Data is divided into 100 sec bins |
 |
 |
| Module-wise count rates for Quadrant C Data is divided into 100 sec bins |
 |
 |
| Module-wise count rates for Quadrant D Data is divided into 100 sec bins |
 |
 |
| Parameter | Plot |
|---|---|
| CZT HV Monitor | 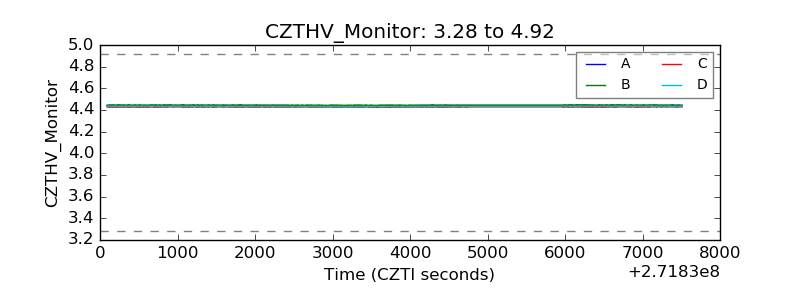 |
| D_VDD | 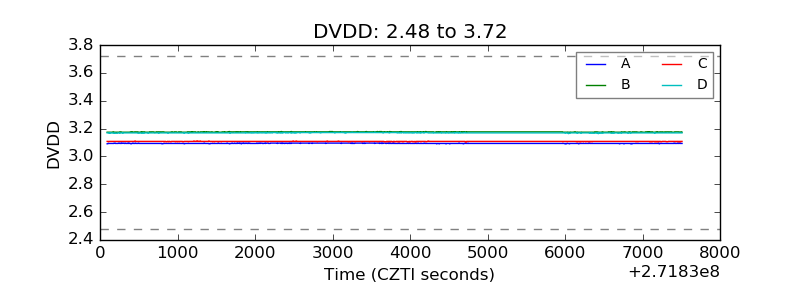 |
| Temperature 1 | 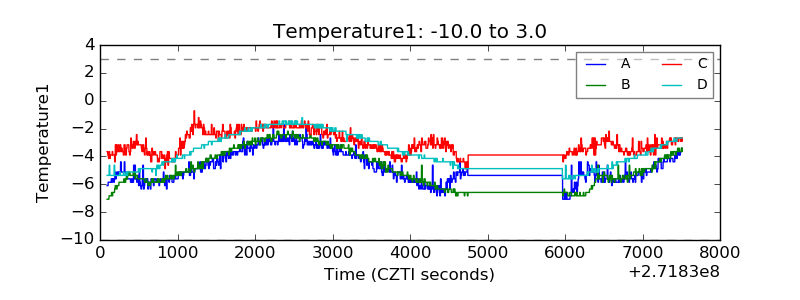 |
| Veto HV Monitor | 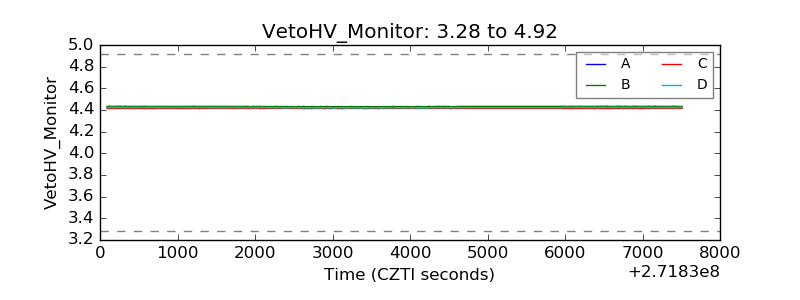 |
| Veto LLD | 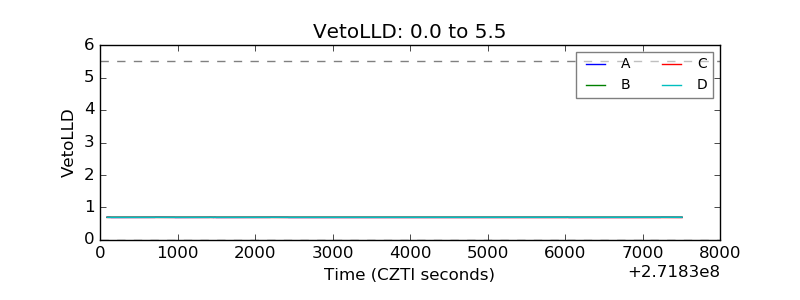 |
| Alpha Counter | 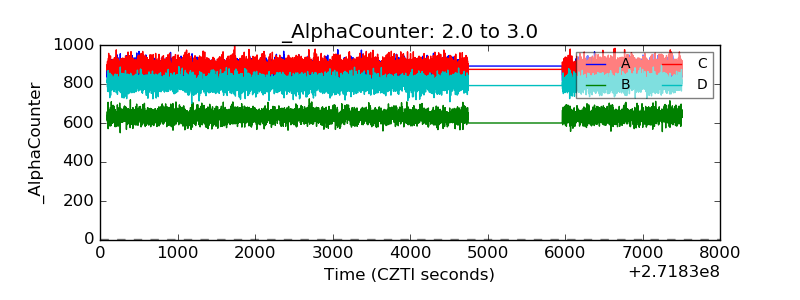 |
| _CPM_Rate | 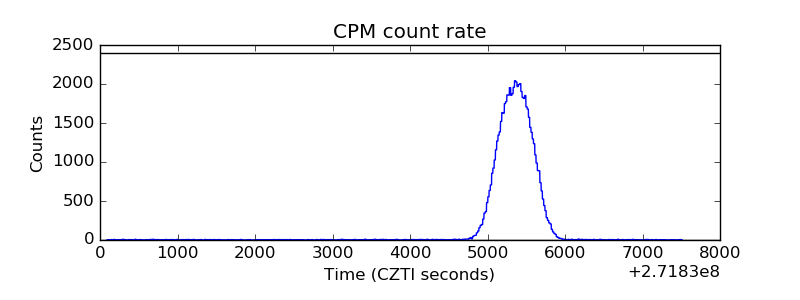 |
| CZT Counter | 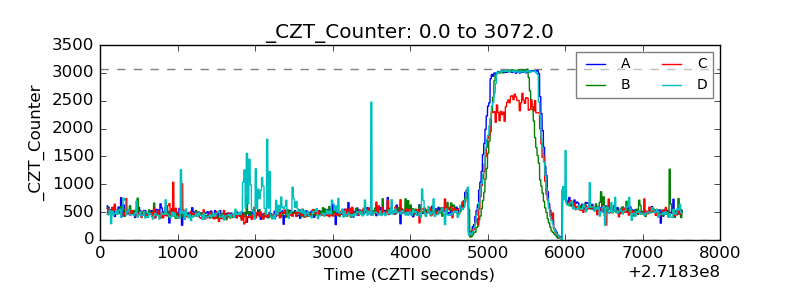 |
| +2.5 Volts monitor |  |
| +5 Volts monitor | 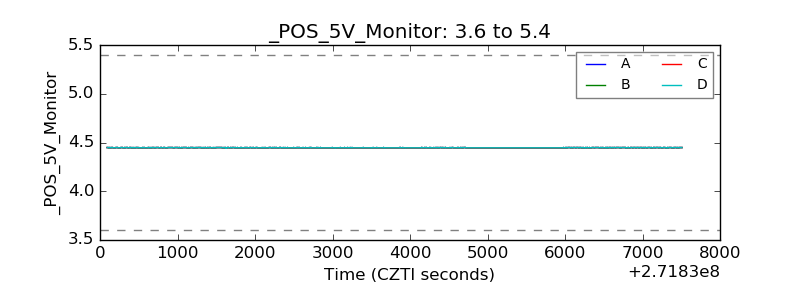 |
| _ROLL_ROT | 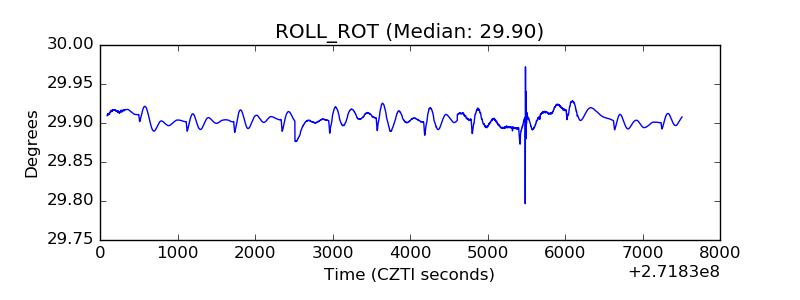 |
| _Roll_DEC |  |
| _Roll_RA | 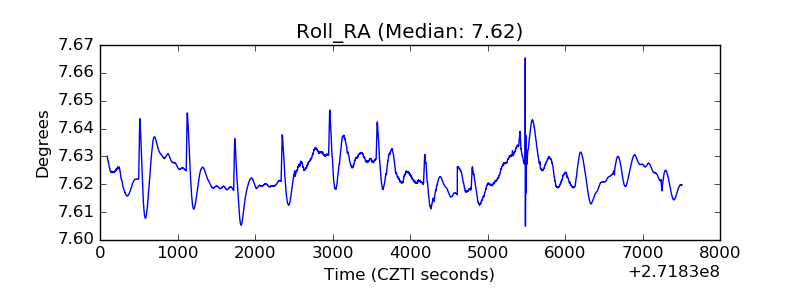 |
| Veto Counter | 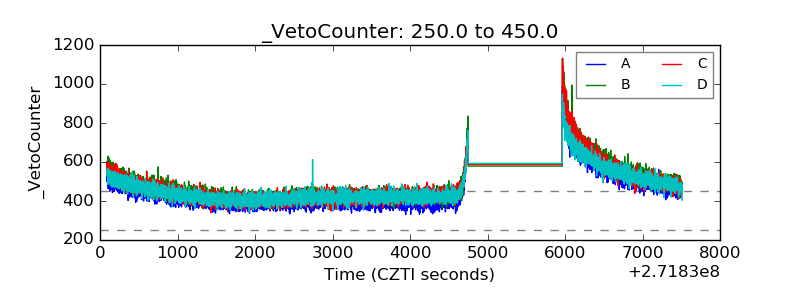 |