| Param | Original file | Final file |
|---|---|---|
| Filename | modeM0/AS1G08_058T09_9000002300_15544cztM0_level2.evt | modeM0/AS1G08_058T09_9000002300_15544cztM0_level2_quad_clean.evt |
| Size (bytes) | 232,079,040 | 29,747,520 |
| Size | 221.3 MB | 28.4 MB |
| Events in quadrant A | 1,715,066 | 169,825 |
| Events in quadrant B | 1,743,581 | 170,636 |
| Events in quadrant C | 1,646,429 | 159,812 |
| Events in quadrant D | 1,692,670 | 160,789 |
| Mode M0 | |||
|---|---|---|---|
| Quadrant | BADHDUFLAG | Total packets | Discarded packets |
| A | 0 | 6907 | 0 |
| B | 0 | 7060 | 0 |
| C | 0 | 6802 | 0 |
| D | 0 | 7006 | 0 |
| Mode SS | |||
|---|---|---|---|
| Quadrant | BADHDUFLAG | Total packets | Discarded packets |
| A | 0 | 68 | 0 |
| B | 0 | 68 | 0 |
| C | 0 | 68 | 0 |
| D | 0 | 68 | 0 |
| Quadrant | Total seconds | Saturated seconds | Saturation percentage |
|---|---|---|---|
| A | 3366 | 3 | 0.089127% |
| B | 3366 | 17 | 0.505051% |
| C | 3366 | 16 | 0.475342% |
| D | 3366 | 3 | 0.089127% |
Noise dominated data is calculated using 1-second bins in cleaned event files. If a bin has >2000 counts, and if more than 50% of those come from <1% of pixels, then it is considered to be noise-dominated and hence unusable.
| Quadrant | # 1 sec bins | Bins with >0 counts | Bins with >2000 counts | High rate bins dominated by noise | Noise dominated (total time) | Noise dominated (detector-on time) | Marked lightcurve |
|---|---|---|---|---|---|---|---|
| A | 3367 | 3367 | 1 | 1 | 0.03% | 0.03% | 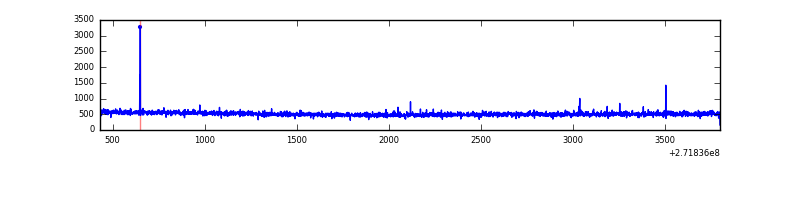 |
| B | 3367 | 3367 | 9 | 9 | 0.27% | 0.27% | 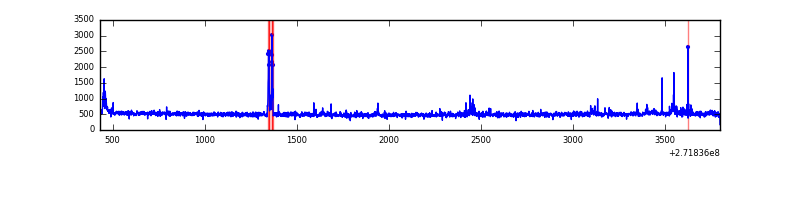 |
| C | 3367 | 3367 | 1 | 1 | 0.03% | 0.03% | 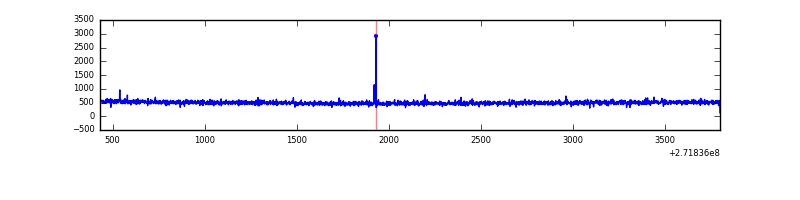 |
| D | 3367 | 3367 | 0 | 0 | 0.00% | 0.00% | 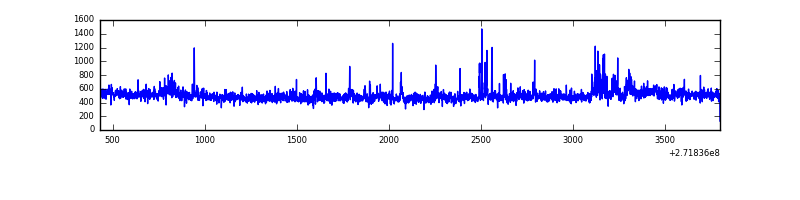 |
Top three noisy pixels from each quadrant. If the there are fewer than three noisy pixels in the level2.evt file, extra rows are filled as -1
| Pixel properties | Quadrant properties | ||||||
|---|---|---|---|---|---|---|---|
| Quadrant | DetID | PixID | Counts | Sigma | Mean | Median | Sigma |
| A | 0 | 253 | 47425 | 534.68 | 433 | 425 | 87.9 |
| A | 0 | 226 | 3959 | 40.2 | 433 | 425 | 87.9 |
| A | 9 | 143 | 3627 | 36.43 | 433 | 425 | 87.9 |
| B | 15 | 201 | 29065 | 355.17 | 423 | 416 | 80.7 |
| B | 0 | 213 | 23188 | 282.31 | 423 | 416 | 80.7 |
| B | 15 | 222 | 13306 | 159.8 | 423 | 416 | 80.7 |
| C | 14 | 238 | 64213 | 685.91 | 400 | 403 | 93.0 |
| C | 3 | 233 | 11943 | 124.05 | 400 | 403 | 93.0 |
| C | 10 | 22 | 7221 | 73.29 | 400 | 403 | 93.0 |
| D | 5 | 222 | 68373 | 661.59 | 415 | 402 | 102.7 |
| D | 1 | 52 | 29392 | 282.17 | 415 | 402 | 102.7 |
| D | 2 | 234 | 14033 | 132.68 | 415 | 402 | 102.7 |
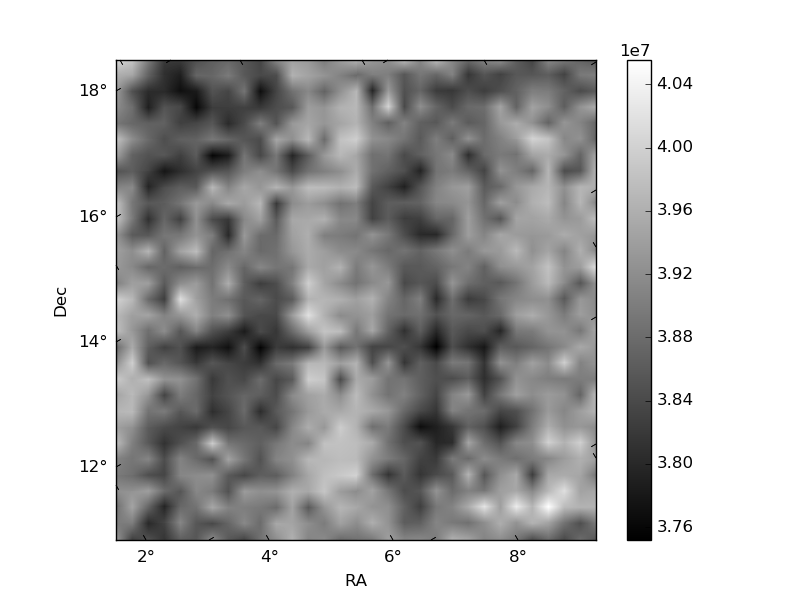
Histogram calculated using DETX and DETY for each event in the final _common_clean file
| Quadrant A | 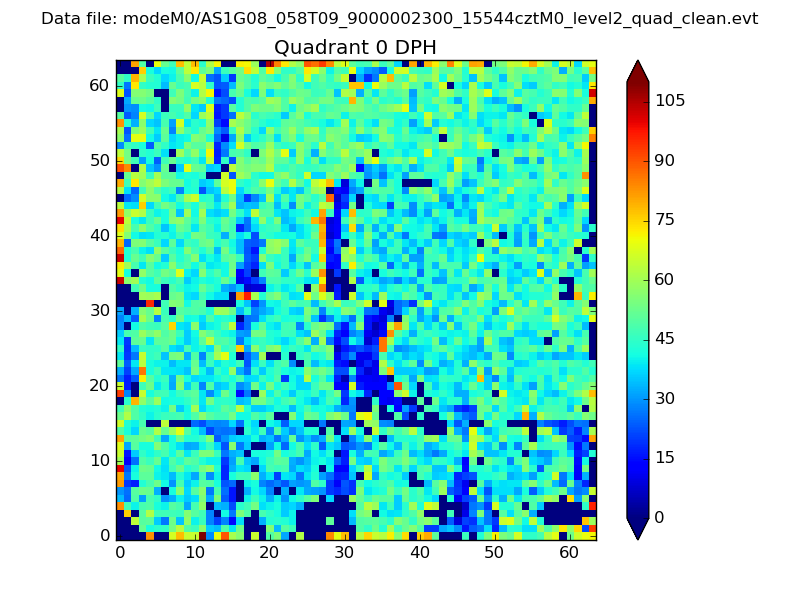 |
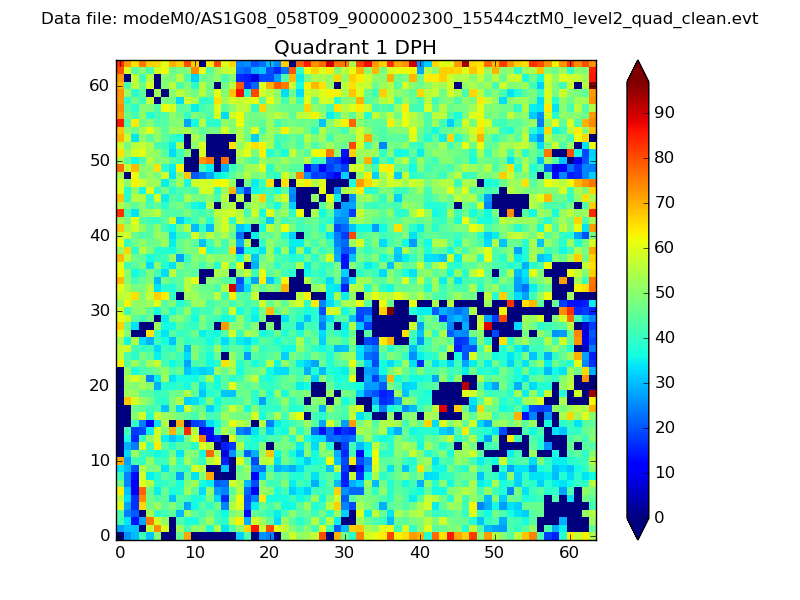 |
Quadrant B |
|---|---|---|---|
| Quadrant D | 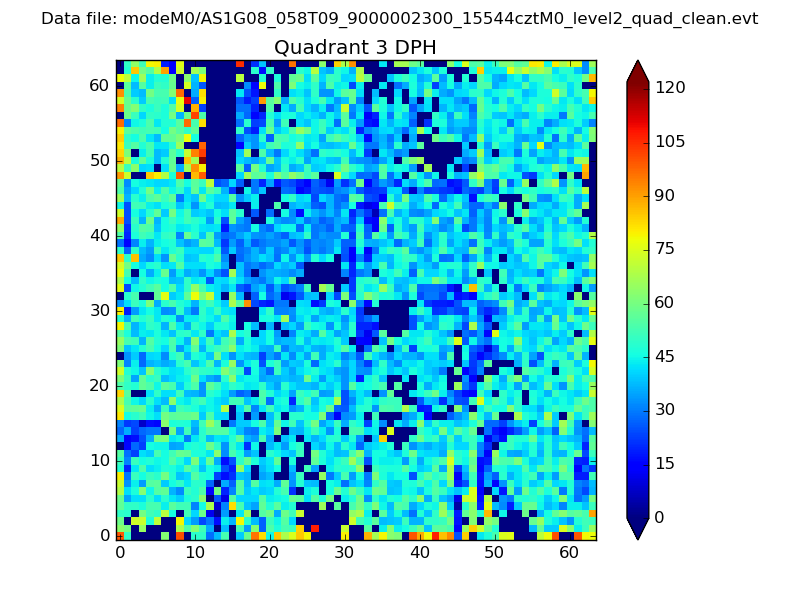 |
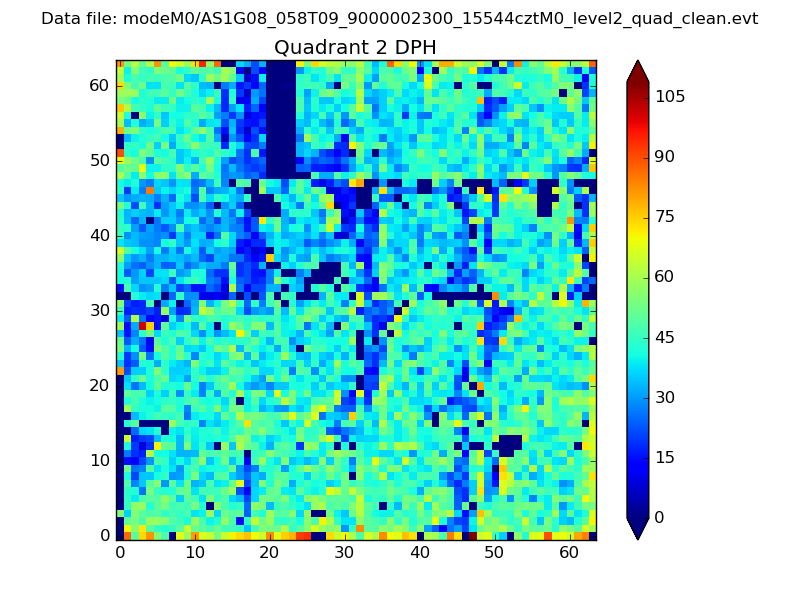 |
Quadrant C |
| Plot type | Count rate plots | Images |
|---|---|---|
| Comparison with Poisson distribution Blue bars denote a histogram of data divided into 1 sec bins. Red curve is a Poisson curve with rate = median count rate of data. |
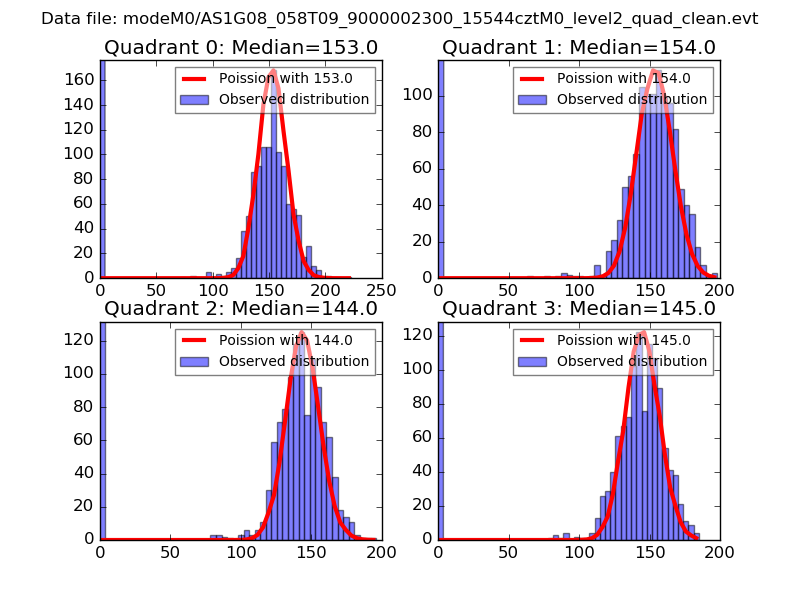 |
 |
| Quadrant-wise count rates Data is divided into 100 sec bins |
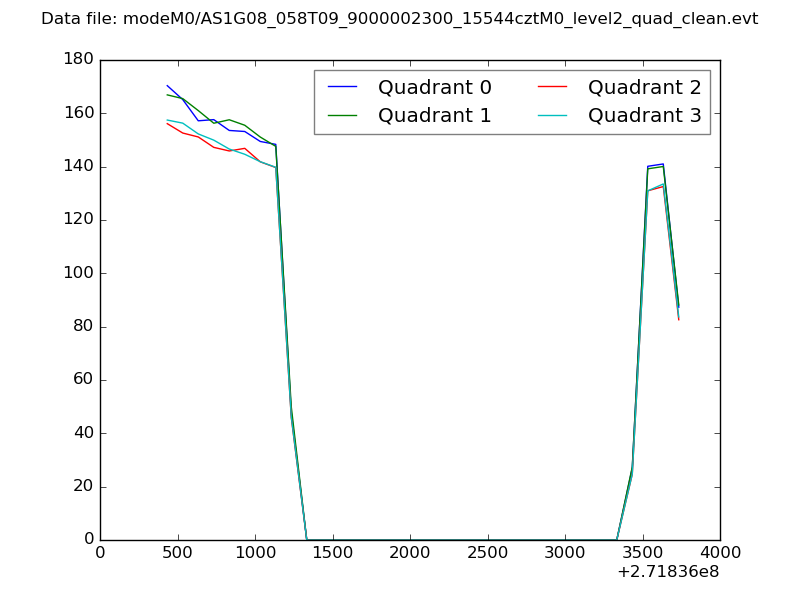 |
|
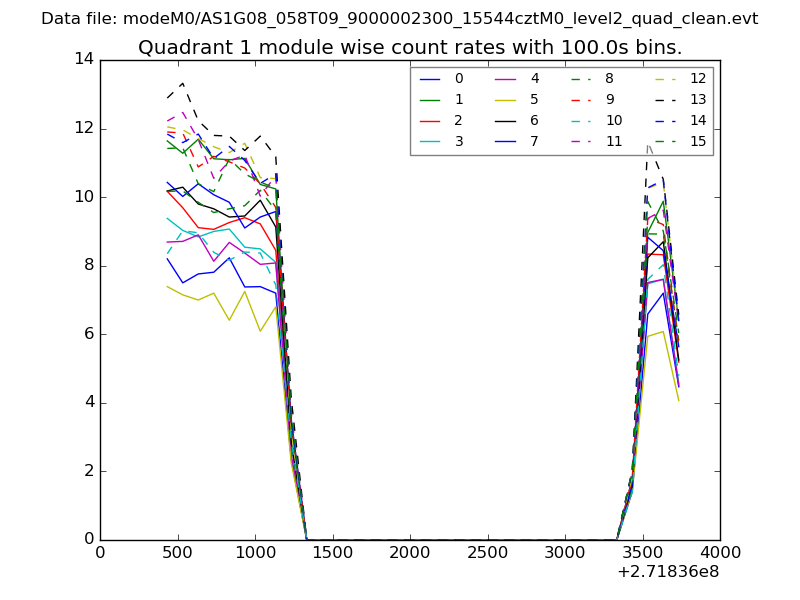
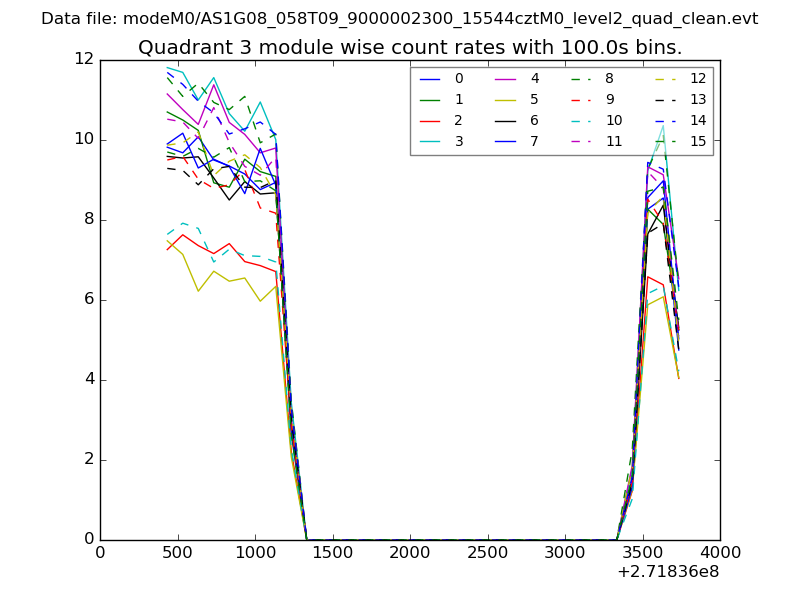
| Module-wise count rates for Quadrant A Data is divided into 100 sec bins |
 |
 |
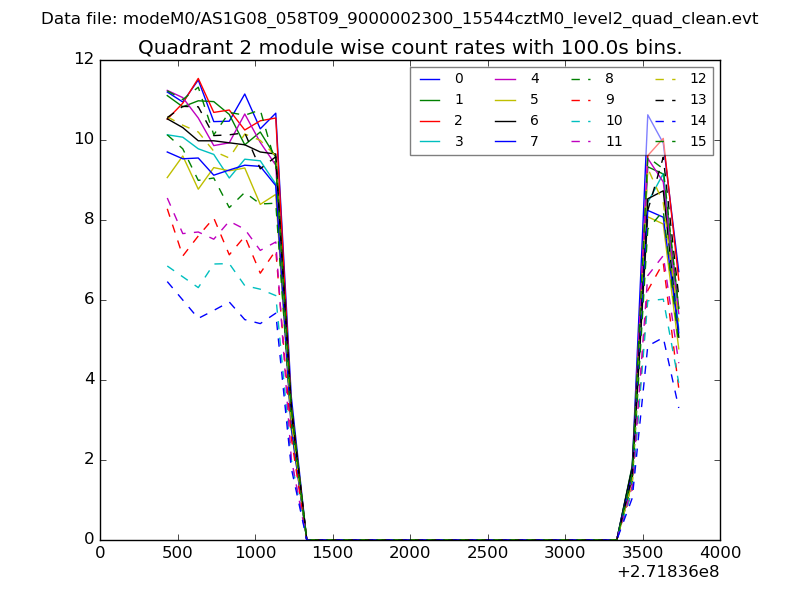
| Module-wise count rates for Quadrant B Data is divided into 100 sec bins |
 |
 |
| Module-wise count rates for Quadrant C Data is divided into 100 sec bins |
 |
 |
| Module-wise count rates for Quadrant D Data is divided into 100 sec bins |
 |
 |
| Parameter | Plot |
|---|---|
| CZT HV Monitor | 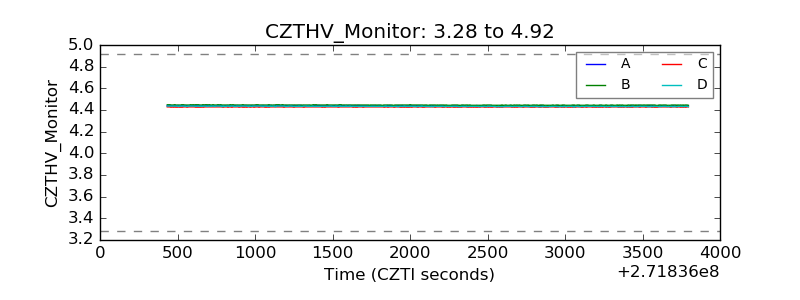 |
| D_VDD |  |
| Temperature 1 |  |
| Veto HV Monitor | 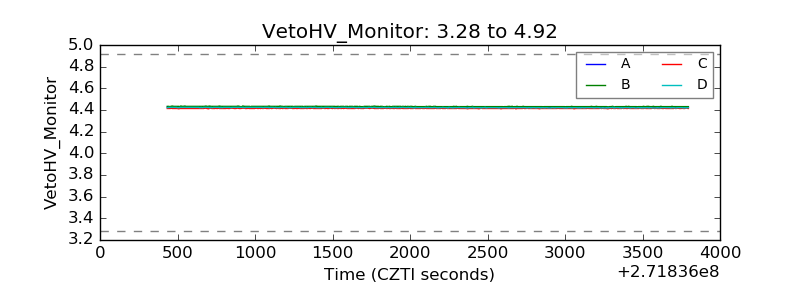 |
| Veto LLD | 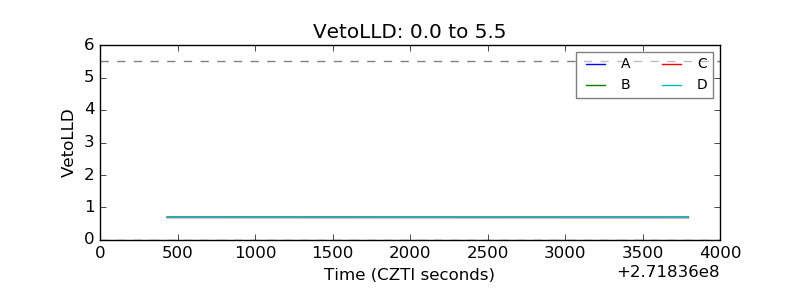 |
| Alpha Counter | 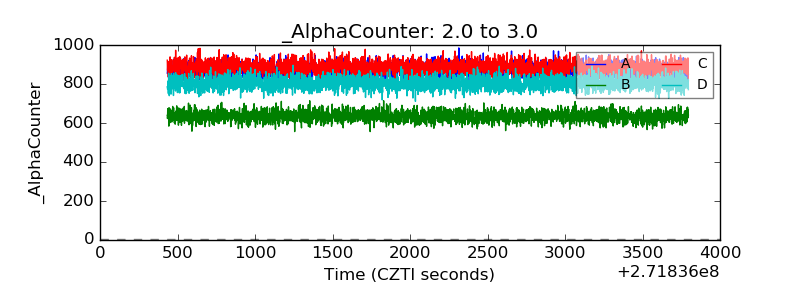 |
| _CPM_Rate | 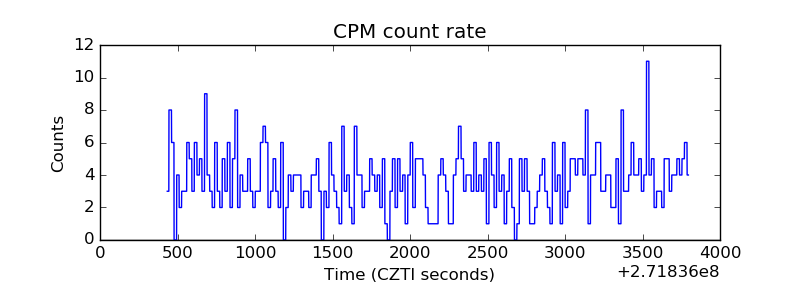 |
| CZT Counter | 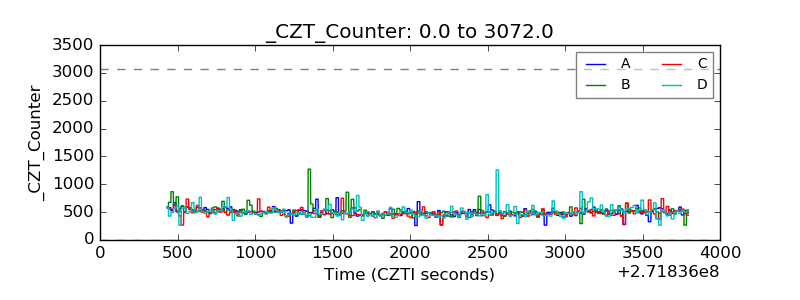 |
| +2.5 Volts monitor |  |
| +5 Volts monitor |  |
| _ROLL_ROT | 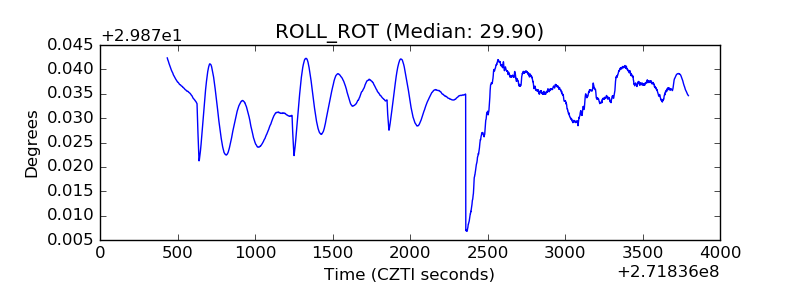 |
| _Roll_DEC | 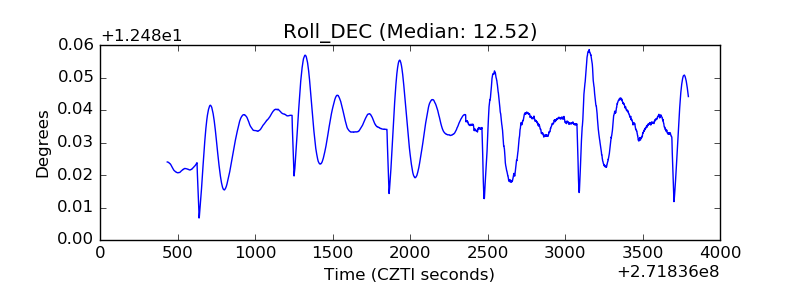 |
| _Roll_RA | 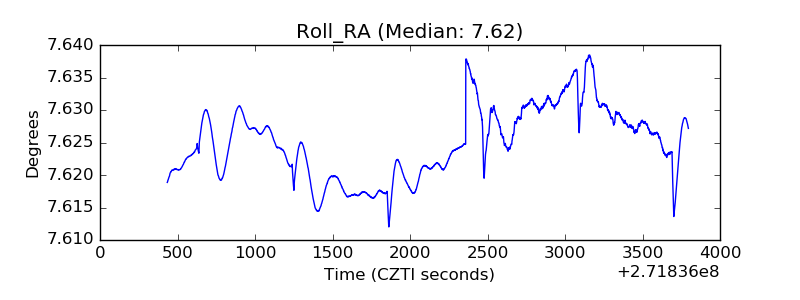 |
| Veto Counter | 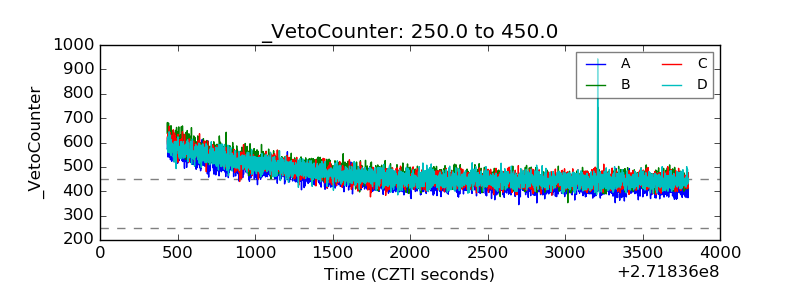 |