| Param | Original file | Final file |
|---|---|---|
| Filename | modeM0/AS1G08_030T01_9000002302cztM0_level2.fits | modeM0/AS1G08_030T01_9000002302cztM0_level2_quad_clean.evt |
| Size (bytes) | 630,878,400 | 584,893,440 |
| Size | 601.7 MB | 557.8 MB |
| Events in quadrant A | 3,917,268 | 3,518,787 |
| Events in quadrant B | 3,723,024 | 3,474,957 |
| Events in quadrant C | 3,760,532 | 3,278,937 |
| Events in quadrant D | 3,292,316 | 3,027,633 |
| Mode SS | |||
|---|---|---|---|
| Quadrant | BADHDUFLAG | Total packets | Discarded packets |
| A | 0 | 1312 | 0 |
| B | 0 | 1312 | 0 |
| C | 0 | 1312 | 0 |
| D | 0 | 1312 | 0 |
| Mode M0 | |||
|---|---|---|---|
| Quadrant | BADHDUFLAG | Total packets | Discarded packets |
| A | 0 | 134543 | 0 |
| B | 0 | 142779 | 0 |
| C | 0 | 134694 | 0 |
| D | 0 | 152371 | 0 |
| Mode M9 | |||
|---|---|---|---|
| Quadrant | BADHDUFLAG | Total packets | Discarded packets |
| A | 0 | 98 | 0 |
| B | 0 | 98 | 0 |
| C | 0 | 98 | 0 |
| D | 0 | 98 | 0 |
| Quadrant | Total seconds | Saturated seconds | Saturation percentage |
|---|---|---|---|
| A | 64335 | 910 | 1.414471% |
| B | 64335 | 1593 | 2.476102% |
| C | 64335 | 1215 | 1.888552% |
| D | 64335 | 1980 | 3.077640% |
Noise dominated data is calculated using 1-second bins in cleaned event files. If a bin has >2000 counts, and if more than 50% of those come from <1% of pixels, then it is considered to be noise-dominated and hence unusable.
| Quadrant | # 1 sec bins | Bins with >0 counts | Bins with >2000 counts | High rate bins dominated by noise | Noise dominated (total time) | Noise dominated (detector-on time) | Marked lightcurve |
|---|---|---|---|---|---|---|---|
| A | 74125 | 64329 | 0 | 0 | 0.00% | 0.00% |  |
| B | 74125 | 64318 | 0 | 0 | 0.00% | 0.00% |  |
| C | 74125 | 64326 | 0 | 0 | 0.00% | 0.00% |  |
| D | 74125 | 64313 | 0 | 0 | 0.00% | 0.00% |  |
Top three noisy pixels from each quadrant. If the there are fewer than three noisy pixels in the level2.evt file, extra rows are filled as -1
| Pixel properties | Quadrant properties | ||||||
|---|---|---|---|---|---|---|---|
| Quadrant | DetID | PixID | Counts | Sigma | Mean | Median | Sigma |
| A | 0 | 29 | 3648 | 10.71 | 1019 | 957 | 251.4 |
| A | 7 | 110 | 3102 | 8.53 | 1019 | 957 | 251.4 |
| A | 15 | 236 | 2920 | 7.81 | 1019 | 957 | 251.4 |
| B | 2 | 9 | 2974 | 10.5 | 982 | 937 | 194.1 |
| B | 2 | 8 | 2514 | 8.13 | 982 | 937 | 194.1 |
| B | 5 | 232 | 2474 | 7.92 | 982 | 937 | 194.1 |
| C | 1 | 81 | 2844 | 7.48 | 992 | 924 | 256.7 |
| C | 1 | 80 | 2757 | 7.14 | 992 | 924 | 256.7 |
| C | 12 | 241 | 2660 | 6.76 | 992 | 924 | 256.7 |
| D | 3 | 14 | 2413 | 6.24 | 940 | 854 | 250.0 |
| D | 6 | 231 | 2364 | 6.04 | 940 | 854 | 250.0 |
| D | 1 | 3 | 2304 | 5.8 | 940 | 854 | 250.0 |
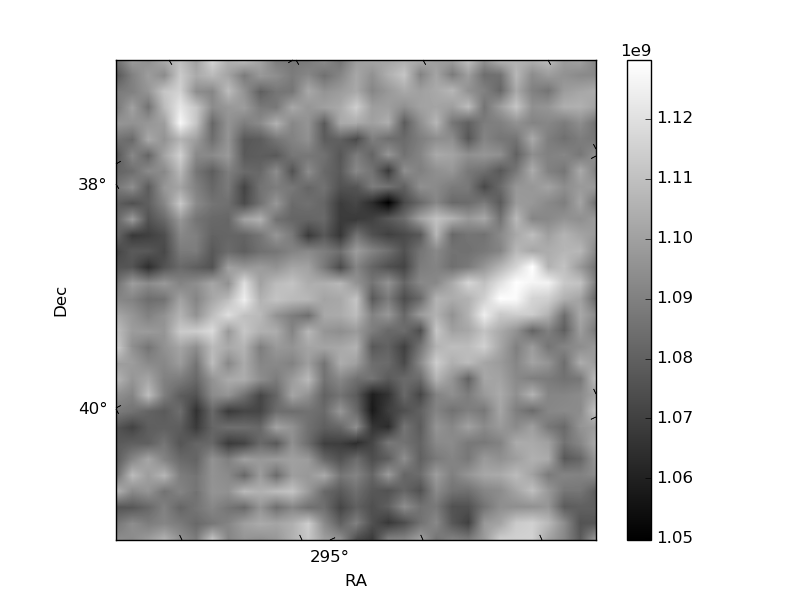
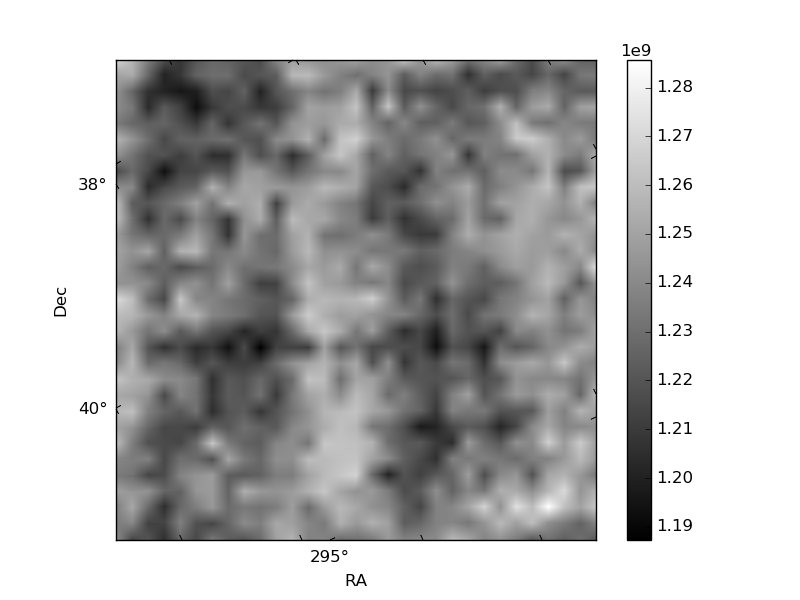
Histogram calculated using DETX and DETY for each event in the final _common_clean file
| Quadrant A | 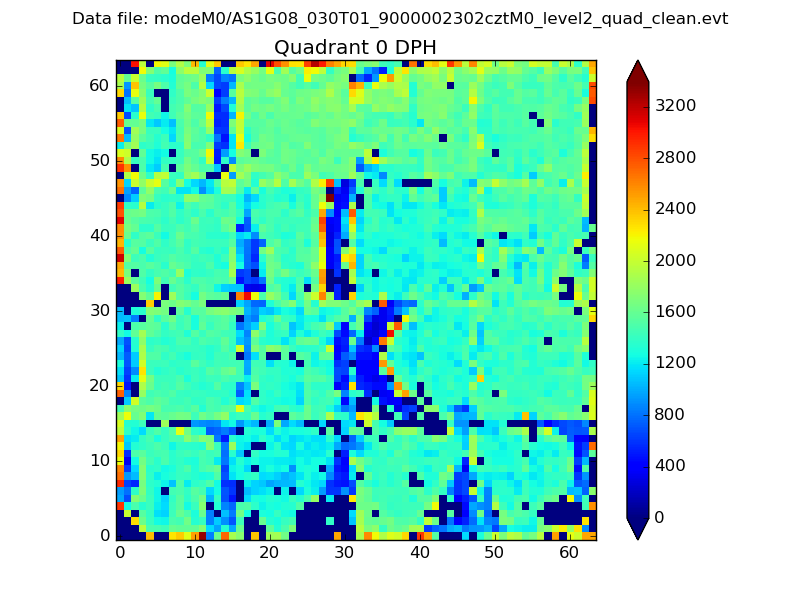 |
 |
Quadrant B |
|---|---|---|---|
| Quadrant D | 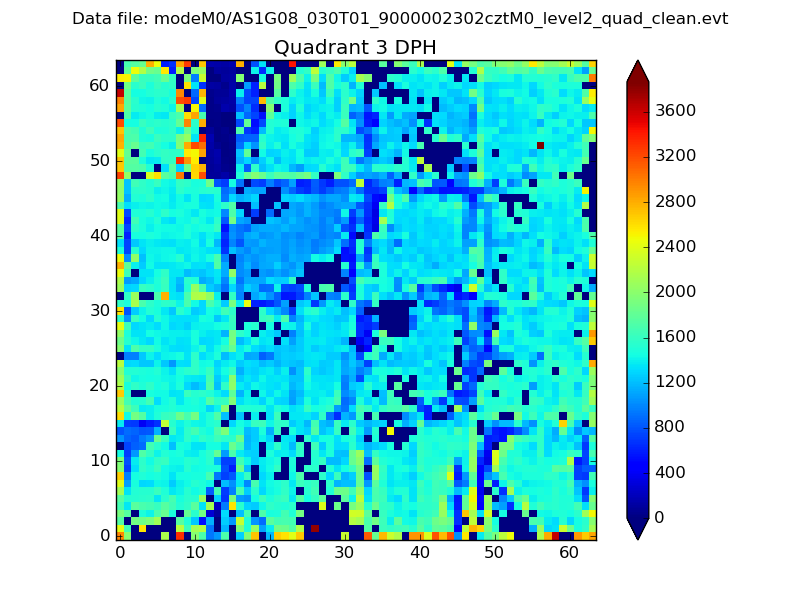 |
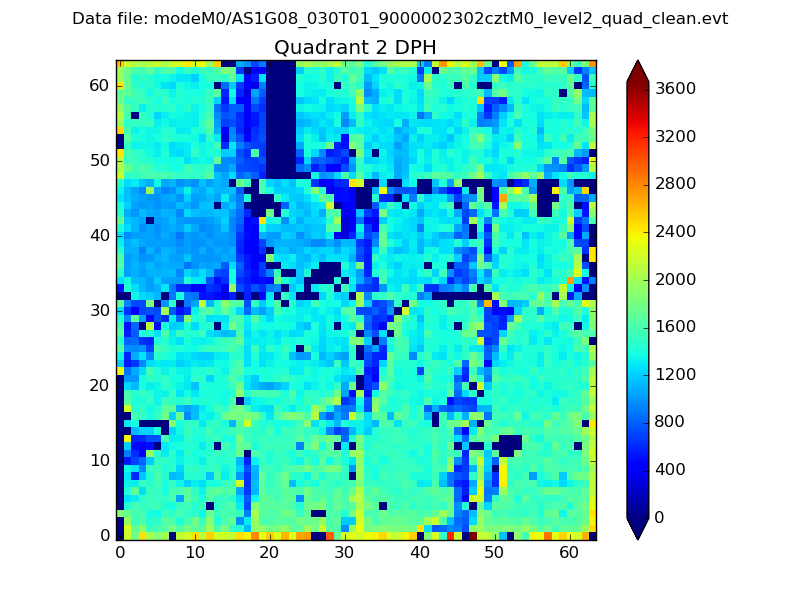 |
Quadrant C |
| Plot type | Count rate plots | Images |
|---|---|---|
| Comparison with Poisson distribution Blue bars denote a histogram of data divided into 1 sec bins. Red curve is a Poisson curve with rate = median count rate of data. |
 |
 |
| Quadrant-wise count rates Data is divided into 100 sec bins |
 |
|
| Module-wise count rates for Quadrant A Data is divided into 100 sec bins |
 |
 |
| Module-wise count rates for Quadrant B Data is divided into 100 sec bins |
 |
 |
| Module-wise count rates for Quadrant C Data is divided into 100 sec bins |
 |
 |
| Module-wise count rates for Quadrant D Data is divided into 100 sec bins |
 |
 |
| Parameter | Plot |
|---|---|
| CZT HV Monitor |  |
| D_VDD | 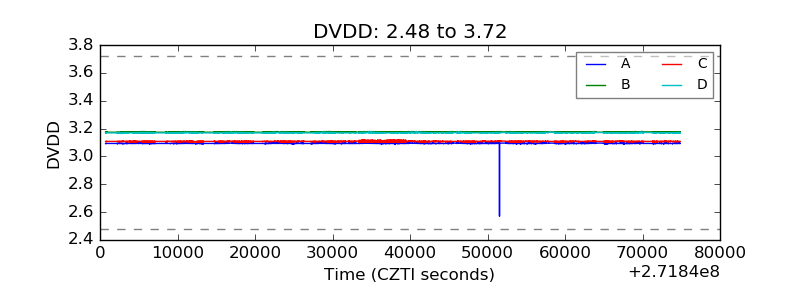 |
| Temperature 1 |  |
| Veto HV Monitor |  |
| Veto LLD | 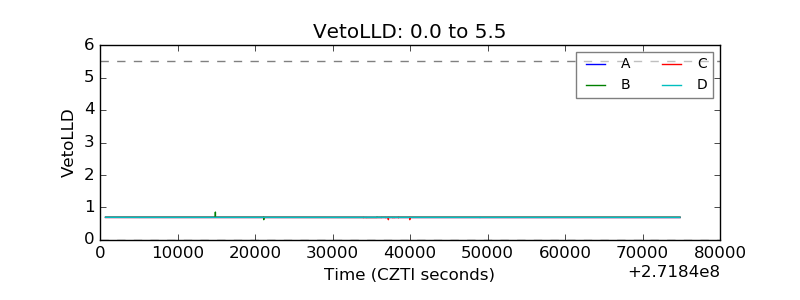 |
| Alpha Counter |  |
| _CPM_Rate |  |
| CZT Counter | 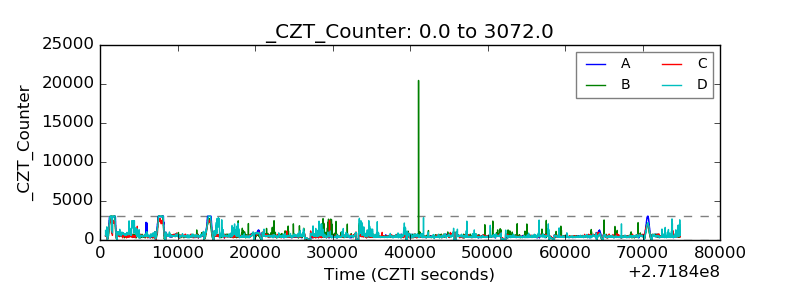 |
| +2.5 Volts monitor |  |
| +5 Volts monitor |  |
| _ROLL_ROT | 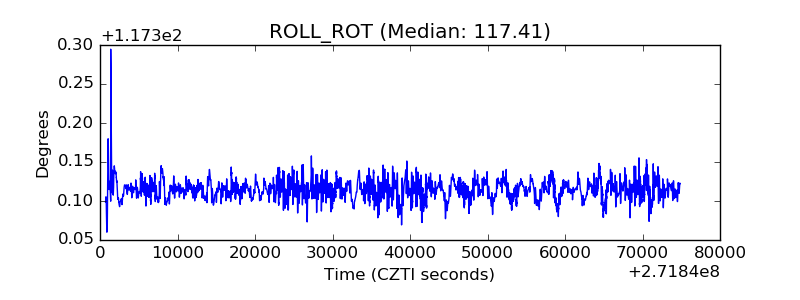 |
| _Roll_DEC |  |
| _Roll_RA |  |
| Veto Counter | 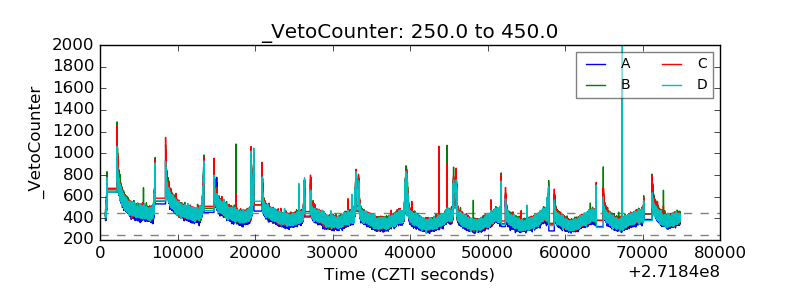 |