| Param | Original file | Final file |
|---|---|---|
| Filename | modeM0/AS1G08_030T01_9000002302_15544cztM0_level2.evt | modeM0/AS1G08_030T01_9000002302_15544cztM0_level2_quad_clean.evt |
| Size (bytes) | 131,728,320 | 7,349,760 |
| Size | 125.6 MB | 7.0 MB |
| Events in quadrant A | 921,885 | 29,082 |
| Events in quadrant B | 898,001 | 29,321 |
| Events in quadrant C | 876,548 | 27,911 |
| Events in quadrant D | 1,191,813 | 27,527 |
| Mode SS | |||
|---|---|---|---|
| Quadrant | BADHDUFLAG | Total packets | Discarded packets |
| A | 0 | 30 | 0 |
| B | 0 | 30 | 0 |
| C | 0 | 30 | 0 |
| D | 0 | 30 | 0 |
| Mode M0 | |||
|---|---|---|---|
| Quadrant | BADHDUFLAG | Total packets | Discarded packets |
| A | 0 | 3814 | 2 |
| B | 0 | 3628 | 1 |
| C | 0 | 3516 | 1 |
| D | 0 | 4594 | 1 |
| Mode M9 | |||
|---|---|---|---|
| Quadrant | BADHDUFLAG | Total packets | Discarded packets |
| A | 0 | 13 | 0 |
| B | 0 | 13 | 0 |
| C | 0 | 13 | 0 |
| D | 0 | 13 | 0 |
| Quadrant | Total seconds | Saturated seconds | Saturation percentage |
|---|---|---|---|
| A | 1455 | 58 | 3.986254% |
| B | 1455 | 70 | 4.810997% |
| C | 1455 | 68 | 4.673540% |
| D | 1455 | 57 | 3.917526% |
Noise dominated data is calculated using 1-second bins in cleaned event files. If a bin has >2000 counts, and if more than 50% of those come from <1% of pixels, then it is considered to be noise-dominated and hence unusable.
| Quadrant | # 1 sec bins | Bins with >0 counts | Bins with >2000 counts | High rate bins dominated by noise | Noise dominated (total time) | Noise dominated (detector-on time) | Marked lightcurve |
|---|---|---|---|---|---|---|---|
| A | 2751 | 1456 | 0 | 0 | 0.00% | 0.00% | 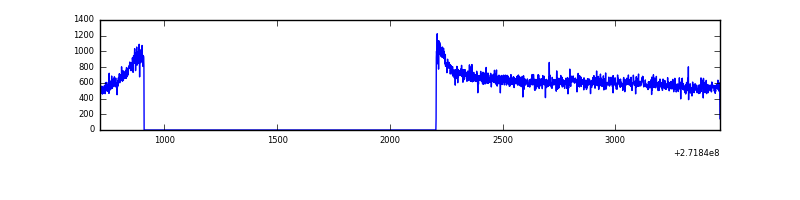 |
| B | 2751 | 1456 | 0 | 0 | 0.00% | 0.00% | 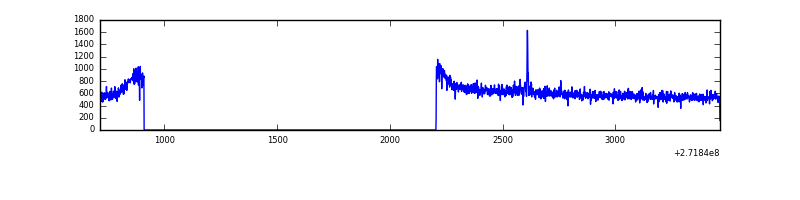 |
| C | 2751 | 1457 | 1 | 1 | 0.04% | 0.07% | 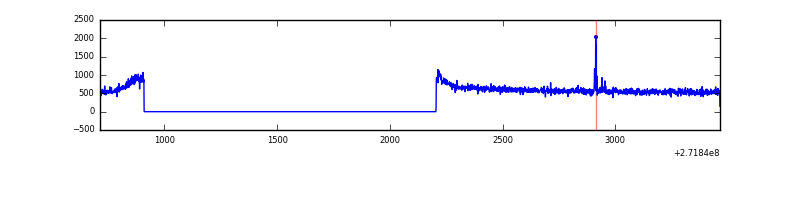 |
| D | 2751 | 1457 | 2 | 2 | 0.07% | 0.14% | 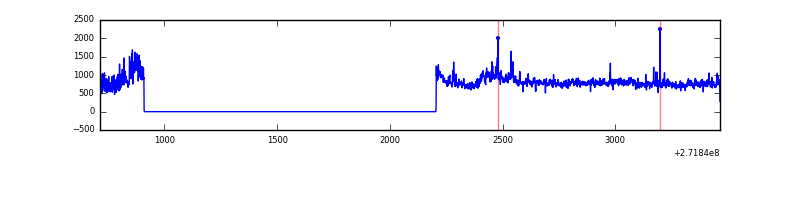 |
Top three noisy pixels from each quadrant. If the there are fewer than three noisy pixels in the level2.evt file, extra rows are filled as -1
| Pixel properties | Quadrant properties | ||||||
|---|---|---|---|---|---|---|---|
| Quadrant | DetID | PixID | Counts | Sigma | Mean | Median | Sigma |
| A | 0 | 253 | 37266 | 789.11 | 230 | 226 | 46.9 |
| A | 0 | 226 | 2053 | 38.92 | 230 | 226 | 46.9 |
| A | 12 | 194 | 1623 | 29.76 | 230 | 226 | 46.9 |
| B | 4 | 173 | 8082 | 175.83 | 227 | 222 | 44.7 |
| B | 12 | 111 | 4832 | 103.13 | 227 | 222 | 44.7 |
| B | 0 | 214 | 4391 | 93.26 | 227 | 222 | 44.7 |
| C | 14 | 238 | 34368 | 676.38 | 212 | 213 | 50.5 |
| C | 10 | 187 | 8196 | 158.09 | 212 | 213 | 50.5 |
| C | 3 | 233 | 5406 | 102.84 | 212 | 213 | 50.5 |
| D | 13 | 104 | 263653 | 4995.62 | 215 | 209 | 52.7 |
| D | 5 | 222 | 76069 | 1438.51 | 215 | 209 | 52.7 |
| D | 13 | 170 | 13474 | 251.54 | 215 | 209 | 52.7 |
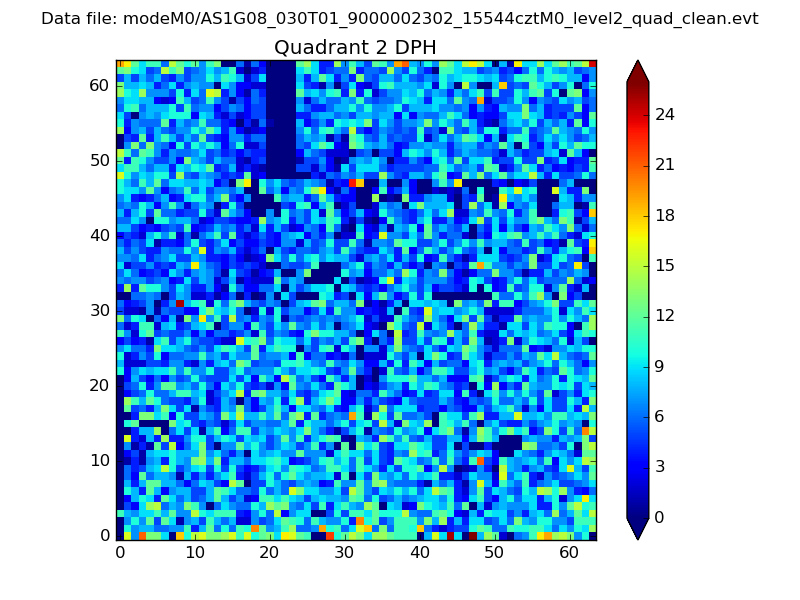
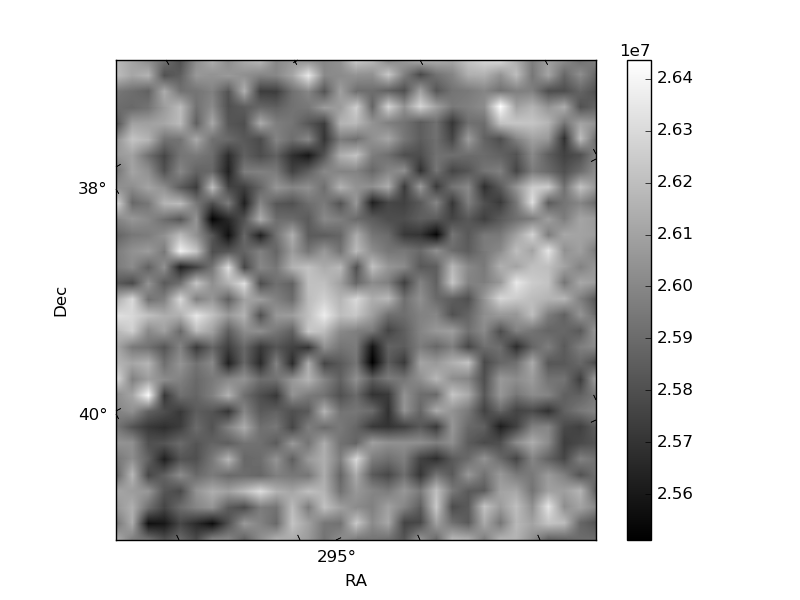
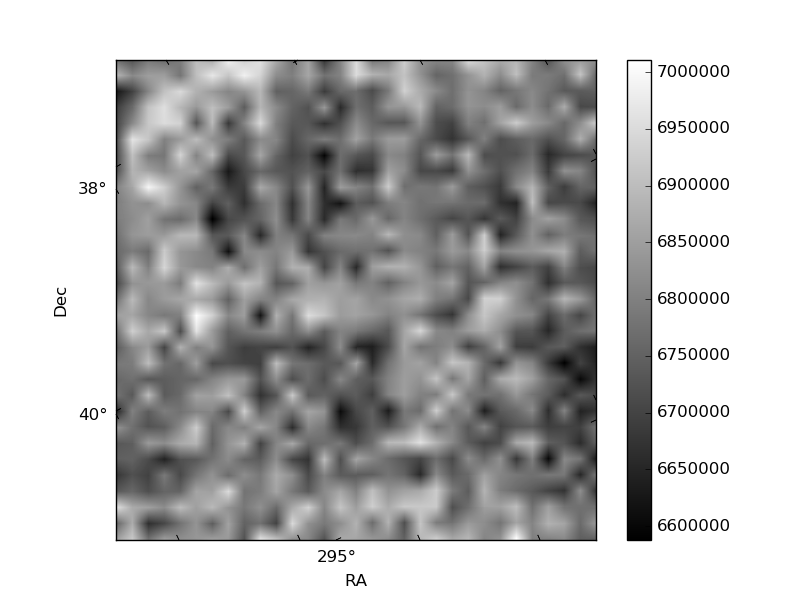
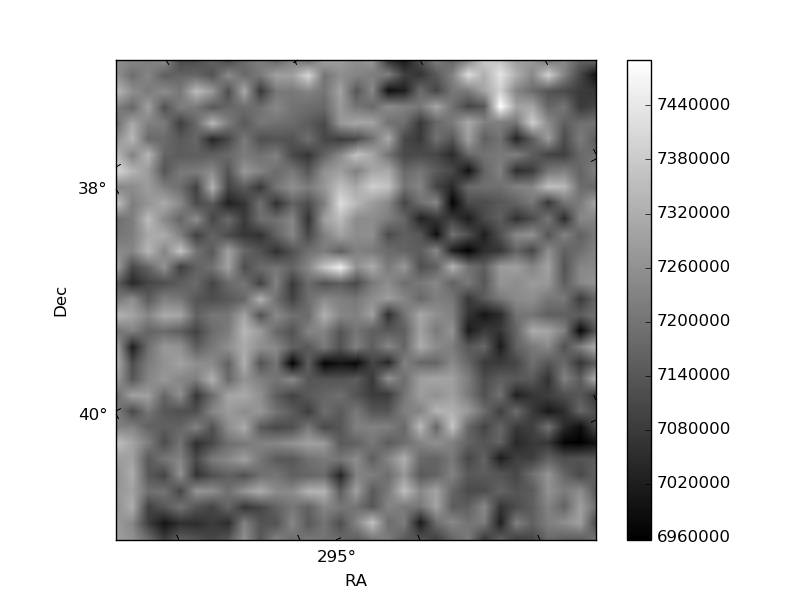
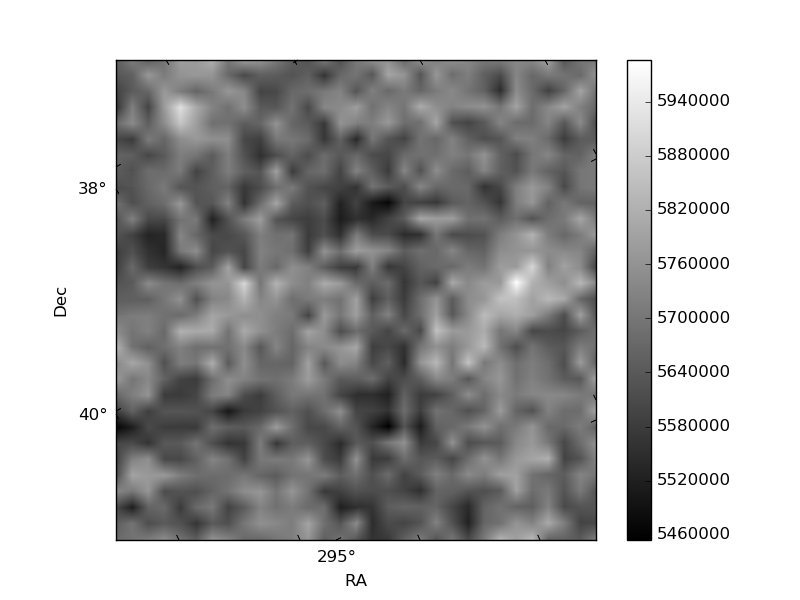
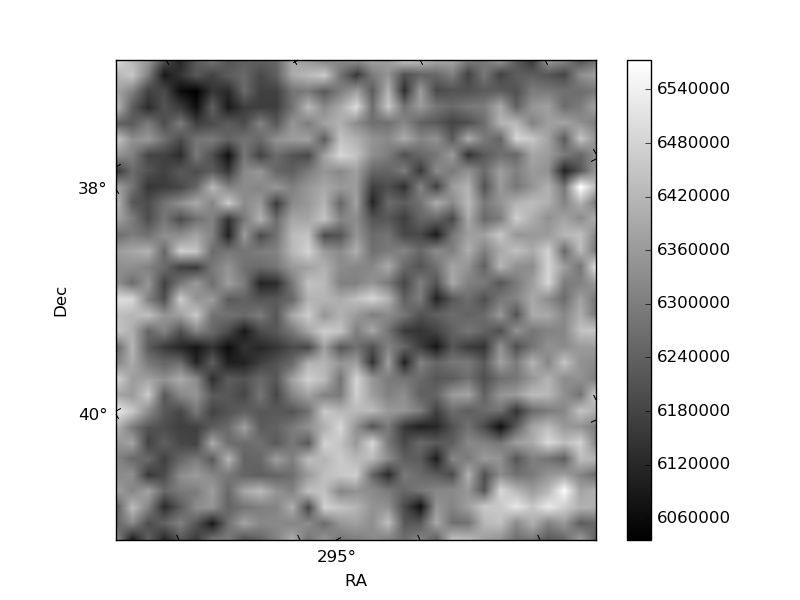
Histogram calculated using DETX and DETY for each event in the final _common_clean file
| Quadrant A | 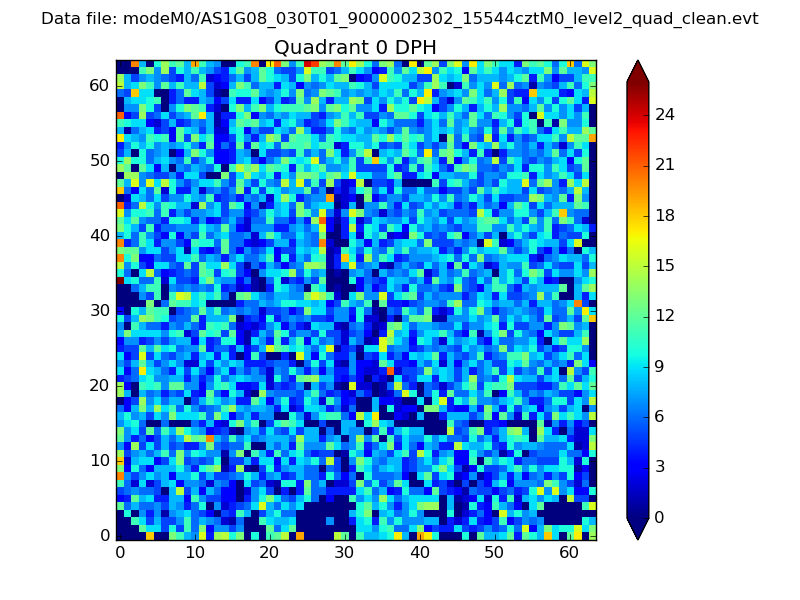 |
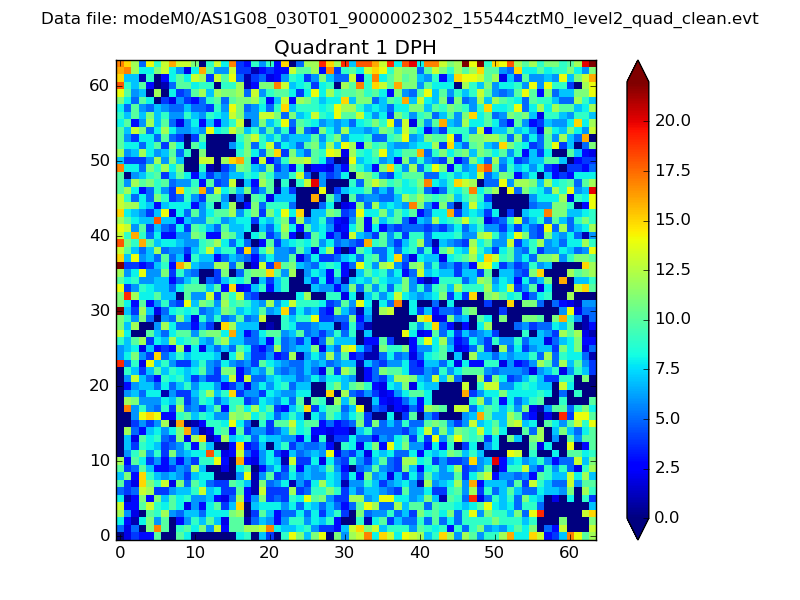 |
Quadrant B |
|---|---|---|---|
| Quadrant D | 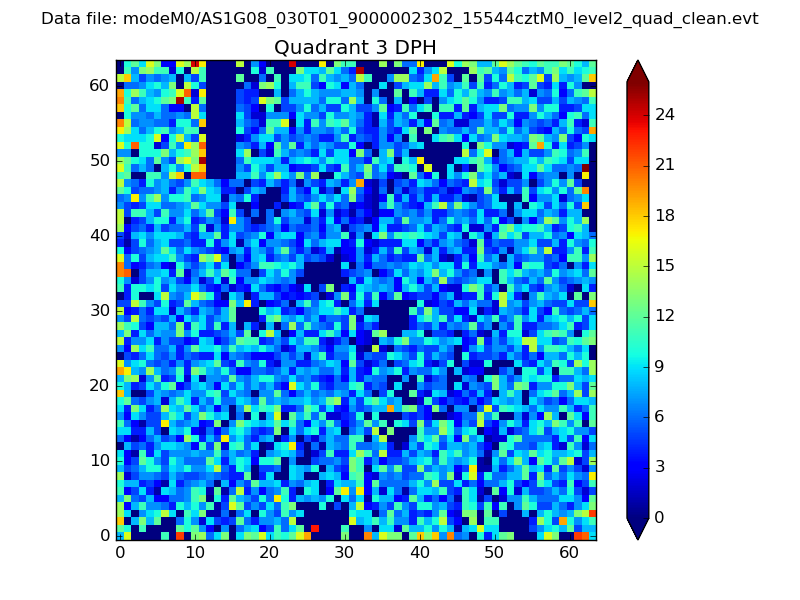 |
 |
Quadrant C |
| Plot type | Count rate plots | Images |
|---|---|---|
| Comparison with Poisson distribution Blue bars denote a histogram of data divided into 1 sec bins. Red curve is a Poisson curve with rate = median count rate of data. |
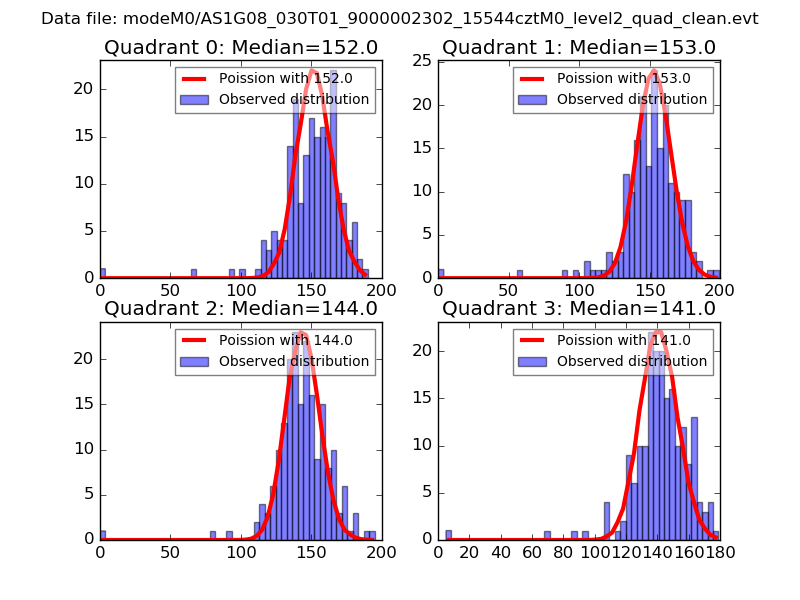 |
 |
| Quadrant-wise count rates Data is divided into 100 sec bins |
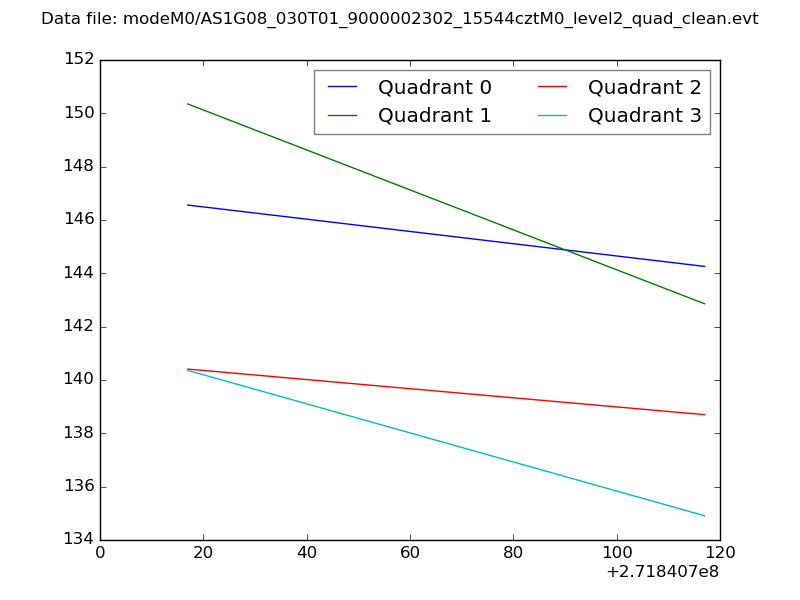 |
|
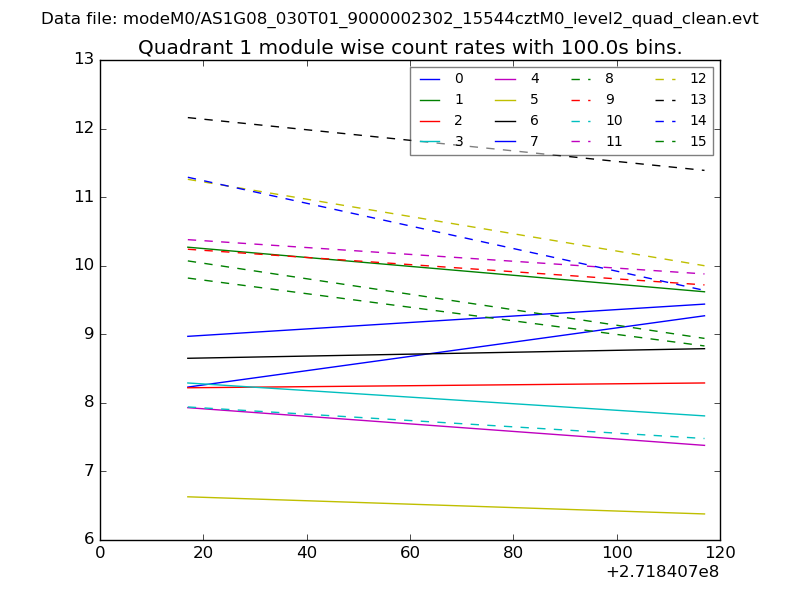
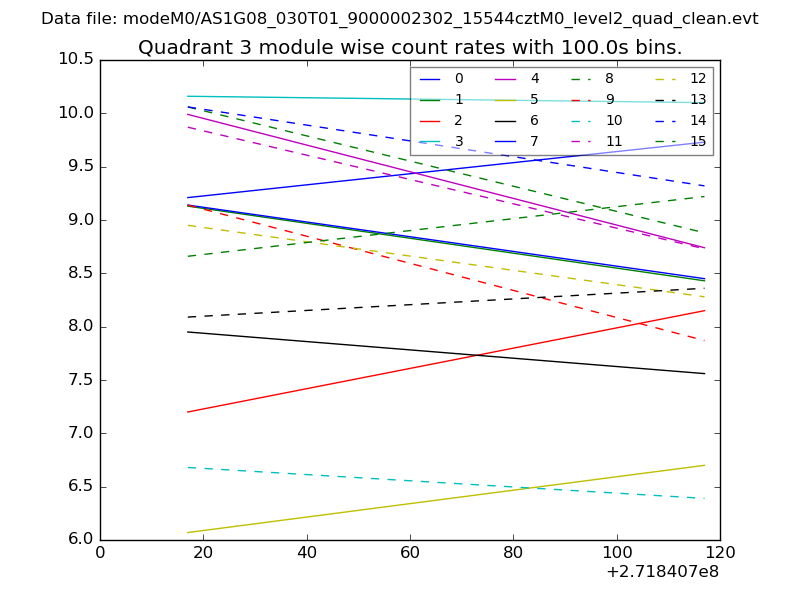
| Module-wise count rates for Quadrant A Data is divided into 100 sec bins |
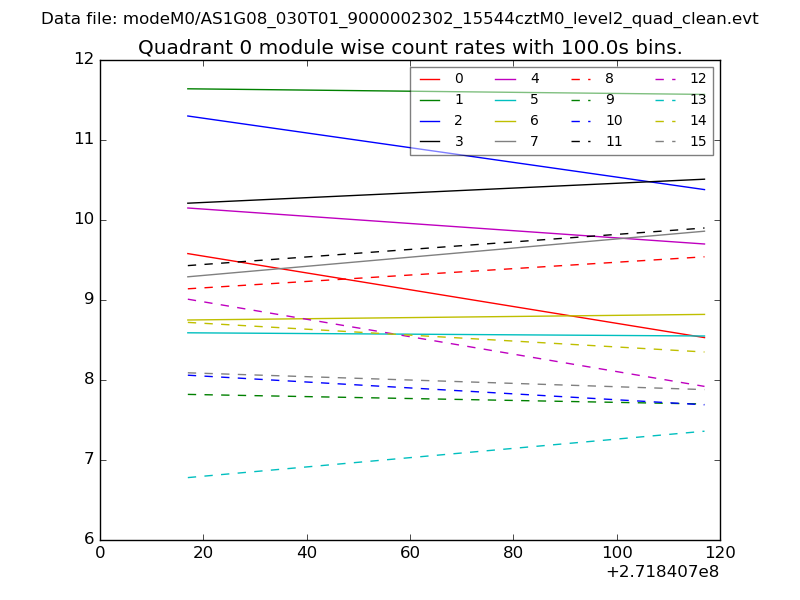 |
 |
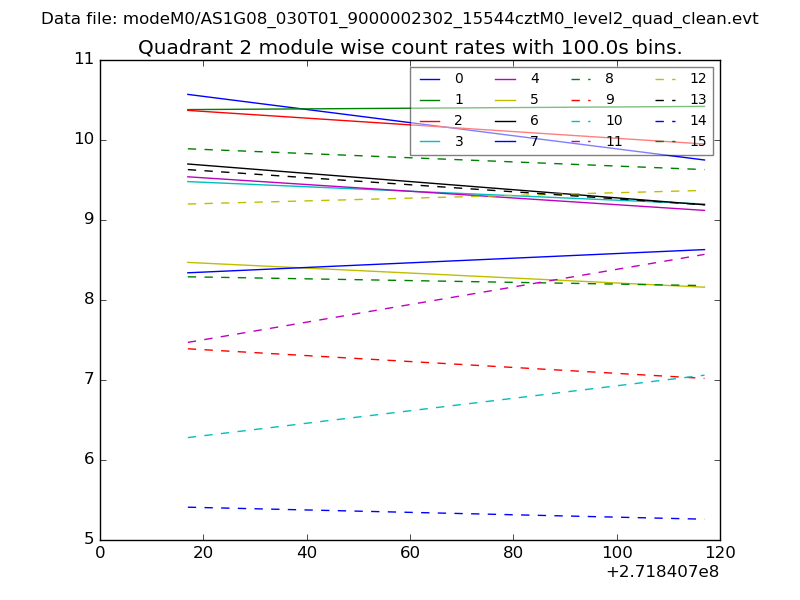
| Module-wise count rates for Quadrant B Data is divided into 100 sec bins |
 |
 |
| Module-wise count rates for Quadrant C Data is divided into 100 sec bins |
 |
 |
| Module-wise count rates for Quadrant D Data is divided into 100 sec bins |
 |
 |
| Parameter | Plot |
|---|---|
| CZT HV Monitor | 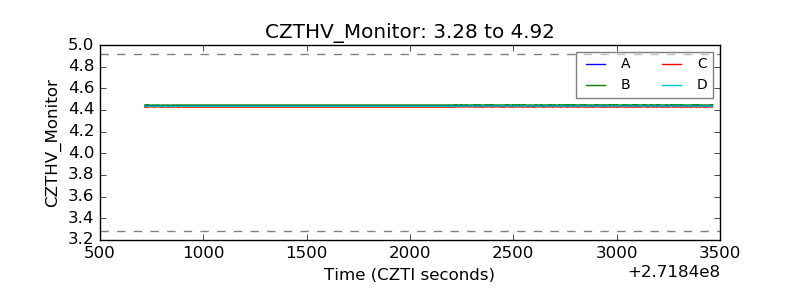 |
| D_VDD | 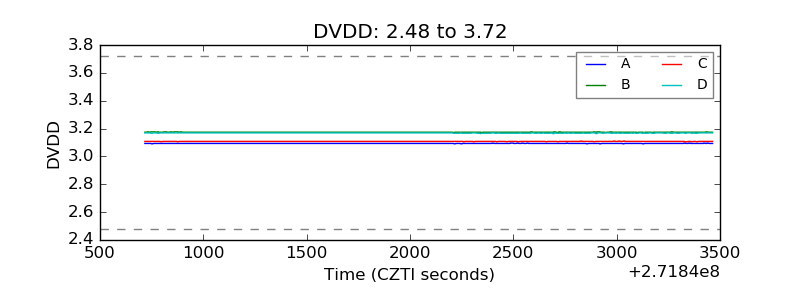 |
| Temperature 1 | 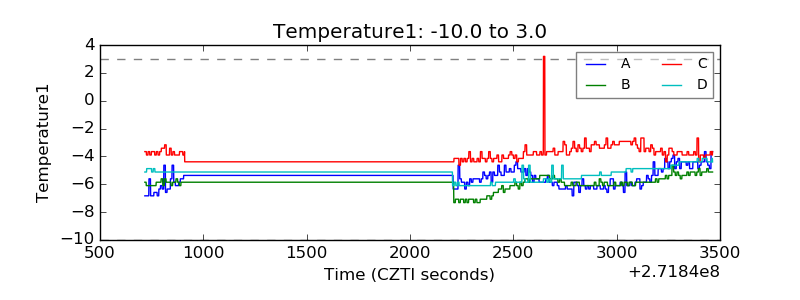 |
| Veto HV Monitor | 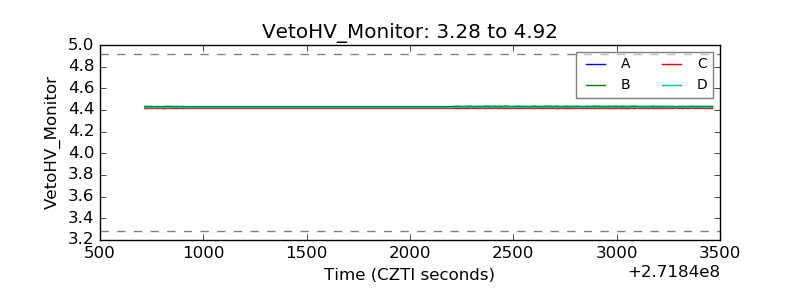 |
| Veto LLD | 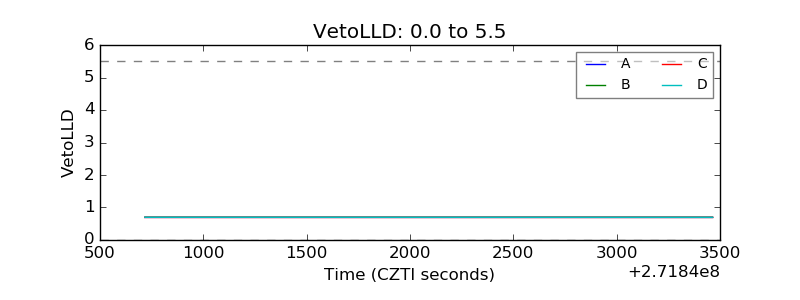 |
| Alpha Counter | 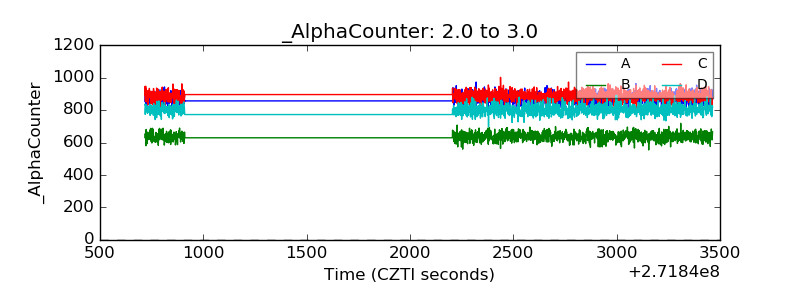 |
| _CPM_Rate | 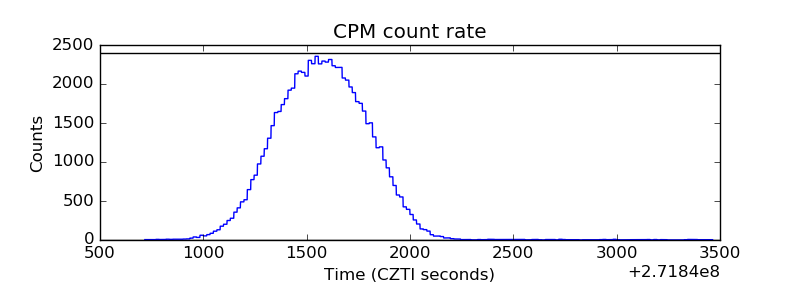 |
| CZT Counter | 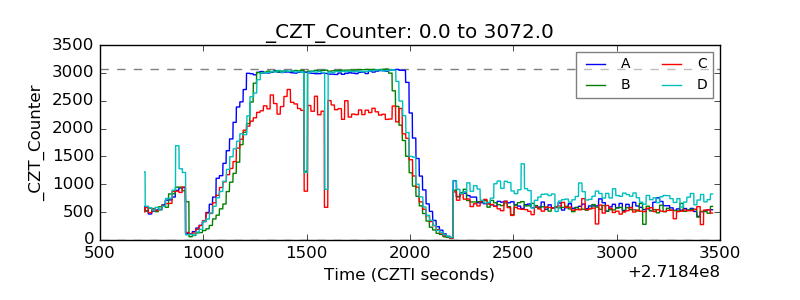 |
| +2.5 Volts monitor | 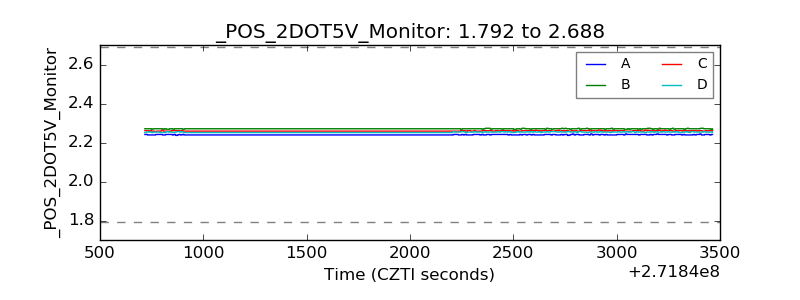 |
| +5 Volts monitor |  |
| _ROLL_ROT | 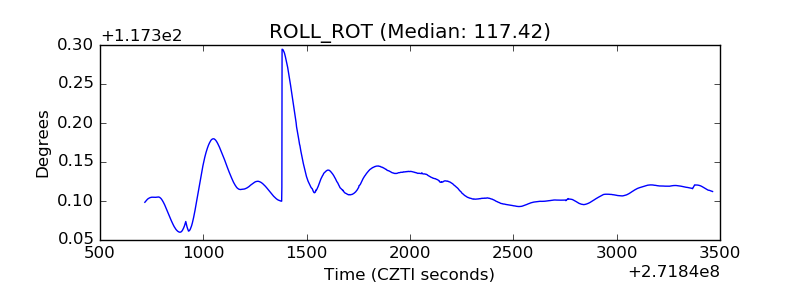 |
| _Roll_DEC | 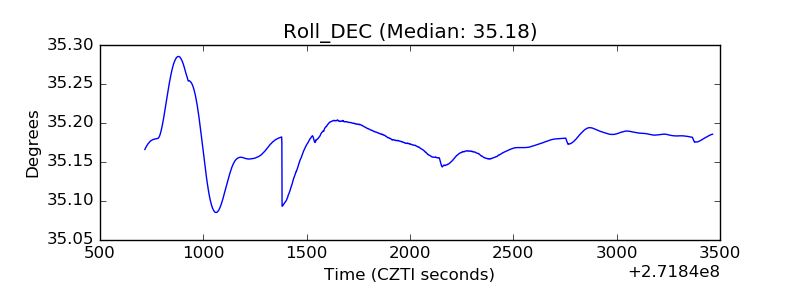 |
| _Roll_RA | 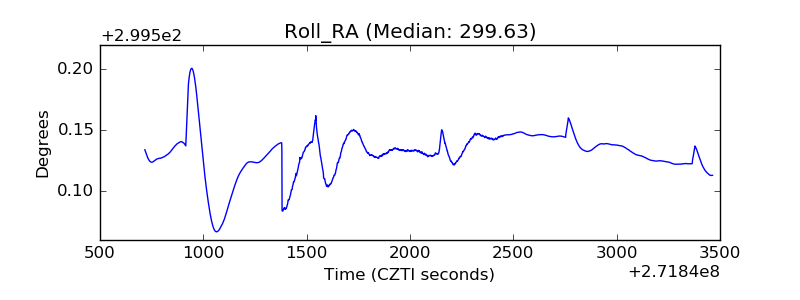 |
| Veto Counter | 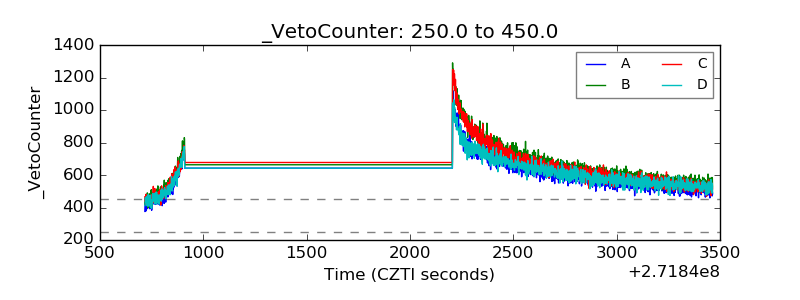 |