| Param | Original file | Final file |
|---|---|---|
| Filename | modeM0/AS1G08_030T01_9000002302_15545cztM0_level2.evt | modeM0/AS1G08_030T01_9000002302_15545cztM0_level2_quad_clean.evt |
| Size (bytes) | 534,850,560 | 73,563,840 |
| Size | 510.1 MB | 70.2 MB |
| Events in quadrant A | 3,715,815 | 459,325 |
| Events in quadrant B | 3,637,224 | 461,761 |
| Events in quadrant C | 3,565,073 | 431,148 |
| Events in quadrant D | 4,838,709 | 421,134 |
| Mode SS | |||
|---|---|---|---|
| Quadrant | BADHDUFLAG | Total packets | Discarded packets |
| A | 0 | 132 | 0 |
| B | 0 | 132 | 0 |
| C | 0 | 132 | 0 |
| D | 0 | 132 | 0 |
| Mode M0 | |||
|---|---|---|---|
| Quadrant | BADHDUFLAG | Total packets | Discarded packets |
| A | 0 | 14957 | 3 |
| B | 0 | 14627 | 2 |
| C | 0 | 14334 | 2 |
| D | 0 | 18522 | 2 |
| Mode M9 | |||
|---|---|---|---|
| Quadrant | BADHDUFLAG | Total packets | Discarded packets |
| A | 0 | 18 | 0 |
| B | 0 | 18 | 0 |
| C | 0 | 18 | 0 |
| D | 0 | 19 | 0 |
| Quadrant | Total seconds | Saturated seconds | Saturation percentage |
|---|---|---|---|
| A | 6508 | 129 | 1.982176% |
| B | 6508 | 133 | 2.043639% |
| C | 6508 | 135 | 2.074370% |
| D | 6508 | 255 | 3.918254% |
Noise dominated data is calculated using 1-second bins in cleaned event files. If a bin has >2000 counts, and if more than 50% of those come from <1% of pixels, then it is considered to be noise-dominated and hence unusable.
| Quadrant | # 1 sec bins | Bins with >0 counts | Bins with >2000 counts | High rate bins dominated by noise | Noise dominated (total time) | Noise dominated (detector-on time) | Marked lightcurve |
|---|---|---|---|---|---|---|---|
| A | 7844 | 6509 | 21 | 21 | 0.27% | 0.32% | 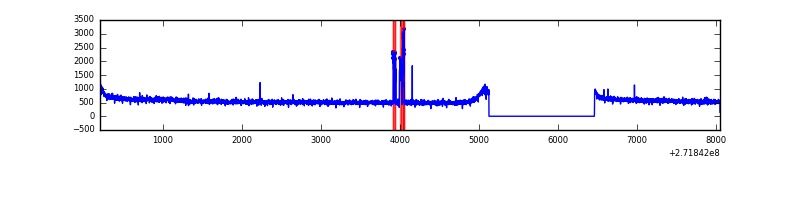 |
| B | 7844 | 6509 | 2 | 2 | 0.03% | 0.03% | 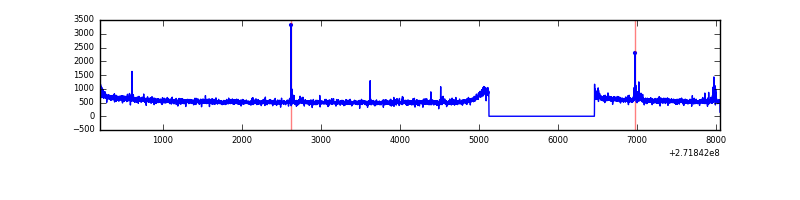 |
| C | 7844 | 6509 | 3 | 3 | 0.04% | 0.05% | 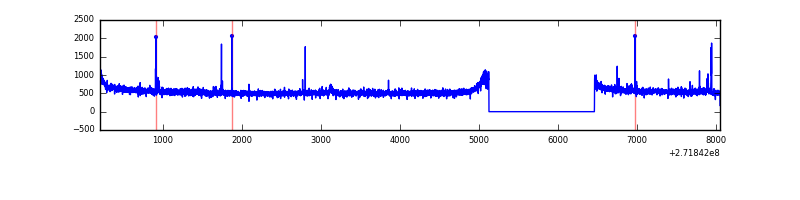 |
| D | 7844 | 6509 | 180 | 180 | 2.29% | 2.77% | 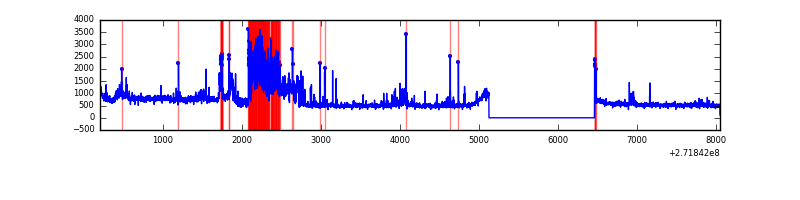 |
Top three noisy pixels from each quadrant. If the there are fewer than three noisy pixels in the level2.evt file, extra rows are filled as -1
| Pixel properties | Quadrant properties | ||||||
|---|---|---|---|---|---|---|---|
| Quadrant | DetID | PixID | Counts | Sigma | Mean | Median | Sigma |
| A | 0 | 253 | 157767 | 859.84 | 925 | 910 | 182.4 |
| A | 0 | 226 | 8322 | 40.63 | 925 | 910 | 182.4 |
| A | 12 | 194 | 6916 | 32.92 | 925 | 910 | 182.4 |
| B | 4 | 173 | 30887 | 175.3 | 911 | 892 | 171.1 |
| B | 4 | 48 | 23613 | 132.79 | 911 | 892 | 171.1 |
| B | 12 | 111 | 19270 | 107.41 | 911 | 892 | 171.1 |
| C | 14 | 238 | 137717 | 690.03 | 860 | 868 | 198.3 |
| C | 10 | 22 | 37307 | 183.73 | 860 | 868 | 198.3 |
| C | 3 | 233 | 21342 | 103.23 | 860 | 868 | 198.3 |
| D | 5 | 222 | 943493 | 4478.56 | 878 | 853 | 210.5 |
| D | 13 | 104 | 384960 | 1824.93 | 878 | 853 | 210.5 |
| D | 12 | 221 | 97230 | 457.9 | 878 | 853 | 210.5 |
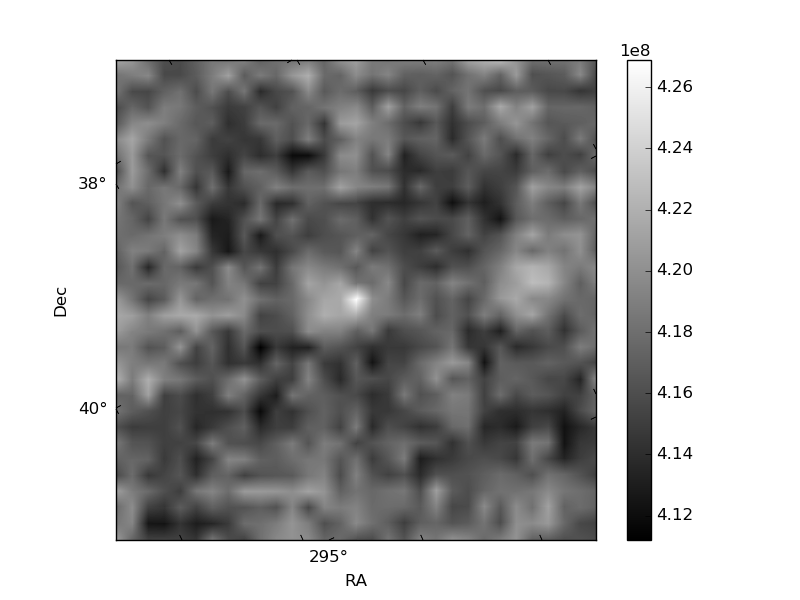
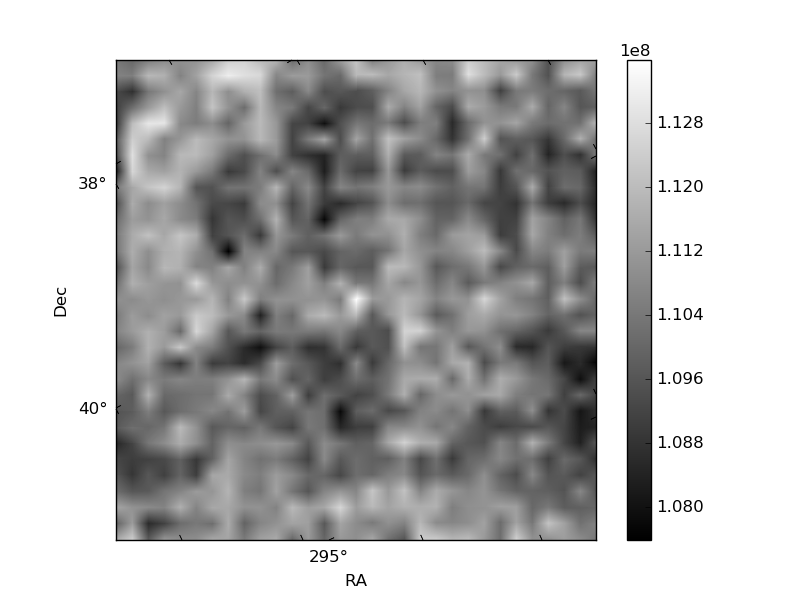
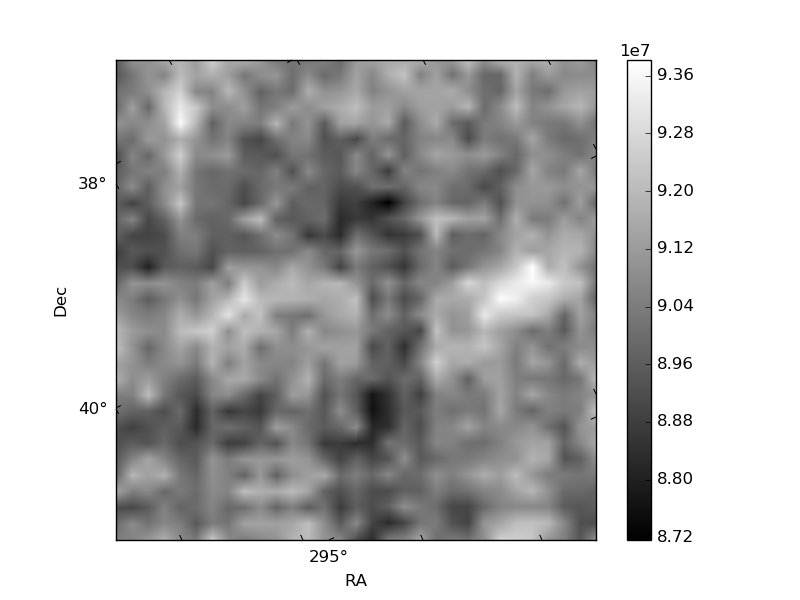
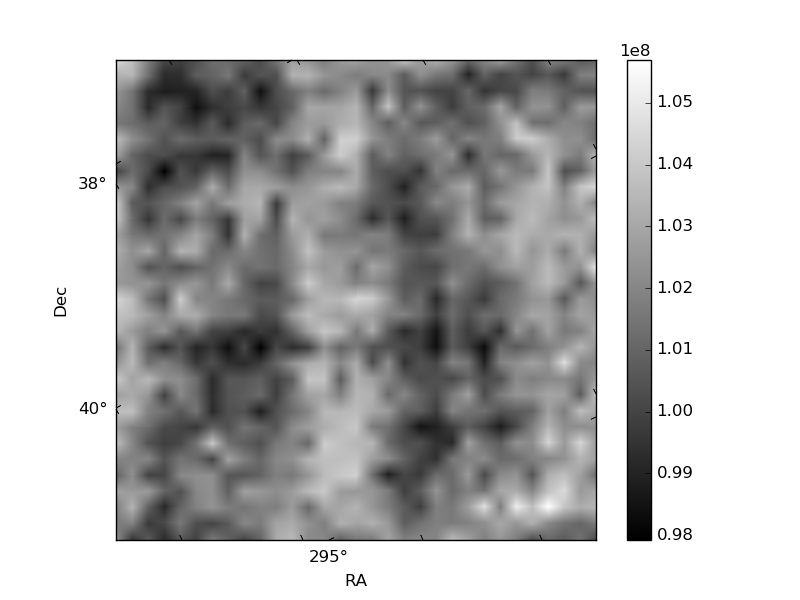
Histogram calculated using DETX and DETY for each event in the final _common_clean file
| Quadrant A | 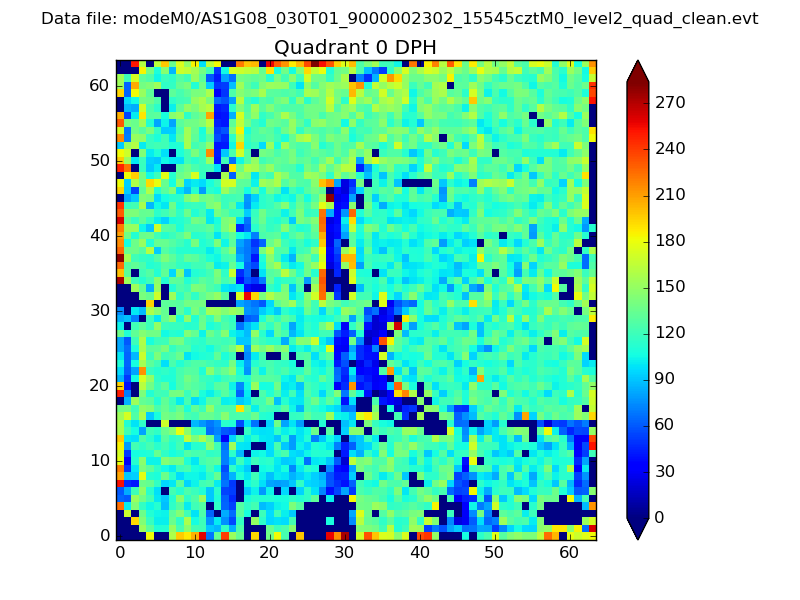 |
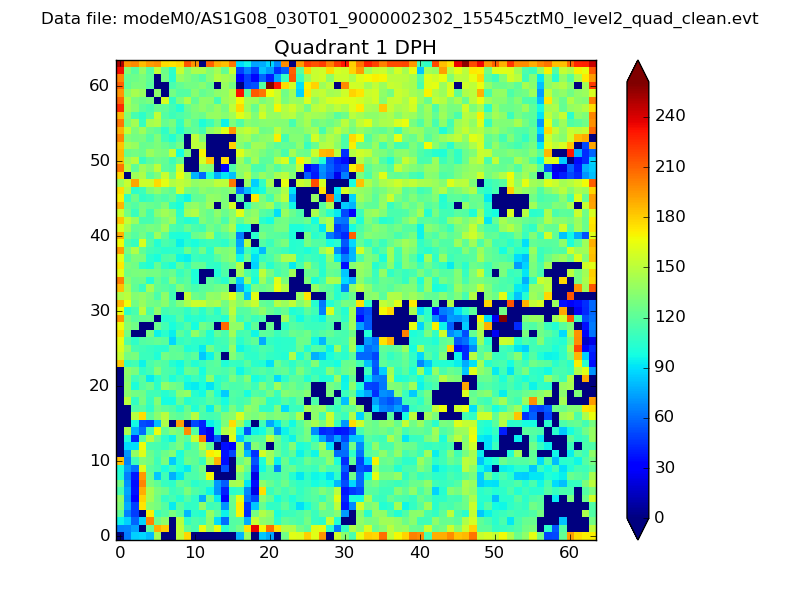 |
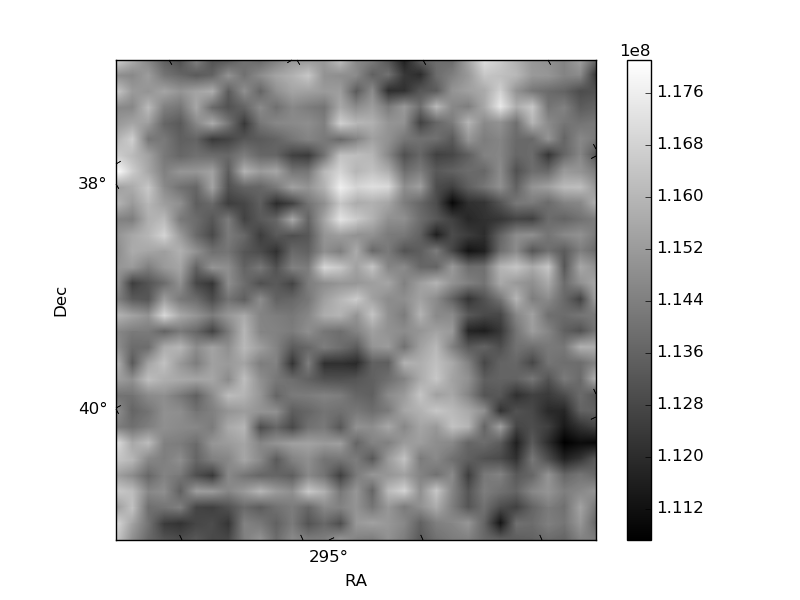
Quadrant B |
|---|---|---|---|
| Quadrant D | 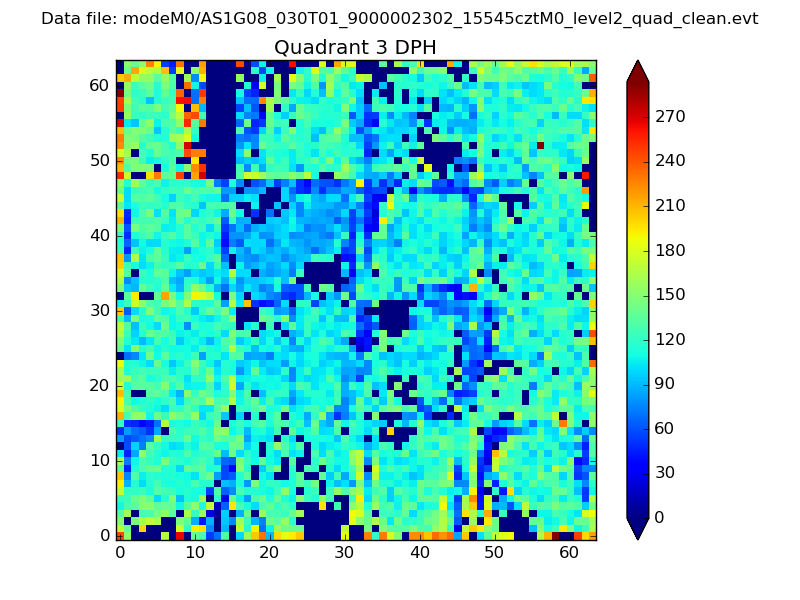 |
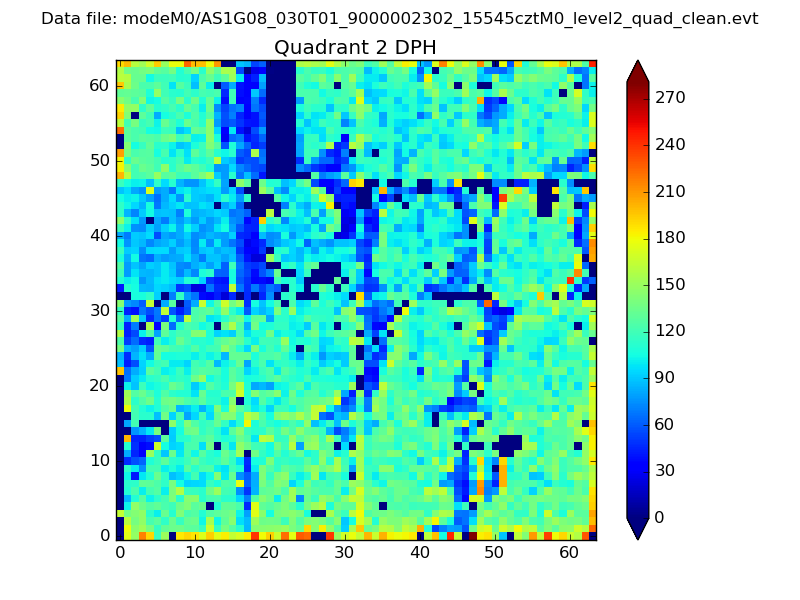 |
Quadrant C |
| Plot type | Count rate plots | Images |
|---|---|---|
| Comparison with Poisson distribution Blue bars denote a histogram of data divided into 1 sec bins. Red curve is a Poisson curve with rate = median count rate of data. |
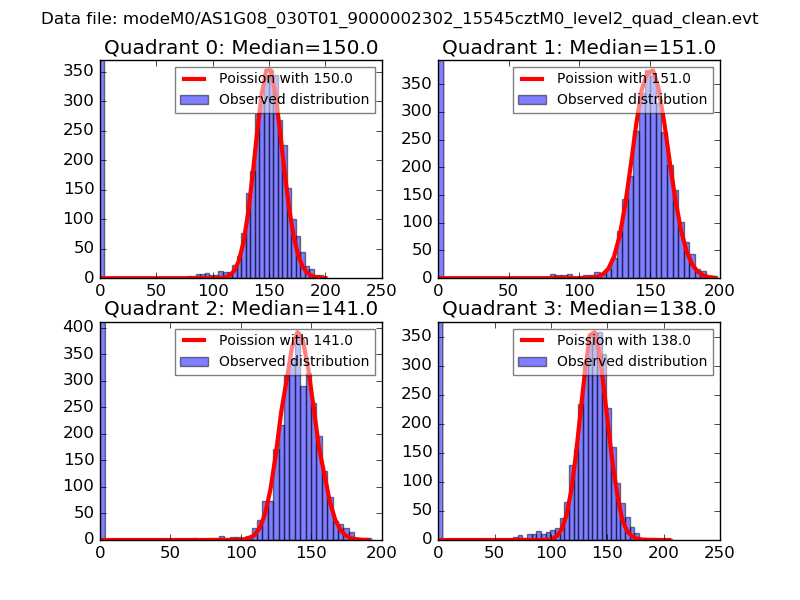 |
 |
| Quadrant-wise count rates Data is divided into 100 sec bins |
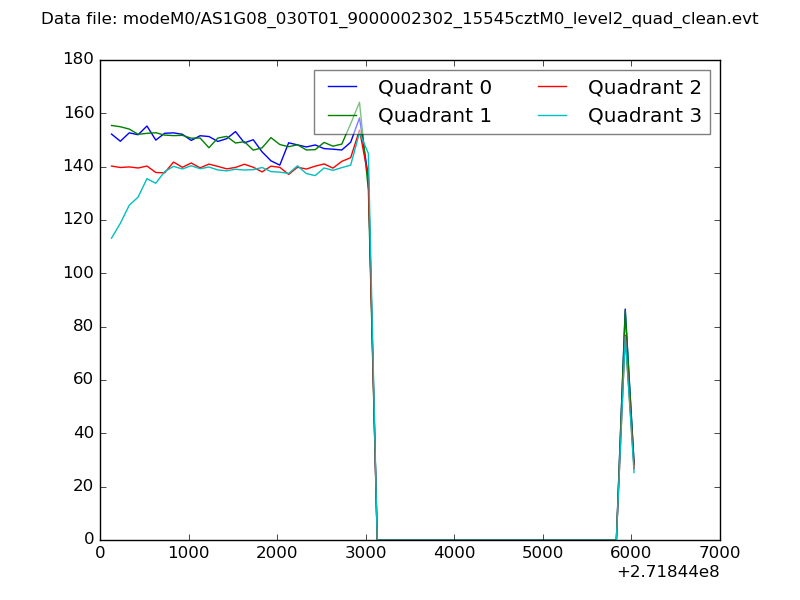 |
|
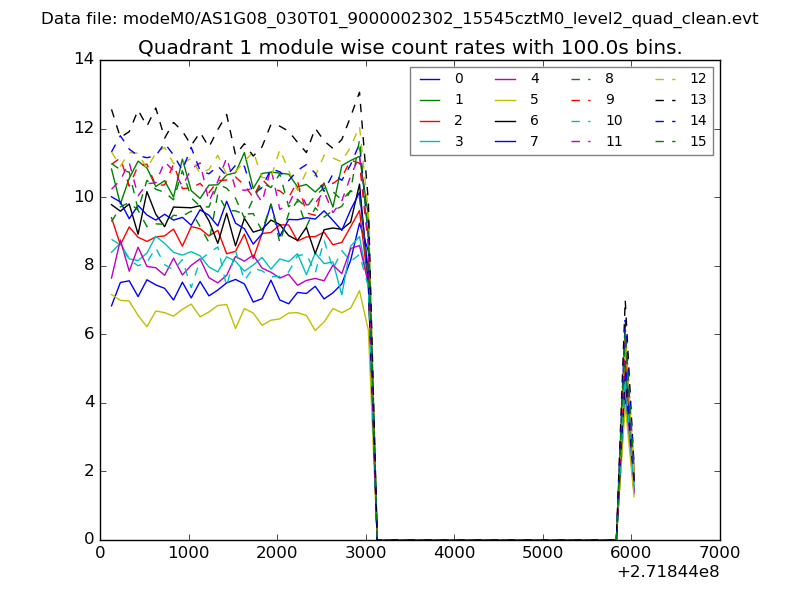
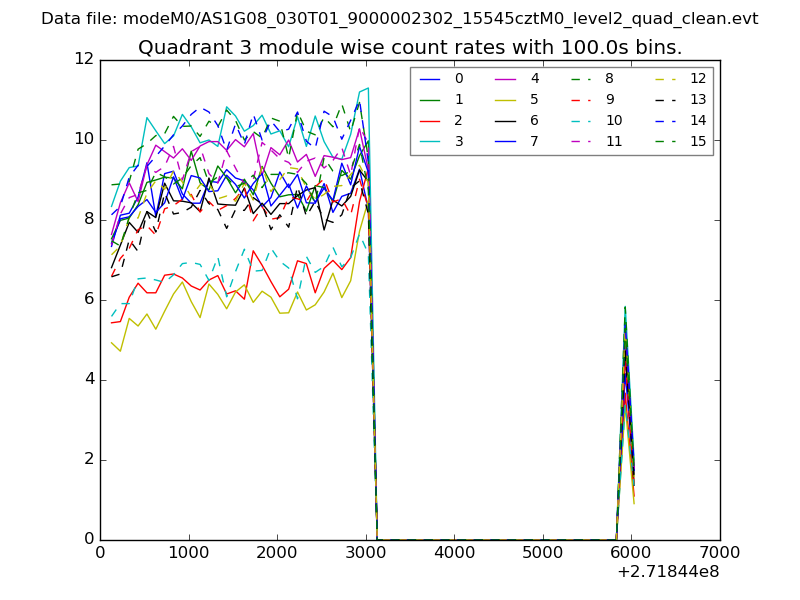
| Module-wise count rates for Quadrant A Data is divided into 100 sec bins |
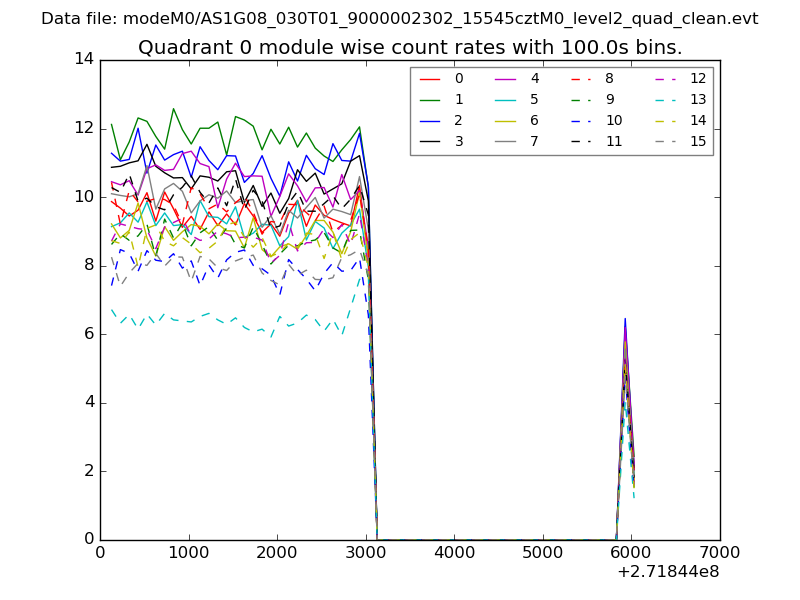 |
 |
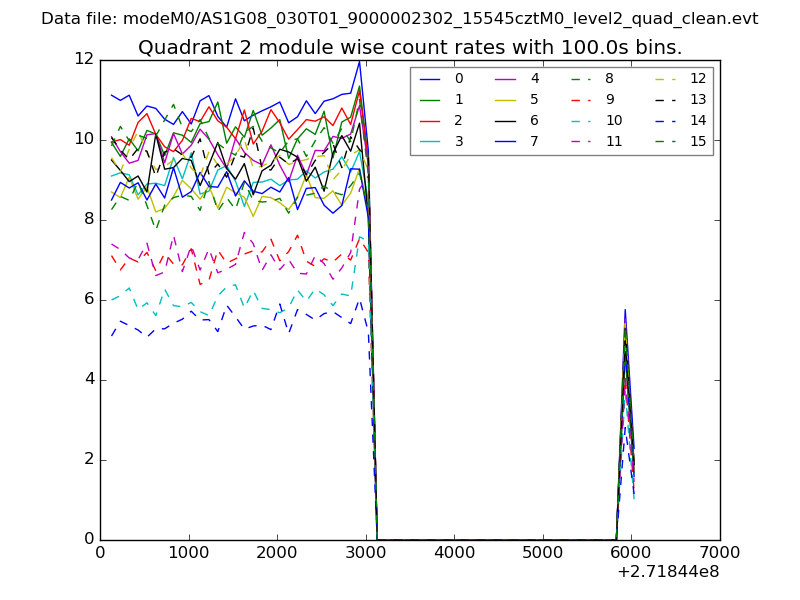
| Module-wise count rates for Quadrant B Data is divided into 100 sec bins |
 |
 |
| Module-wise count rates for Quadrant C Data is divided into 100 sec bins |
 |
 |
| Module-wise count rates for Quadrant D Data is divided into 100 sec bins |
 |
 |
| Parameter | Plot |
|---|---|
| CZT HV Monitor | 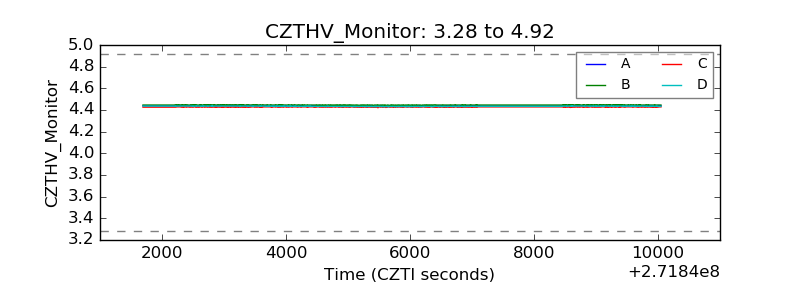 |
| D_VDD | 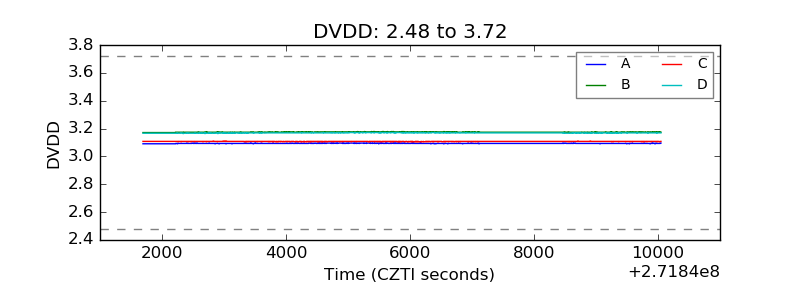 |
| Temperature 1 | 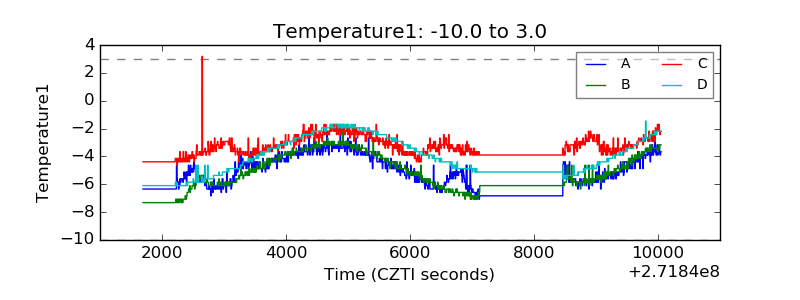 |
| Veto HV Monitor | 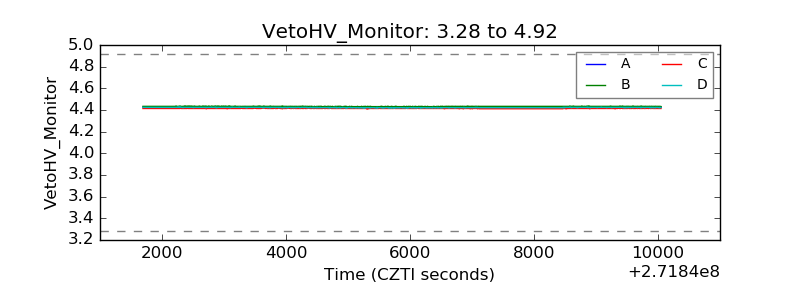 |
| Veto LLD | 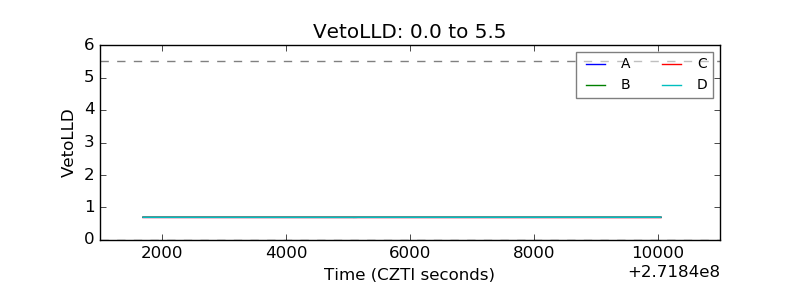 |
| Alpha Counter | 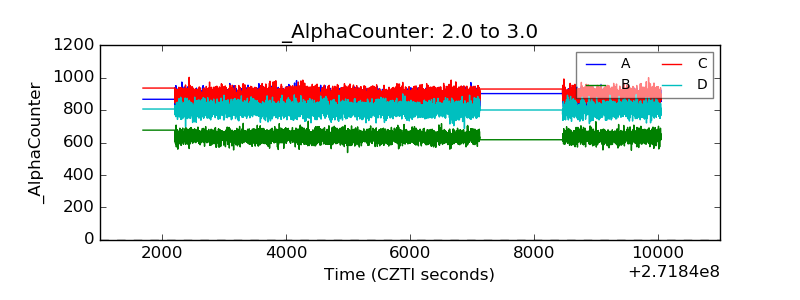 |
| _CPM_Rate | 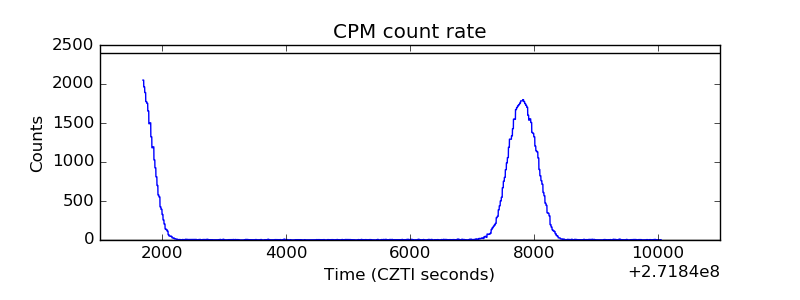 |
| CZT Counter | 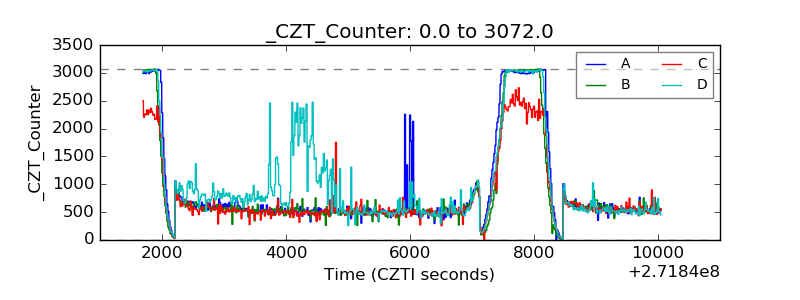 |
| +2.5 Volts monitor |  |
| +5 Volts monitor |  |
| _ROLL_ROT | 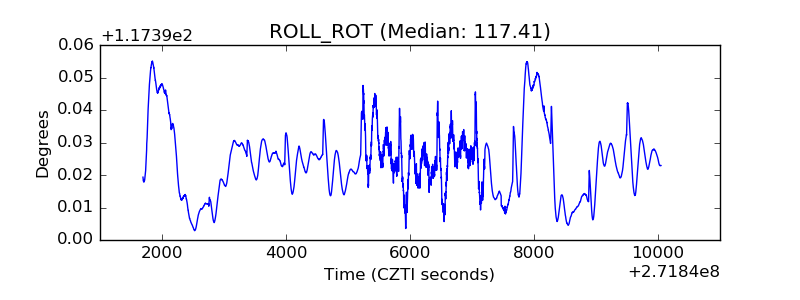 |
| _Roll_DEC | 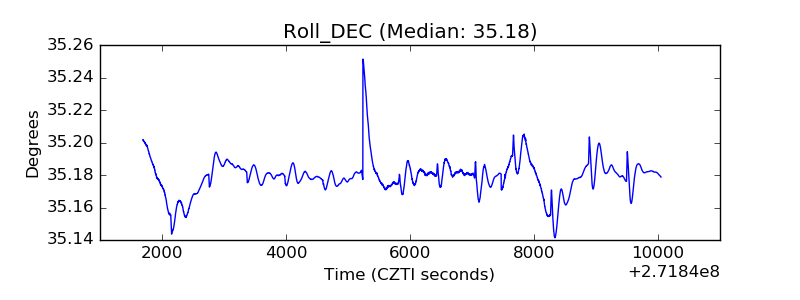 |
| _Roll_RA | 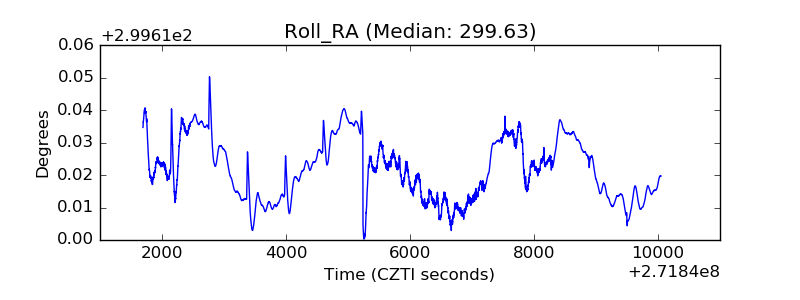 |
| Veto Counter | 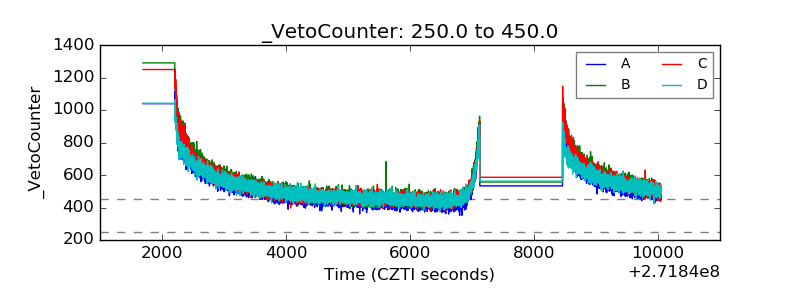 |