| Param | Original file | Final file |
|---|---|---|
| Filename | modeM0/AS1G08_030T01_9000002302_15546cztM0_level2.evt | modeM0/AS1G08_030T01_9000002302_15546cztM0_level2_quad_clean.evt |
| Size (bytes) | 508,691,520 | 88,421,760 |
| Size | 485.1 MB | 84.3 MB |
| Events in quadrant A | 3,494,623 | 573,988 |
| Events in quadrant B | 3,590,570 | 575,112 |
| Events in quadrant C | 3,513,186 | 537,988 |
| Events in quadrant D | 4,365,753 | 536,918 |
| Mode SS | |||
|---|---|---|---|
| Quadrant | BADHDUFLAG | Total packets | Discarded packets |
| A | 0 | 132 | 0 |
| B | 0 | 132 | 0 |
| C | 0 | 132 | 0 |
| D | 0 | 132 | 0 |
| Mode M0 | |||
|---|---|---|---|
| Quadrant | BADHDUFLAG | Total packets | Discarded packets |
| A | 0 | 14144 | 3 |
| B | 0 | 14510 | 2 |
| C | 0 | 14175 | 2 |
| D | 0 | 16991 | 2 |
| Mode M9 | |||
|---|---|---|---|
| Quadrant | BADHDUFLAG | Total packets | Discarded packets |
| A | 0 | 23 | 0 |
| B | 0 | 23 | 0 |
| C | 0 | 23 | 0 |
| D | 0 | 24 | 0 |
| Quadrant | Total seconds | Saturated seconds | Saturation percentage |
|---|---|---|---|
| A | 6505 | 127 | 1.952344% |
| B | 6505 | 141 | 2.167563% |
| C | 6505 | 139 | 2.136818% |
| D | 6505 | 469 | 7.209839% |
Noise dominated data is calculated using 1-second bins in cleaned event files. If a bin has >2000 counts, and if more than 50% of those come from <1% of pixels, then it is considered to be noise-dominated and hence unusable.
| Quadrant | # 1 sec bins | Bins with >0 counts | Bins with >2000 counts | High rate bins dominated by noise | Noise dominated (total time) | Noise dominated (detector-on time) | Marked lightcurve |
|---|---|---|---|---|---|---|---|
| A | 7811 | 6506 | 0 | 0 | 0.00% | 0.00% | 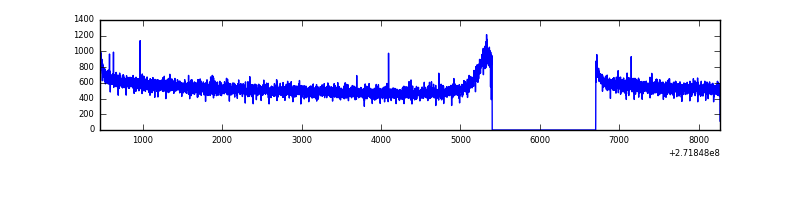 |
| B | 7811 | 6506 | 2 | 2 | 0.03% | 0.03% | 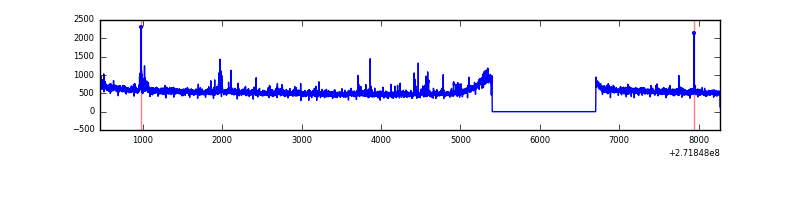 |
| C | 7811 | 6506 | 2 | 2 | 0.03% | 0.03% | 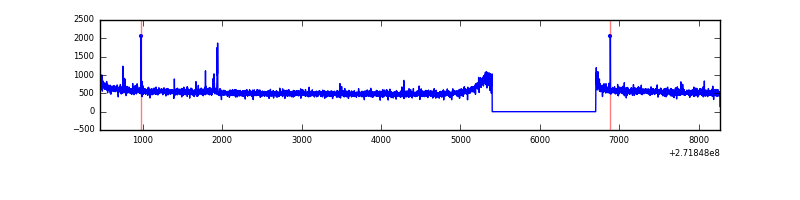 |
| D | 7811 | 6506 | 345 | 345 | 4.42% | 5.30% | 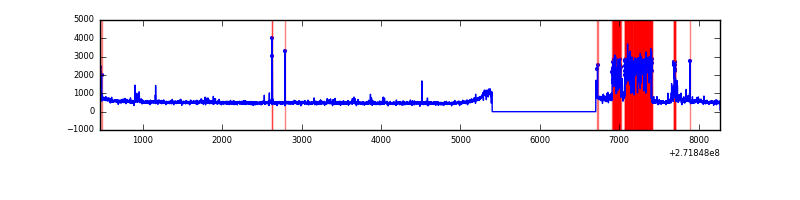 |
Top three noisy pixels from each quadrant. If the there are fewer than three noisy pixels in the level2.evt file, extra rows are filled as -1
| Pixel properties | Quadrant properties | ||||||
|---|---|---|---|---|---|---|---|
| Quadrant | DetID | PixID | Counts | Sigma | Mean | Median | Sigma |
| A | 0 | 226 | 8278 | 40.95 | 907 | 891 | 180.4 |
| A | 12 | 194 | 6798 | 32.74 | 907 | 891 | 180.4 |
| A | 3 | 137 | 5824 | 27.34 | 907 | 891 | 180.4 |
| B | 0 | 189 | 30213 | 172.41 | 894 | 874 | 170.2 |
| B | 0 | 214 | 24118 | 136.59 | 894 | 874 | 170.2 |
| B | 4 | 173 | 23639 | 133.78 | 894 | 874 | 170.2 |
| C | 14 | 238 | 132166 | 672.83 | 847 | 854 | 195.2 |
| C | 3 | 233 | 40207 | 201.64 | 847 | 854 | 195.2 |
| C | 10 | 22 | 22233 | 109.54 | 847 | 854 | 195.2 |
| D | 1 | 52 | 973860 | 4675.68 | 851 | 824 | 208.1 |
| D | 12 | 221 | 36294 | 170.44 | 851 | 824 | 208.1 |
| D | 13 | 104 | 33828 | 158.59 | 851 | 824 | 208.1 |
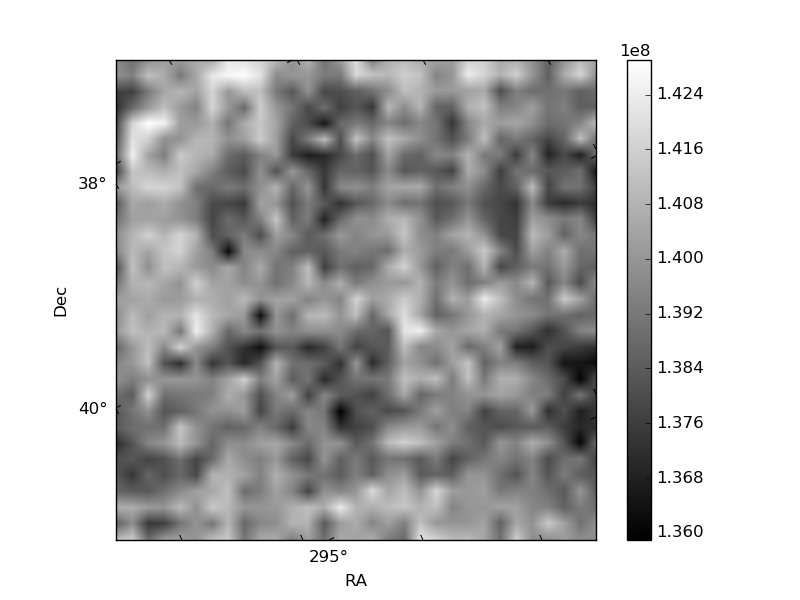
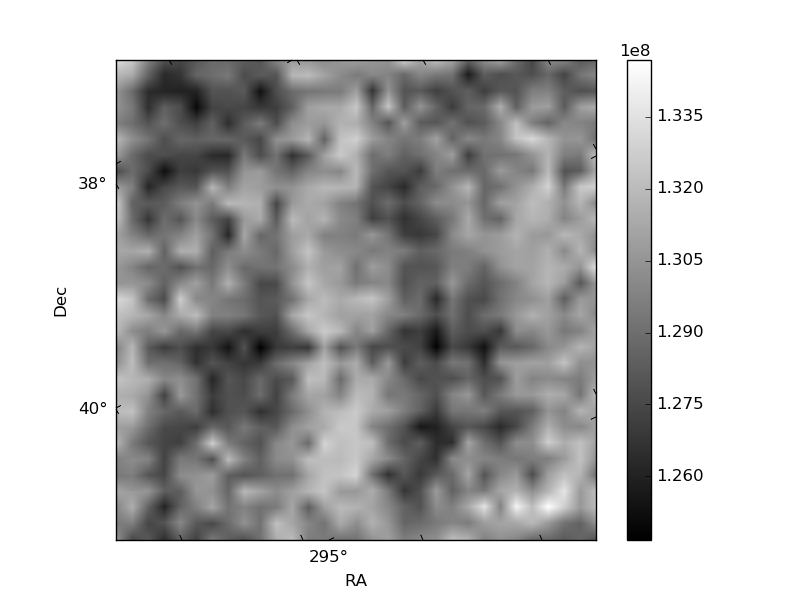
Histogram calculated using DETX and DETY for each event in the final _common_clean file
| Quadrant A | 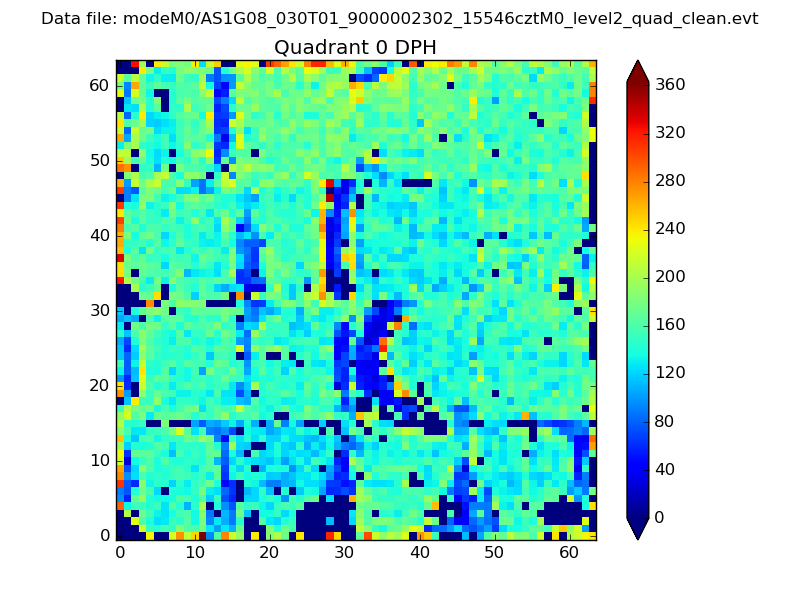 |
 |
Quadrant B |
|---|---|---|---|
| Quadrant D | 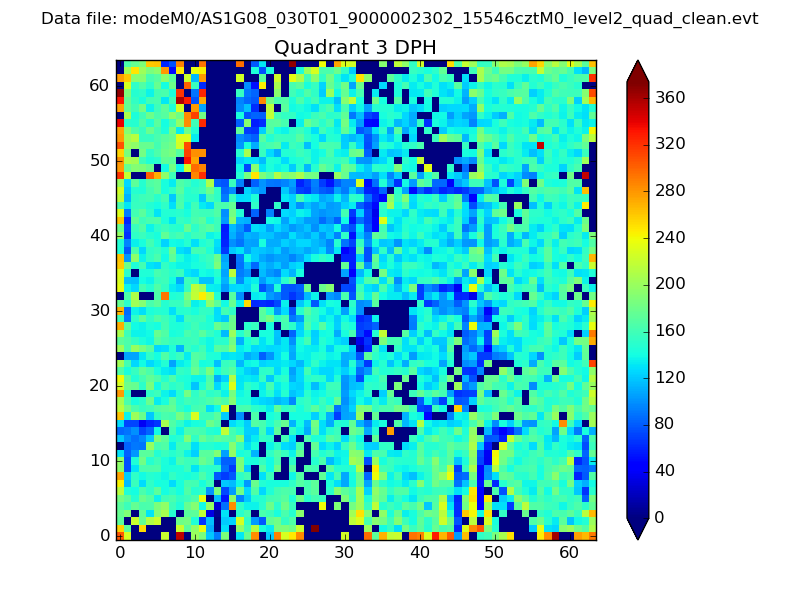 |
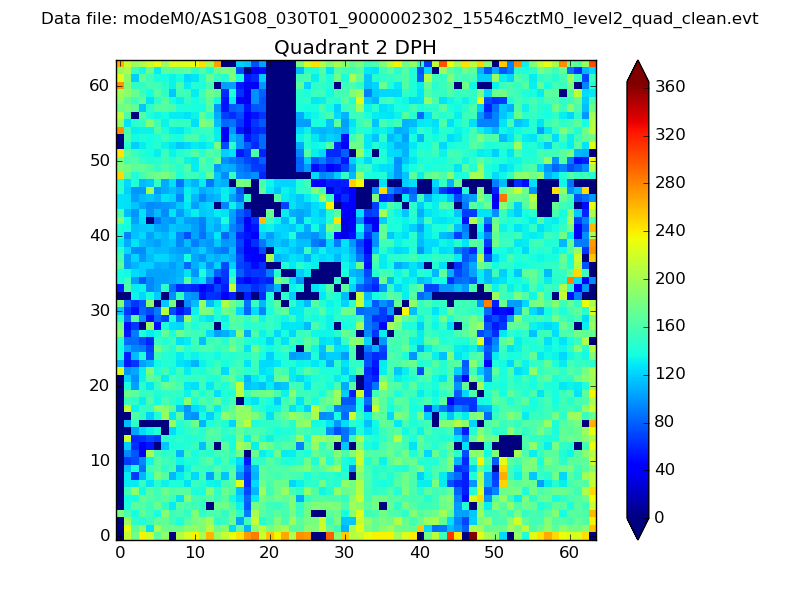 |
Quadrant C |
| Plot type | Count rate plots | Images |
|---|---|---|
| Comparison with Poisson distribution Blue bars denote a histogram of data divided into 1 sec bins. Red curve is a Poisson curve with rate = median count rate of data. |
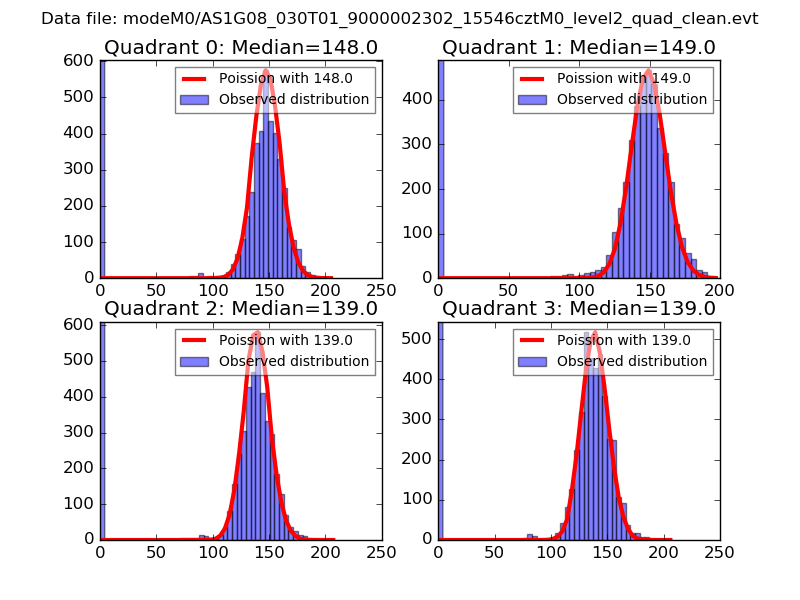 |
 |
| Quadrant-wise count rates Data is divided into 100 sec bins |
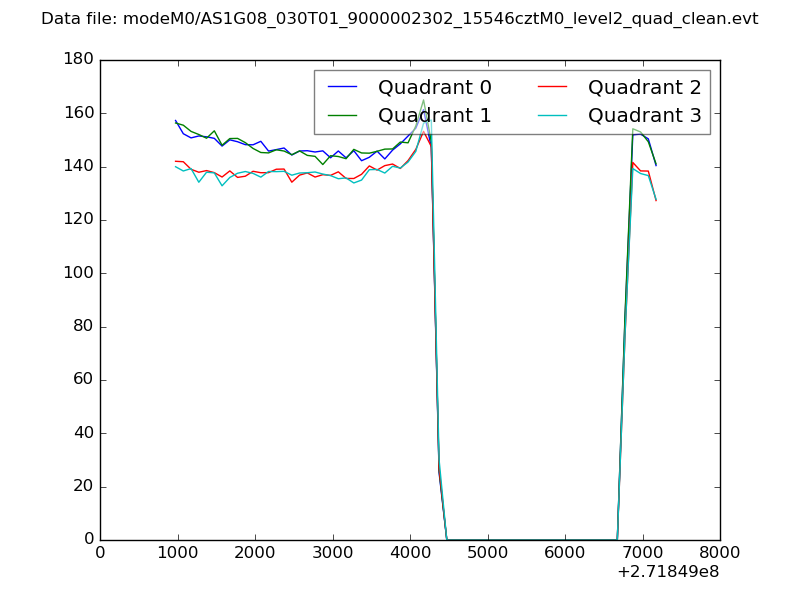 |
|
| Module-wise count rates for Quadrant A Data is divided into 100 sec bins |
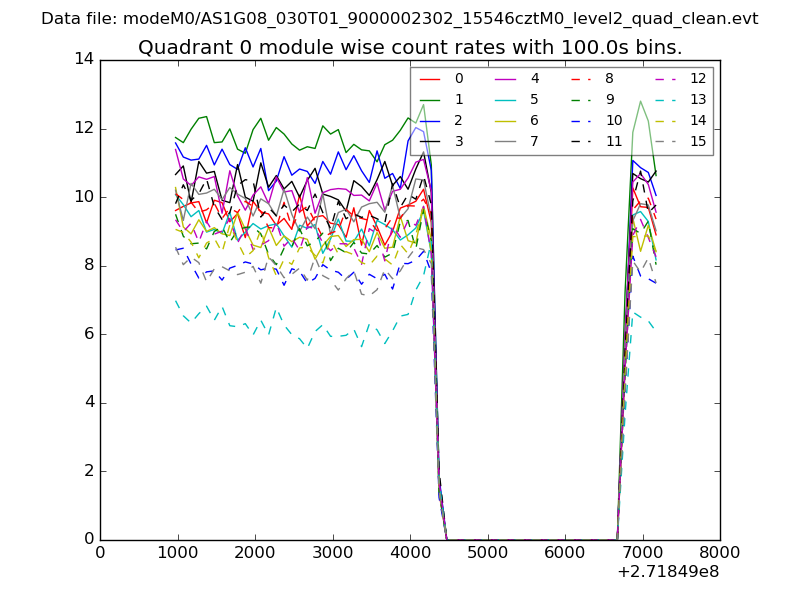 |
 |
| Module-wise count rates for Quadrant B Data is divided into 100 sec bins |
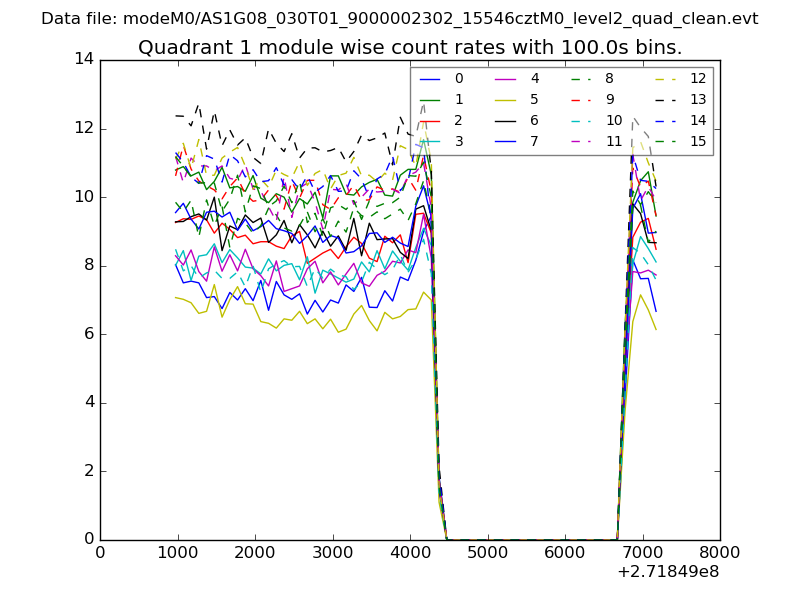 |
 |
| Module-wise count rates for Quadrant C Data is divided into 100 sec bins |
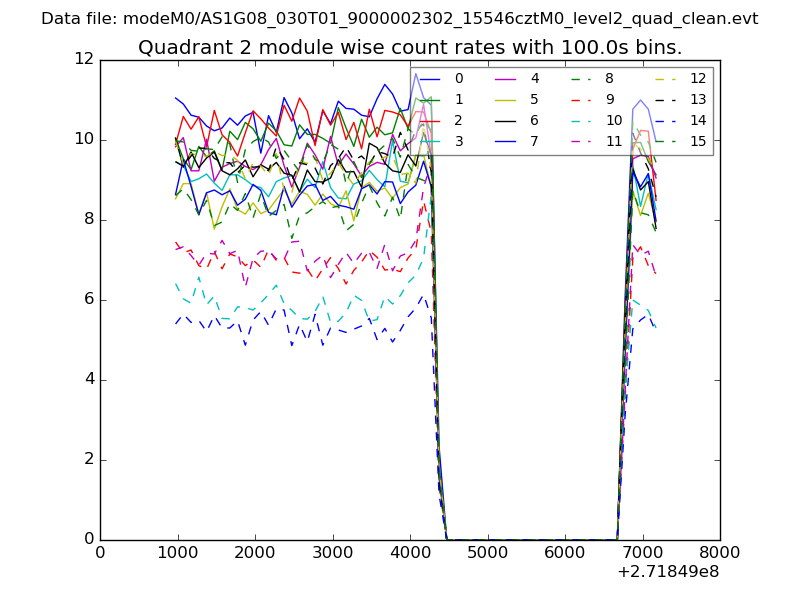 |
 |
| Module-wise count rates for Quadrant D Data is divided into 100 sec bins |
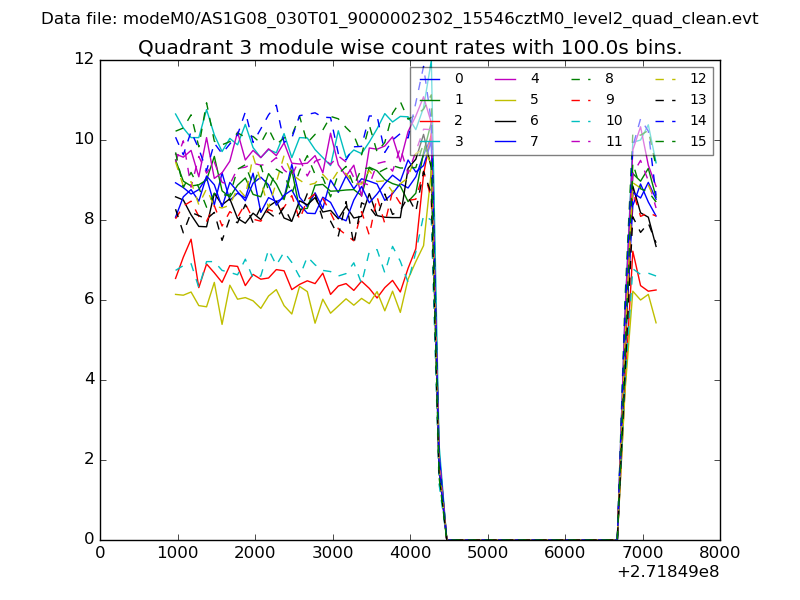 |
 |
| Parameter | Plot |
|---|---|
| CZT HV Monitor | 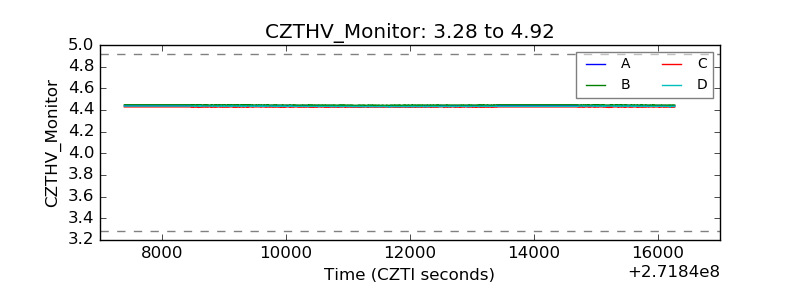 |
| D_VDD | 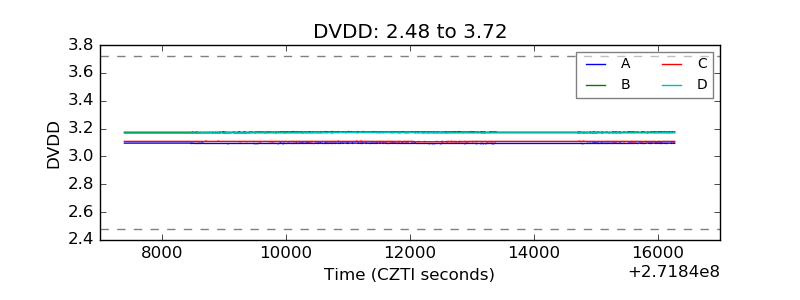 |
| Temperature 1 | 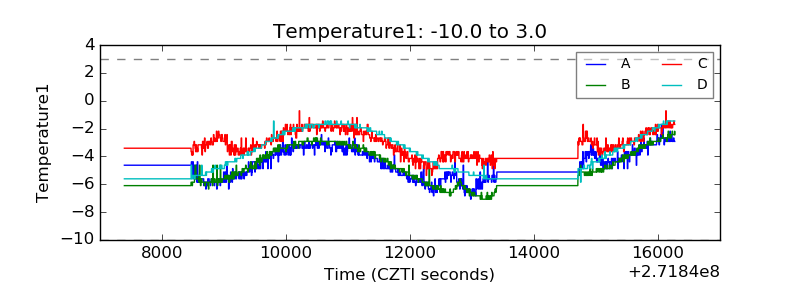 |
| Veto HV Monitor | 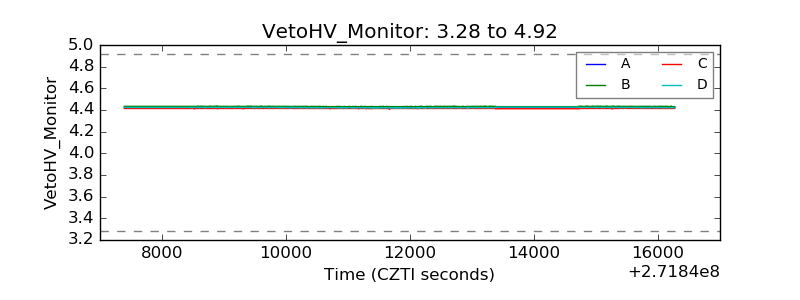 |
| Veto LLD | 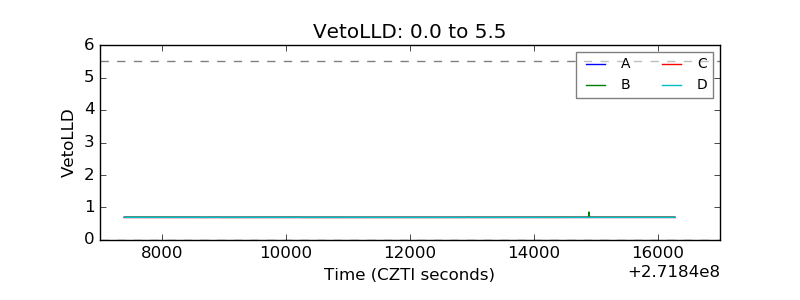 |
| Alpha Counter | 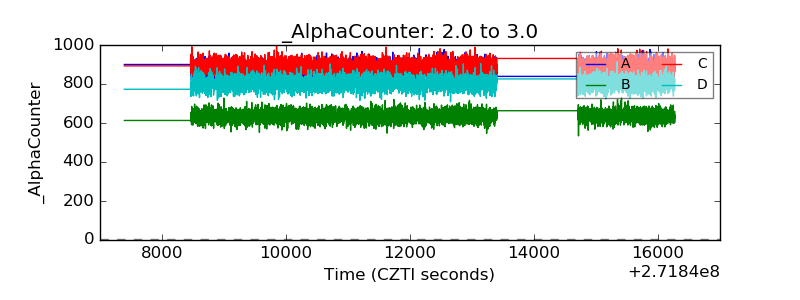 |
| _CPM_Rate | 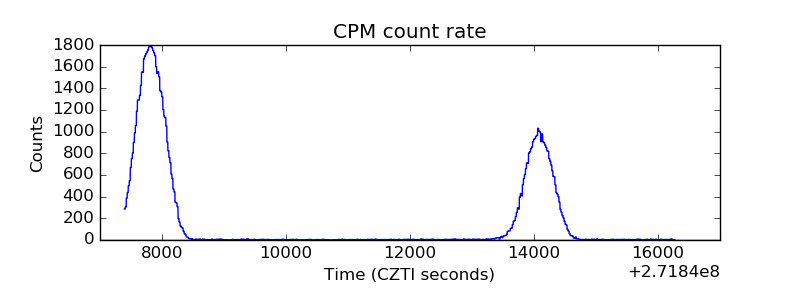 |
| CZT Counter |  |
| +2.5 Volts monitor |  |
| +5 Volts monitor |  |
| _ROLL_ROT | 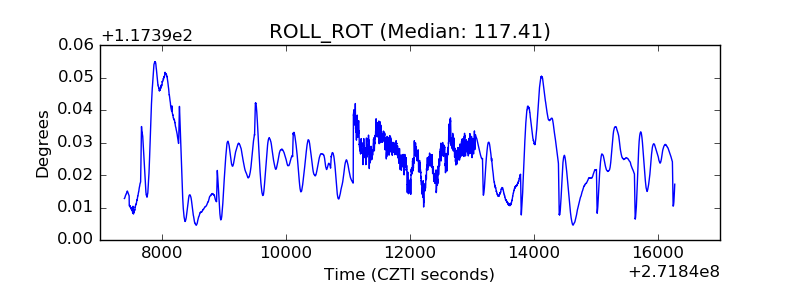 |
| _Roll_DEC | 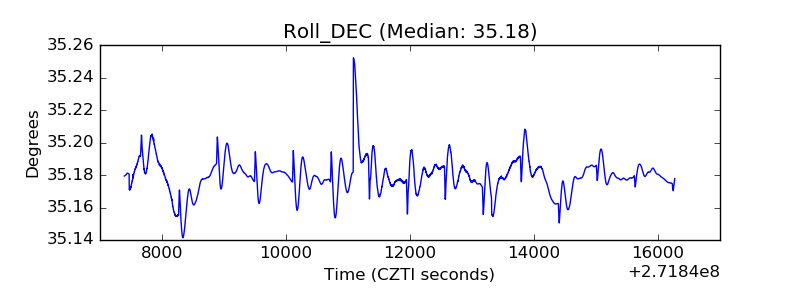 |
| _Roll_RA |  |
| Veto Counter | 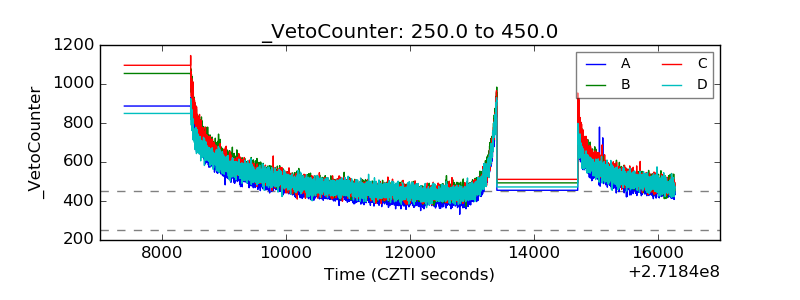 |