| Param | Original file | Final file |
|---|---|---|
| Filename | modeM0/AS1G08_030T01_9000002302_15547cztM0_level2.evt | modeM0/AS1G08_030T01_9000002302_15547cztM0_level2_quad_clean.evt |
| Size (bytes) | 530,426,880 | 97,441,920 |
| Size | 505.9 MB | 92.9 MB |
| Events in quadrant A | 3,457,427 | 642,820 |
| Events in quadrant B | 3,846,065 | 638,723 |
| Events in quadrant C | 3,488,821 | 604,503 |
| Events in quadrant D | 4,817,149 | 598,197 |
| Mode SS | |||
|---|---|---|---|
| Quadrant | BADHDUFLAG | Total packets | Discarded packets |
| A | 0 | 134 | 0 |
| B | 0 | 134 | 0 |
| C | 0 | 134 | 0 |
| D | 0 | 134 | 0 |
| Mode M0 | |||
|---|---|---|---|
| Quadrant | BADHDUFLAG | Total packets | Discarded packets |
| A | 0 | 14189 | 3 |
| B | 0 | 15441 | 2 |
| C | 0 | 14300 | 2 |
| D | 0 | 18603 | 2 |
| Mode M9 | |||
|---|---|---|---|
| Quadrant | BADHDUFLAG | Total packets | Discarded packets |
| A | 0 | 20 | 0 |
| B | 0 | 20 | 0 |
| C | 0 | 20 | 0 |
| D | 0 | 21 | 0 |
| Quadrant | Total seconds | Saturated seconds | Saturation percentage |
|---|---|---|---|
| A | 6702 | 168 | 2.506714% |
| B | 6702 | 250 | 3.730230% |
| C | 6702 | 211 | 3.148314% |
| D | 6702 | 555 | 8.281110% |
Noise dominated data is calculated using 1-second bins in cleaned event files. If a bin has >2000 counts, and if more than 50% of those come from <1% of pixels, then it is considered to be noise-dominated and hence unusable.
| Quadrant | # 1 sec bins | Bins with >0 counts | Bins with >2000 counts | High rate bins dominated by noise | Noise dominated (total time) | Noise dominated (detector-on time) | Marked lightcurve |
|---|---|---|---|---|---|---|---|
| A | 7778 | 6703 | 0 | 0 | 0.00% | 0.00% | 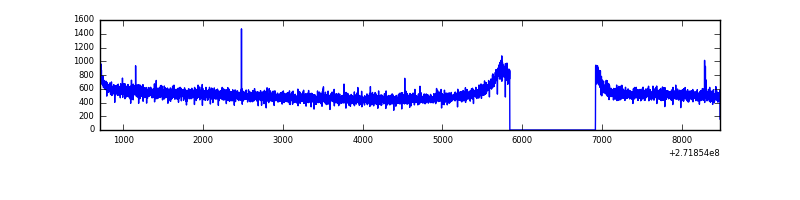 |
| B | 7778 | 6703 | 51 | 51 | 0.66% | 0.76% | 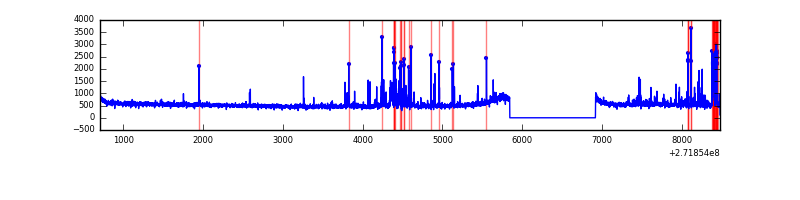 |
| C | 7778 | 6703 | 1 | 1 | 0.01% | 0.01% | 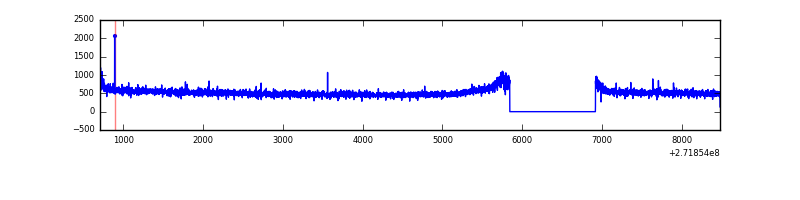 |
| D | 7778 | 6703 | 386 | 386 | 4.96% | 5.76% | 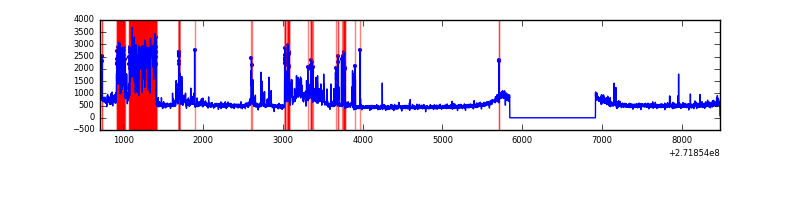 |
Top three noisy pixels from each quadrant. If the there are fewer than three noisy pixels in the level2.evt file, extra rows are filled as -1
| Pixel properties | Quadrant properties | ||||||
|---|---|---|---|---|---|---|---|
| Quadrant | DetID | PixID | Counts | Sigma | Mean | Median | Sigma |
| A | 0 | 226 | 8098 | 40.19 | 897 | 880 | 179.6 |
| A | 9 | 143 | 7026 | 34.22 | 897 | 880 | 179.6 |
| A | 12 | 194 | 6625 | 31.99 | 897 | 880 | 179.6 |
| B | 3 | 64 | 337169 | 2002.29 | 878 | 857 | 168.0 |
| B | 0 | 214 | 30873 | 178.71 | 878 | 857 | 168.0 |
| B | 4 | 173 | 19724 | 112.33 | 878 | 857 | 168.0 |
| C | 14 | 238 | 131435 | 662.43 | 844 | 849 | 197.1 |
| C | 3 | 233 | 46763 | 232.91 | 844 | 849 | 197.1 |
| C | 10 | 187 | 7628 | 34.39 | 844 | 849 | 197.1 |
| D | 1 | 52 | 1013198 | 4986.93 | 844 | 823 | 203.0 |
| D | 5 | 222 | 512622 | 2521.11 | 844 | 823 | 203.0 |
| D | 13 | 104 | 35990 | 173.23 | 844 | 823 | 203.0 |
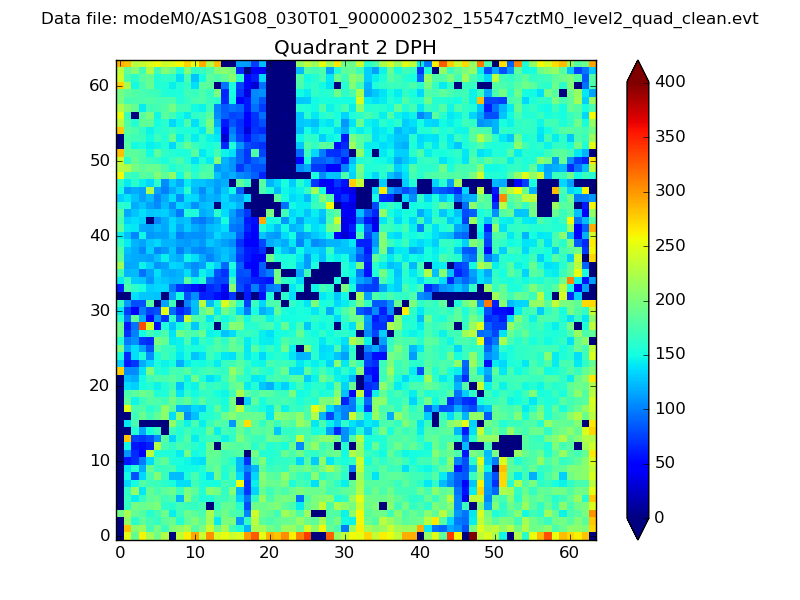
Histogram calculated using DETX and DETY for each event in the final _common_clean file
| Quadrant A | 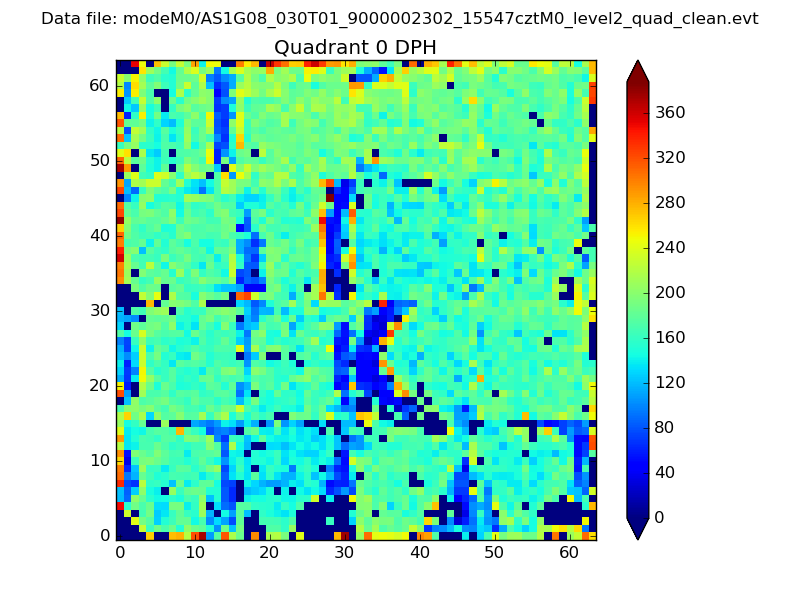 |
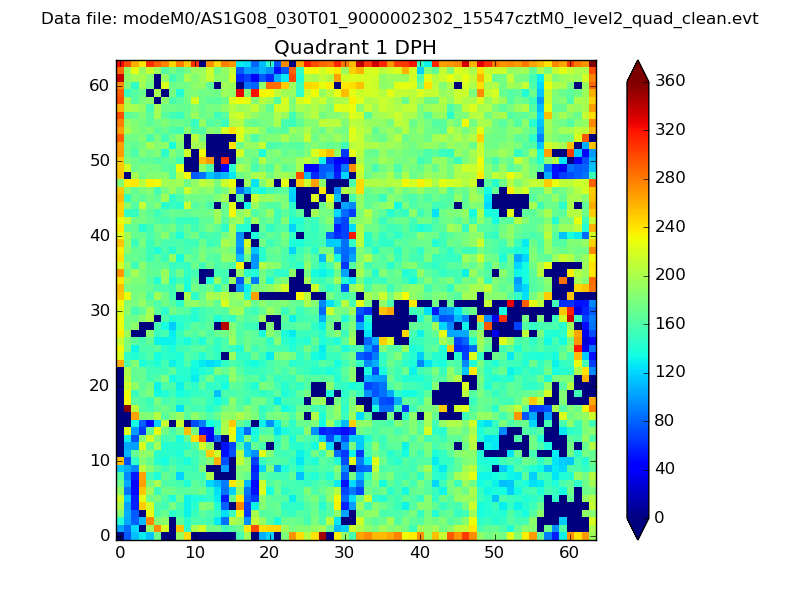 |
Quadrant B |
|---|---|---|---|
| Quadrant D | 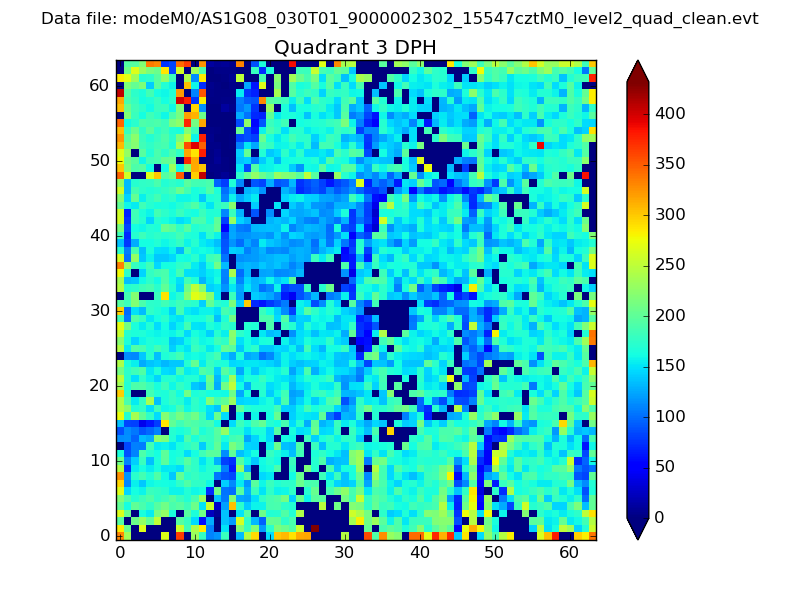 |
 |
Quadrant C |
| Plot type | Count rate plots | Images |
|---|---|---|
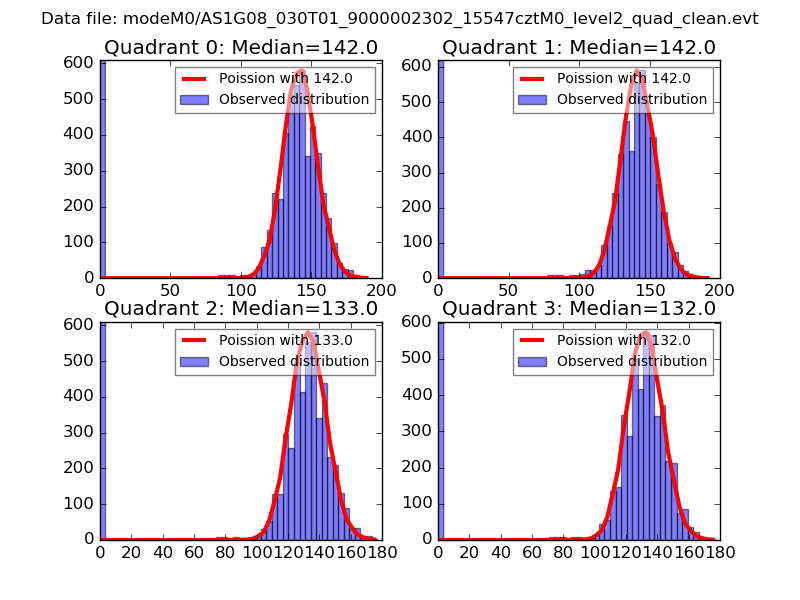
| Comparison with Poisson distribution Blue bars denote a histogram of data divided into 1 sec bins. Red curve is a Poisson curve with rate = median count rate of data. |
 |
 |
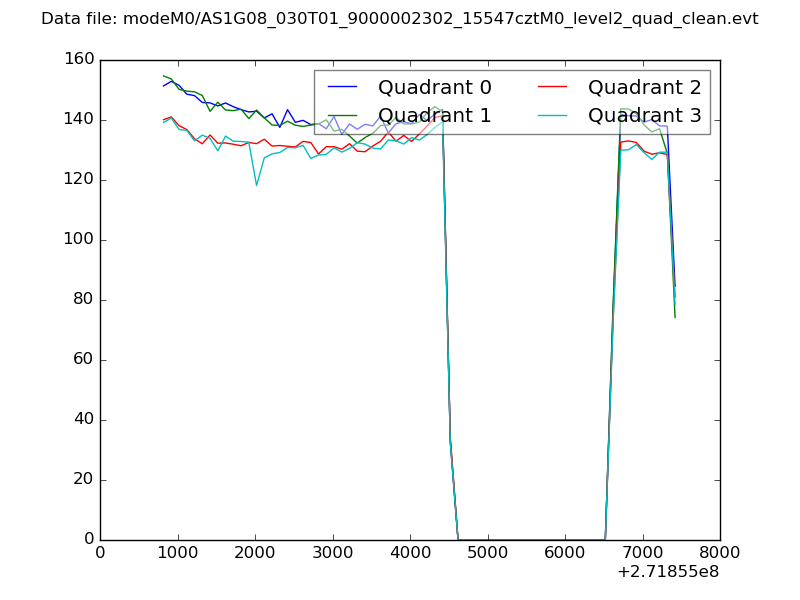
| Quadrant-wise count rates Data is divided into 100 sec bins |
 |
|
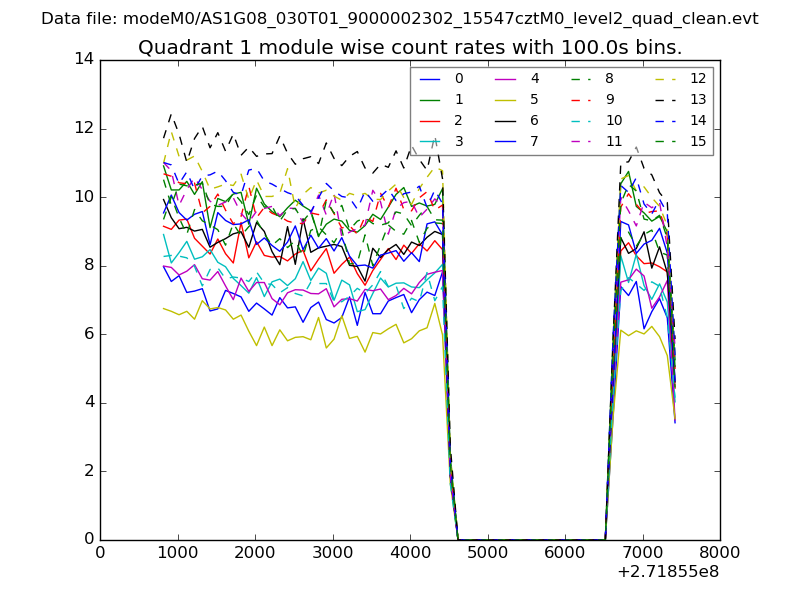
| Module-wise count rates for Quadrant A Data is divided into 100 sec bins |
 |
 |
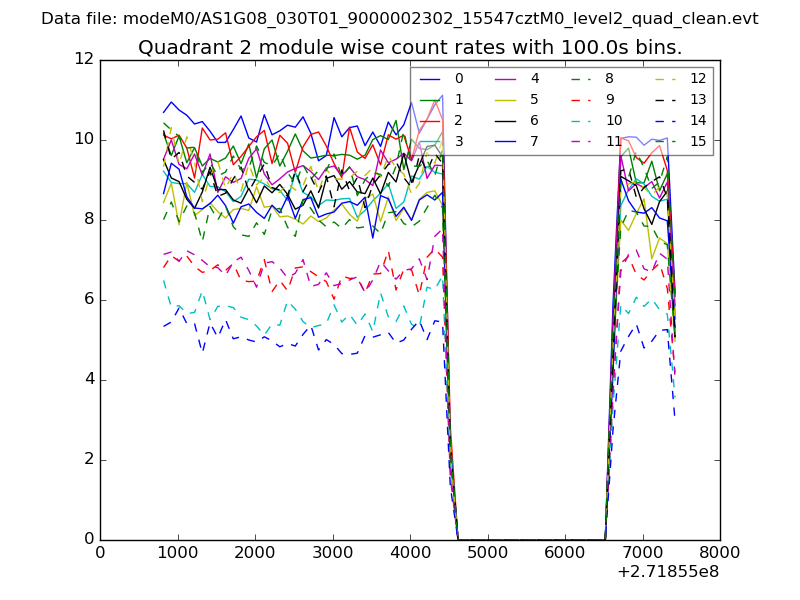
| Module-wise count rates for Quadrant B Data is divided into 100 sec bins |
 |
 |
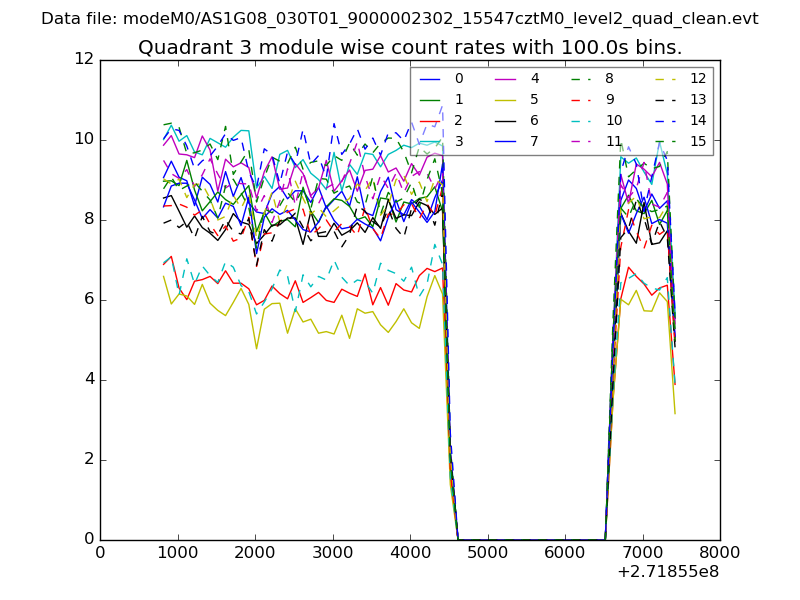
| Module-wise count rates for Quadrant C Data is divided into 100 sec bins |
 |
 |
| Module-wise count rates for Quadrant D Data is divided into 100 sec bins |
 |
 |
| Parameter | Plot |
|---|---|
| CZT HV Monitor | 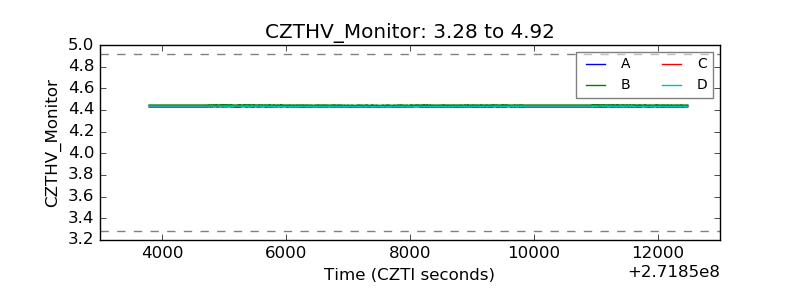 |
| D_VDD |  |
| Temperature 1 | 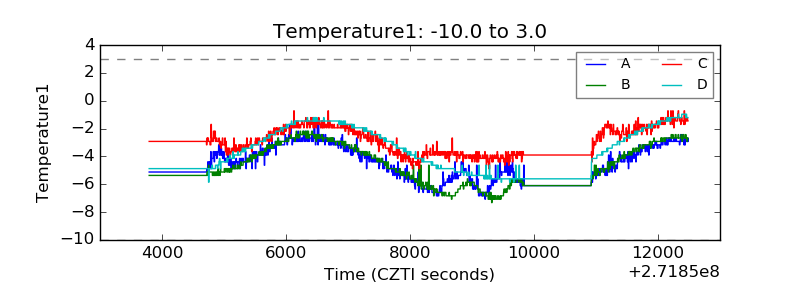 |
| Veto HV Monitor | 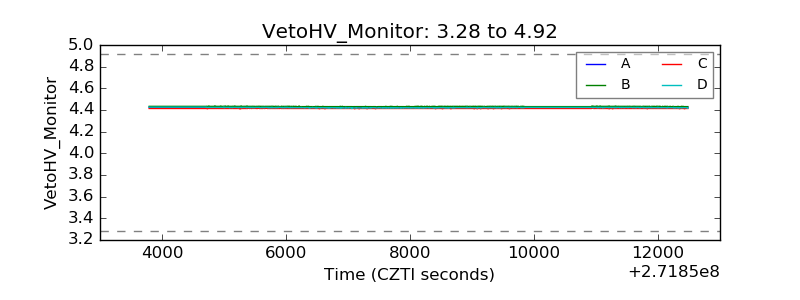 |
| Veto LLD | 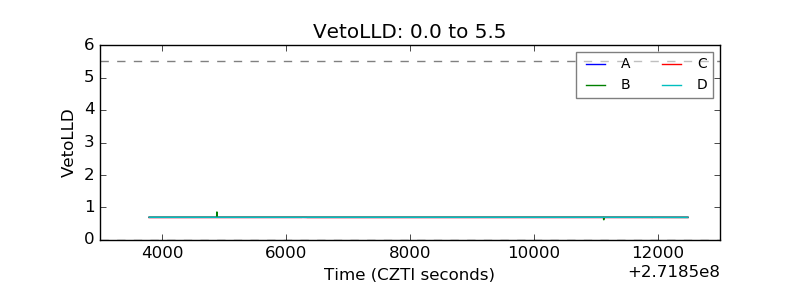 |
| Alpha Counter | 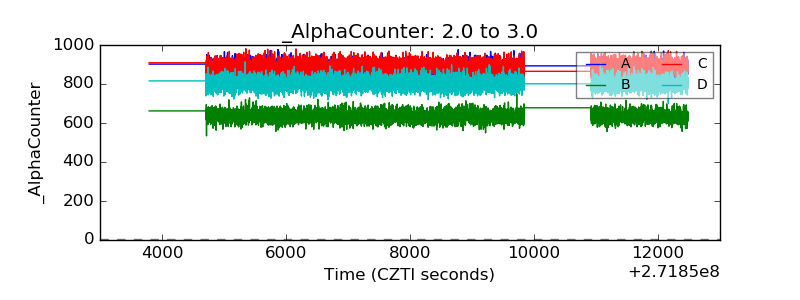 |
| _CPM_Rate | 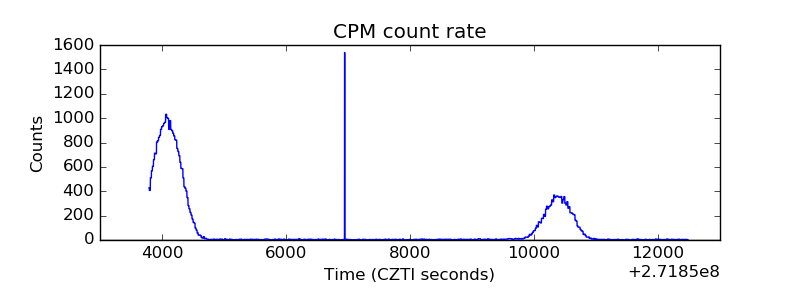 |
| CZT Counter | 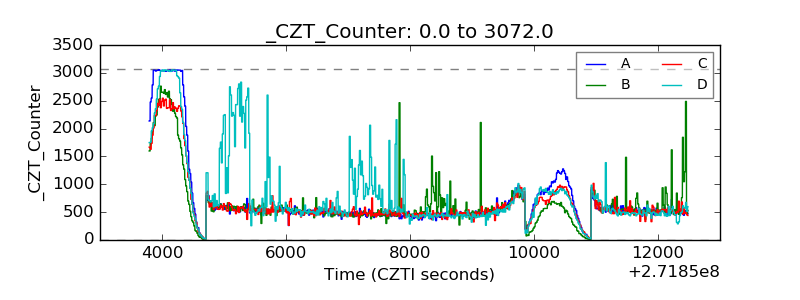 |
| +2.5 Volts monitor | 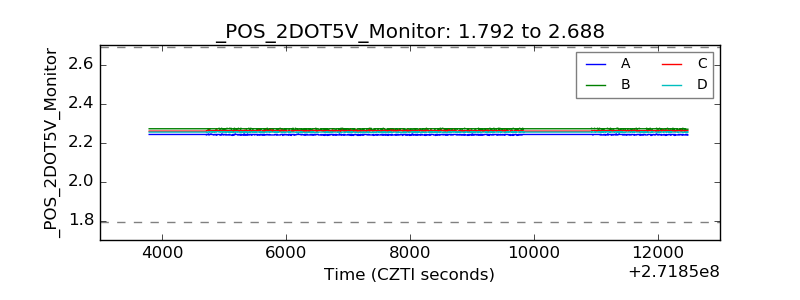 |
| +5 Volts monitor |  |
| _ROLL_ROT | 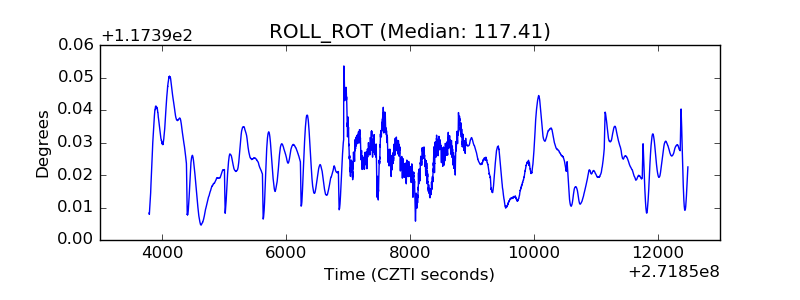 |
| _Roll_DEC | 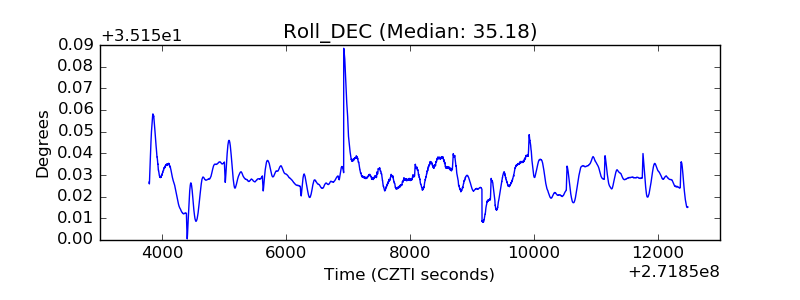 |
| _Roll_RA | 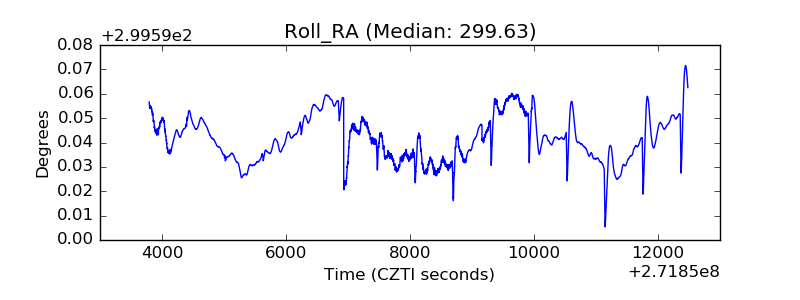 |
| Veto Counter | 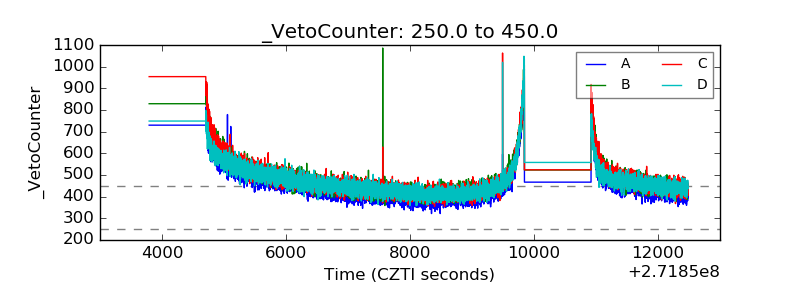 |