| Param | Original file | Final file |
|---|---|---|
| Filename | modeM0/AS1G08_030T01_9000002302_15548cztM0_level2.evt | modeM0/AS1G08_030T01_9000002302_15548cztM0_level2_quad_clean.evt |
| Size (bytes) | 505,972,800 | 99,642,240 |
| Size | 482.5 MB | 95.0 MB |
| Events in quadrant A | 3,397,184 | 652,726 |
| Events in quadrant B | 3,944,547 | 649,521 |
| Events in quadrant C | 3,459,413 | 617,530 |
| Events in quadrant D | 4,047,680 | 611,109 |
| Mode SS | |||
|---|---|---|---|
| Quadrant | BADHDUFLAG | Total packets | Discarded packets |
| A | 0 | 142 | 0 |
| B | 0 | 142 | 0 |
| C | 0 | 142 | 0 |
| D | 0 | 142 | 0 |
| Mode M0 | |||
|---|---|---|---|
| Quadrant | BADHDUFLAG | Total packets | Discarded packets |
| A | 0 | 14446 | 3 |
| B | 0 | 16075 | 2 |
| C | 0 | 14495 | 2 |
| D | 0 | 16478 | 2 |
| Mode M9 | |||
|---|---|---|---|
| Quadrant | BADHDUFLAG | Total packets | Discarded packets |
| A | 0 | 8 | 0 |
| B | 0 | 8 | 0 |
| C | 0 | 8 | 0 |
| D | 0 | 9 | 0 |
| Quadrant | Total seconds | Saturated seconds | Saturation percentage |
|---|---|---|---|
| A | 6987 | 113 | 1.617289% |
| B | 6987 | 249 | 3.563761% |
| C | 6987 | 160 | 2.289967% |
| D | 6987 | 171 | 2.447402% |
Noise dominated data is calculated using 1-second bins in cleaned event files. If a bin has >2000 counts, and if more than 50% of those come from <1% of pixels, then it is considered to be noise-dominated and hence unusable.
| Quadrant | # 1 sec bins | Bins with >0 counts | Bins with >2000 counts | High rate bins dominated by noise | Noise dominated (total time) | Noise dominated (detector-on time) | Marked lightcurve |
|---|---|---|---|---|---|---|---|
| A | 7753 | 6988 | 0 | 0 | 0.00% | 0.00% | 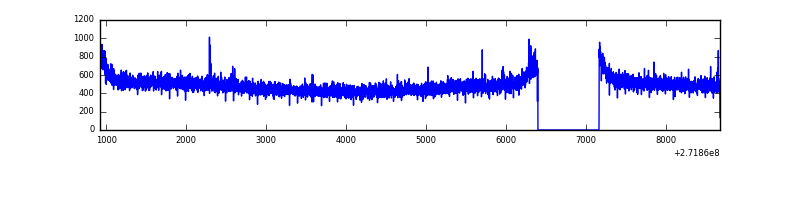 |
| B | 7753 | 6988 | 67 | 67 | 0.86% | 0.96% | 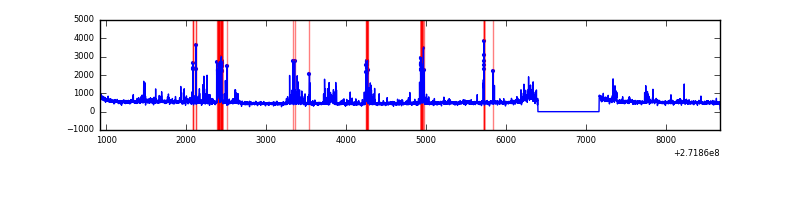 |
| C | 7753 | 6988 | 0 | 0 | 0.00% | 0.00% | 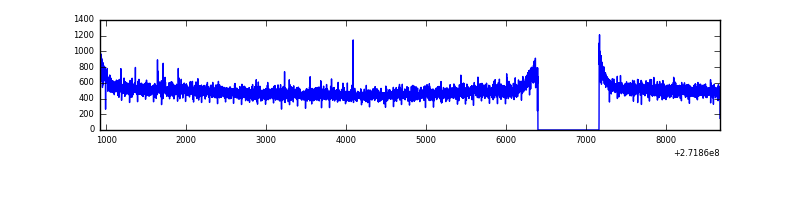 |
| D | 7753 | 6988 | 53 | 53 | 0.68% | 0.76% | 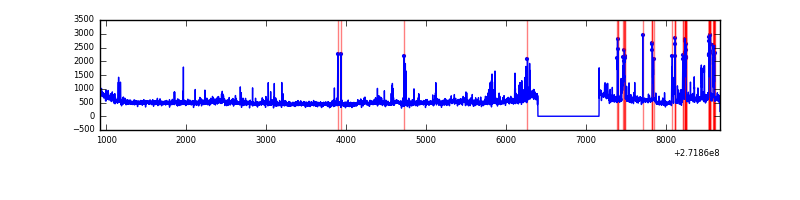 |
Top three noisy pixels from each quadrant. If the there are fewer than three noisy pixels in the level2.evt file, extra rows are filled as -1
| Pixel properties | Quadrant properties | ||||||
|---|---|---|---|---|---|---|---|
| Quadrant | DetID | PixID | Counts | Sigma | Mean | Median | Sigma |
| A | 9 | 143 | 8891 | 45.27 | 880 | 862 | 177.4 |
| A | 0 | 226 | 8147 | 41.07 | 880 | 862 | 177.4 |
| A | 12 | 194 | 6523 | 31.92 | 880 | 862 | 177.4 |
| B | 3 | 64 | 445160 | 2726.4 | 865 | 843 | 163.0 |
| B | 4 | 48 | 59052 | 357.18 | 865 | 843 | 163.0 |
| B | 12 | 111 | 19409 | 113.92 | 865 | 843 | 163.0 |
| C | 14 | 238 | 130620 | 664.28 | 837 | 840 | 195.4 |
| C | 3 | 233 | 51524 | 259.43 | 837 | 840 | 195.4 |
| C | 0 | 207 | 8387 | 38.63 | 837 | 840 | 195.4 |
| D | 1 | 52 | 527681 | 2381.5 | 846 | 828 | 221.2 |
| D | 5 | 222 | 179712 | 808.6 | 846 | 828 | 221.2 |
| D | 7 | 223 | 34309 | 151.34 | 846 | 828 | 221.2 |
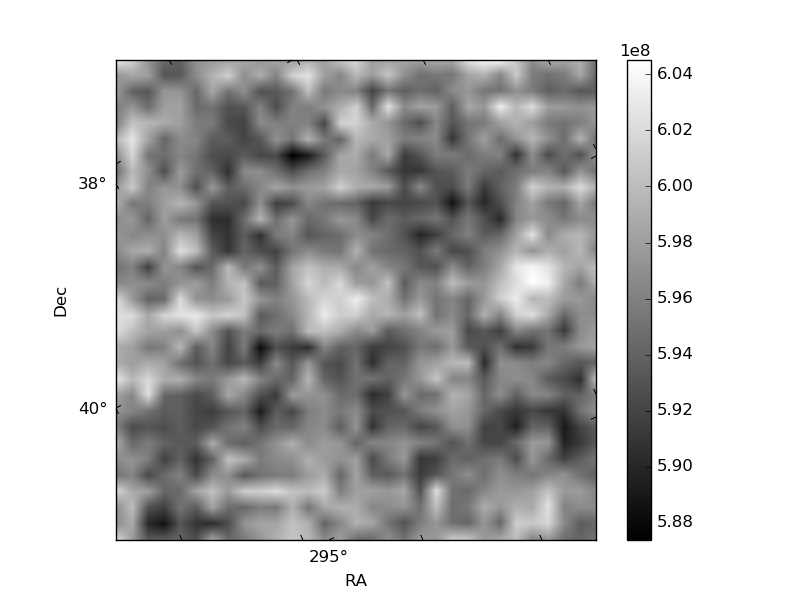
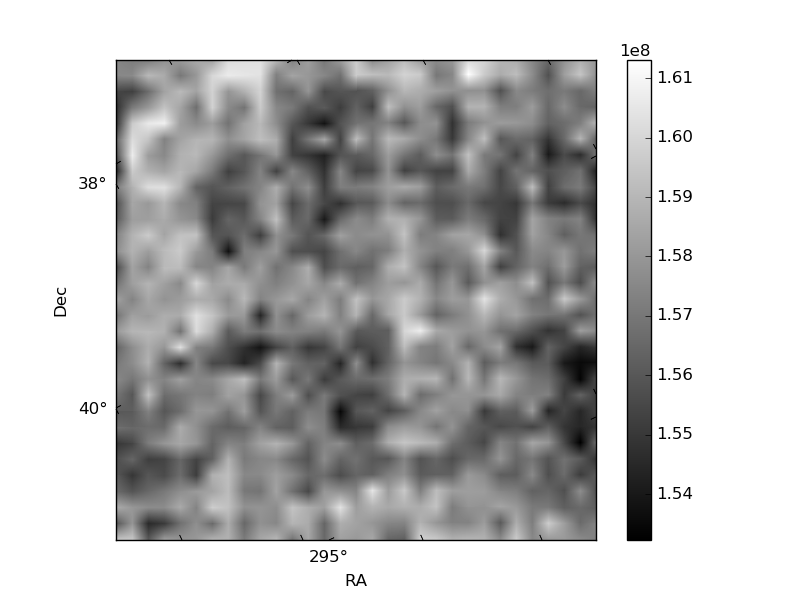
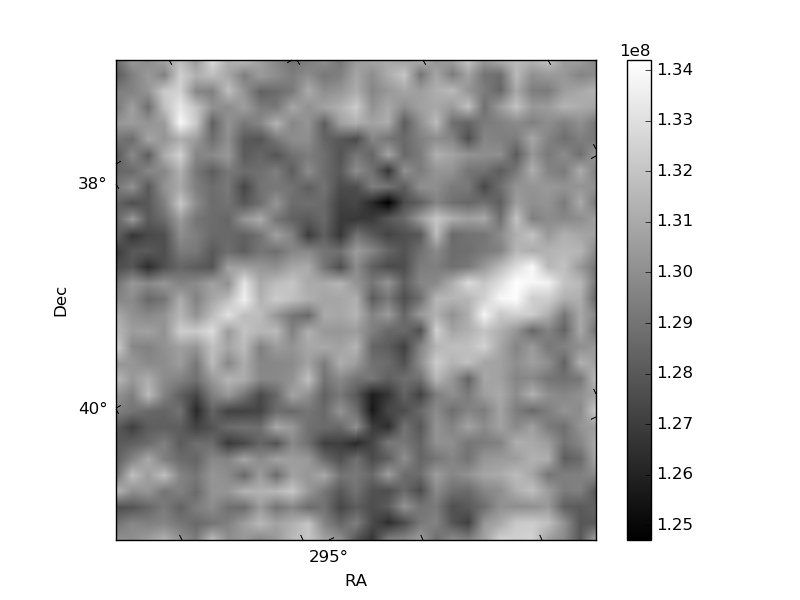
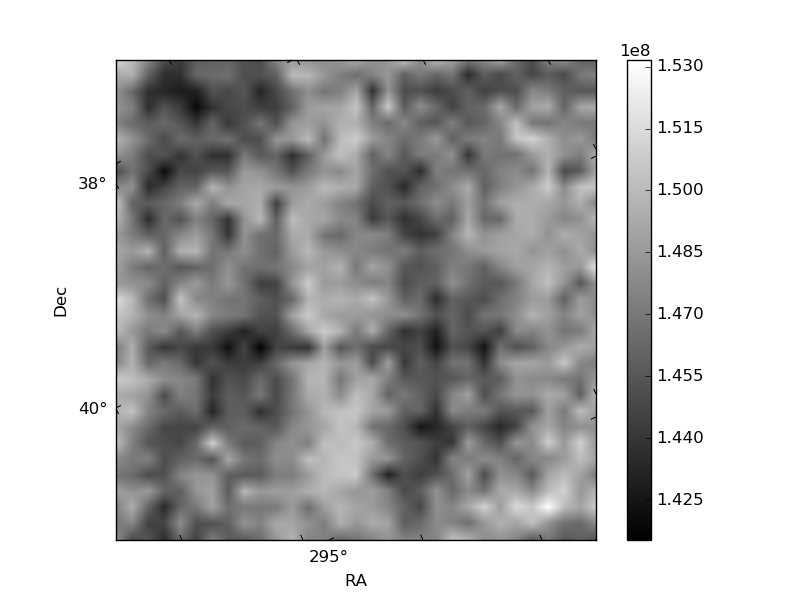
Histogram calculated using DETX and DETY for each event in the final _common_clean file
| Quadrant A | 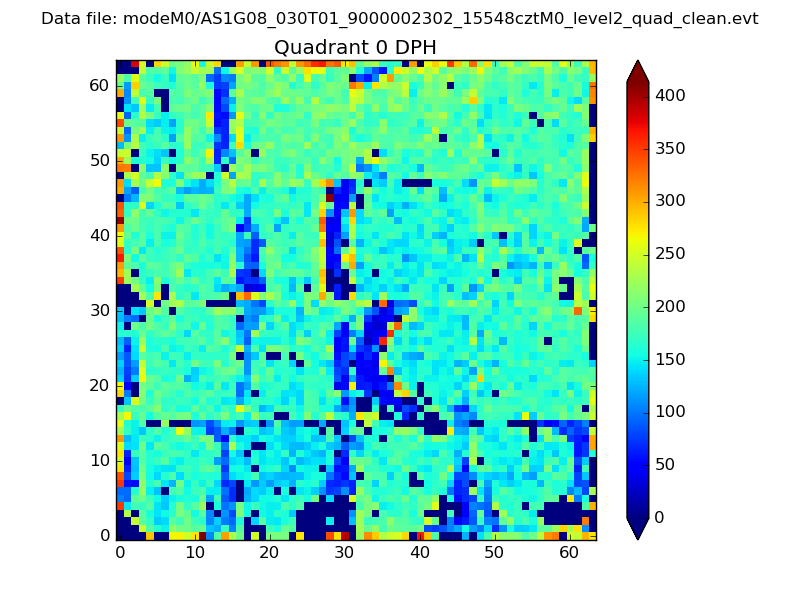 |
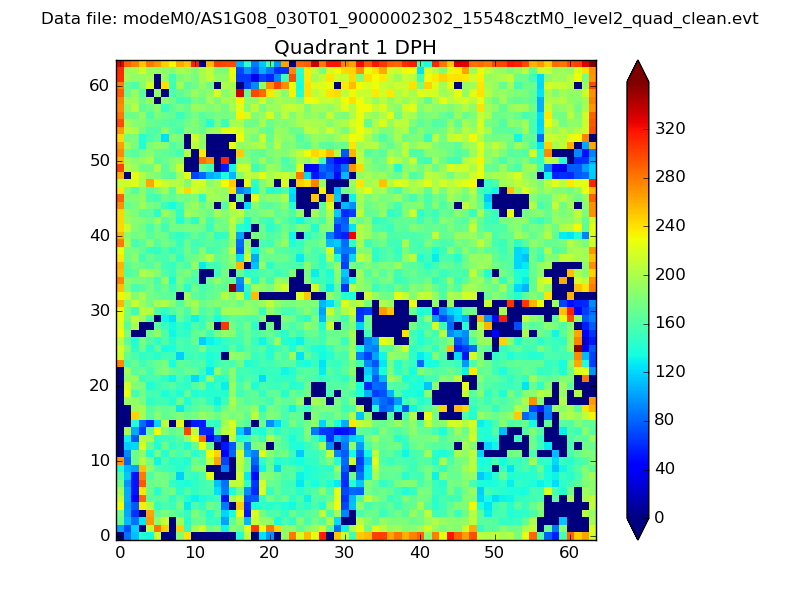 |
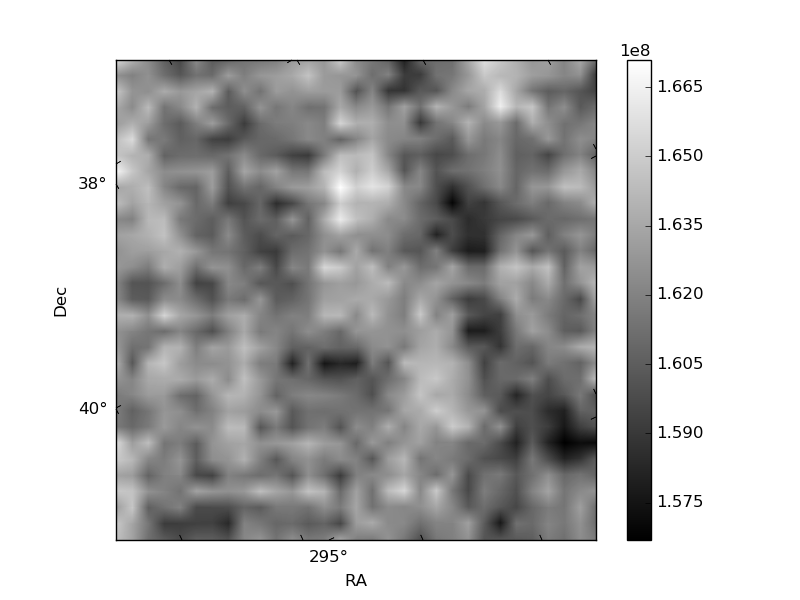
Quadrant B |
|---|---|---|---|
| Quadrant D | 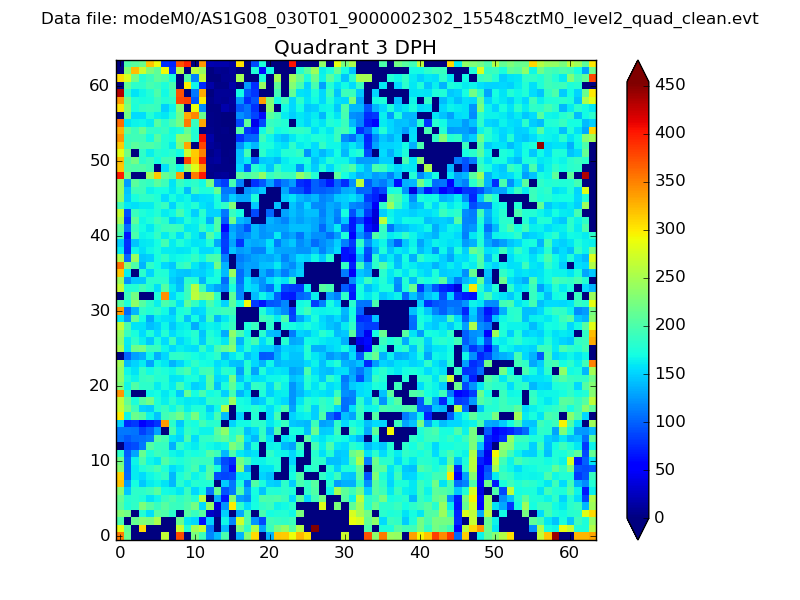 |
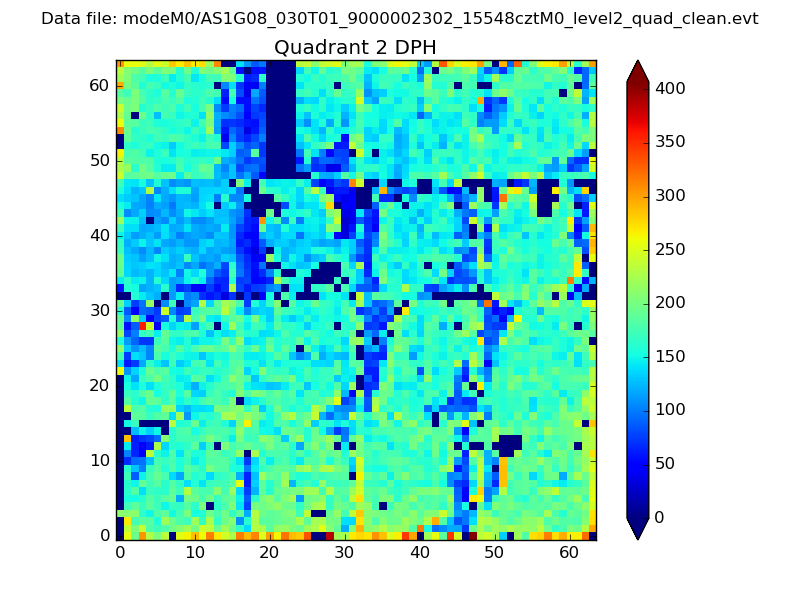 |
Quadrant C |
| Plot type | Count rate plots | Images |
|---|---|---|
| Comparison with Poisson distribution Blue bars denote a histogram of data divided into 1 sec bins. Red curve is a Poisson curve with rate = median count rate of data. |
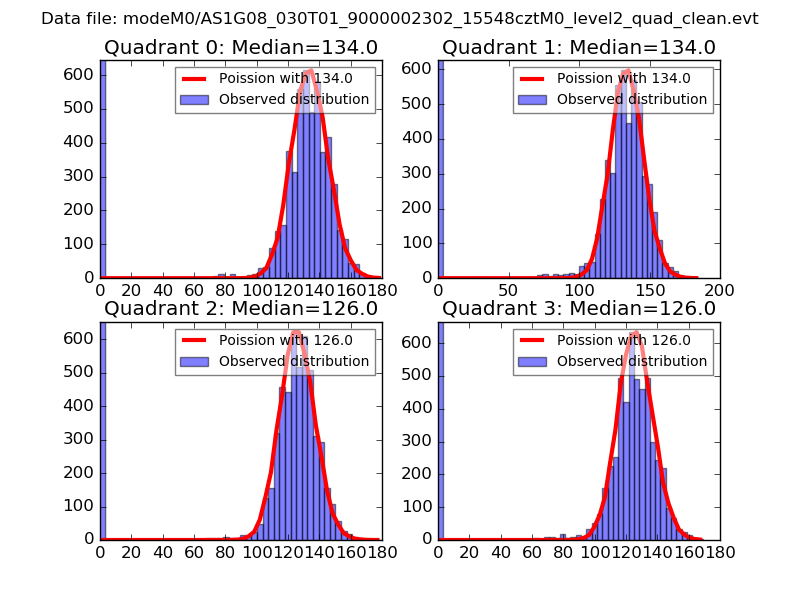 |
 |
| Quadrant-wise count rates Data is divided into 100 sec bins |
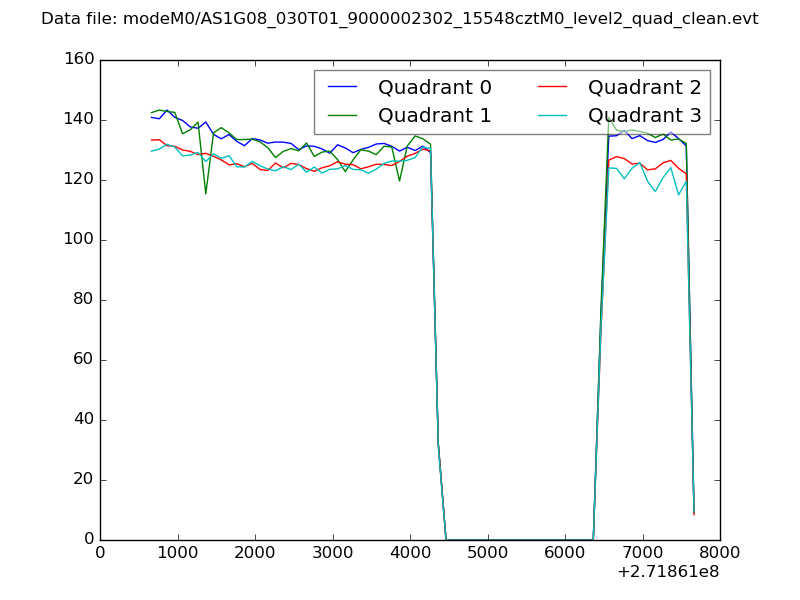 |
|
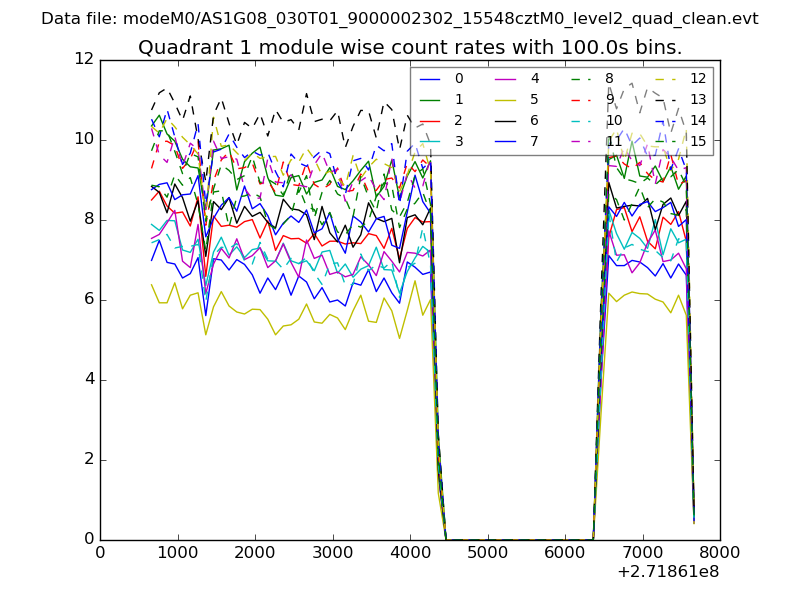
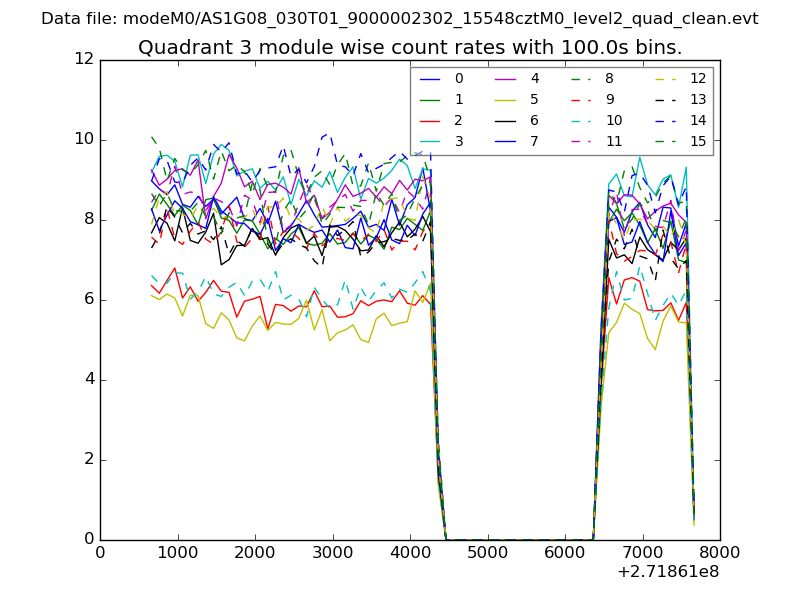
| Module-wise count rates for Quadrant A Data is divided into 100 sec bins |
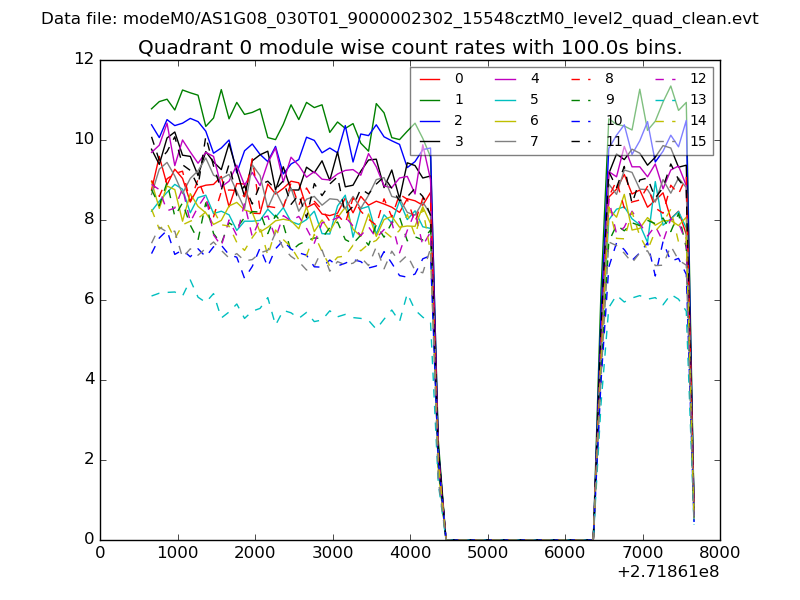 |
 |
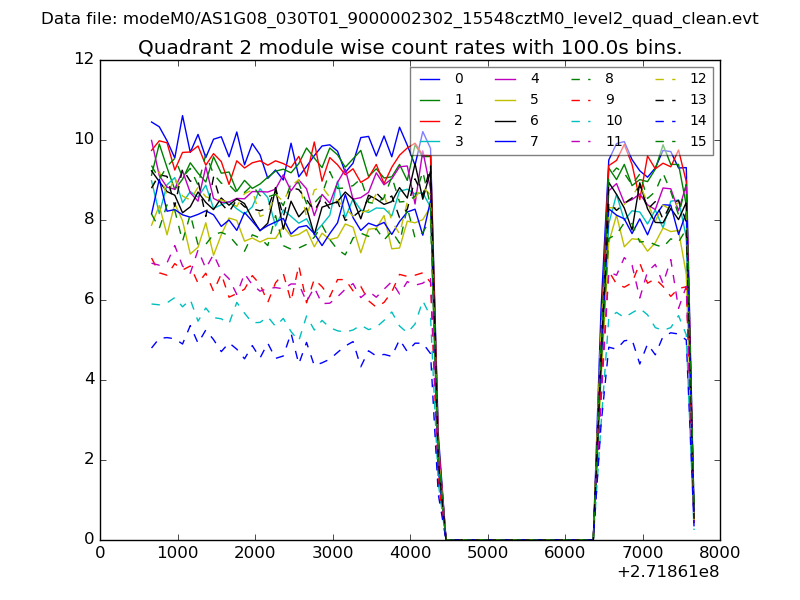
| Module-wise count rates for Quadrant B Data is divided into 100 sec bins |
 |
 |
| Module-wise count rates for Quadrant C Data is divided into 100 sec bins |
 |
 |
| Module-wise count rates for Quadrant D Data is divided into 100 sec bins |
 |
 |
| Parameter | Plot |
|---|---|
| CZT HV Monitor | 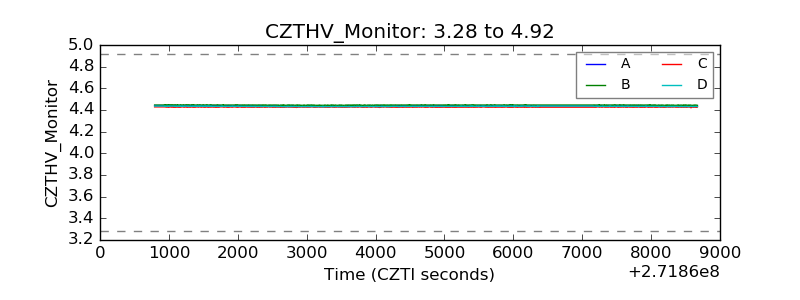 |
| D_VDD | 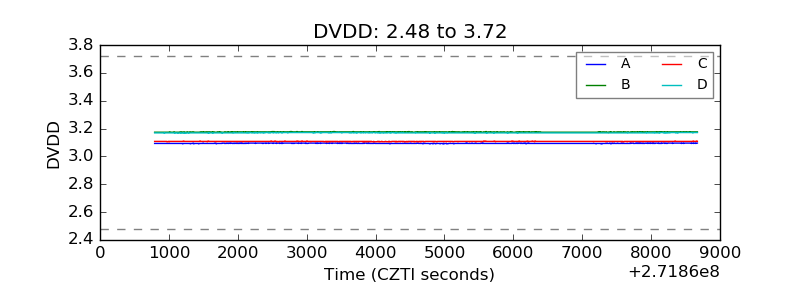 |
| Temperature 1 | 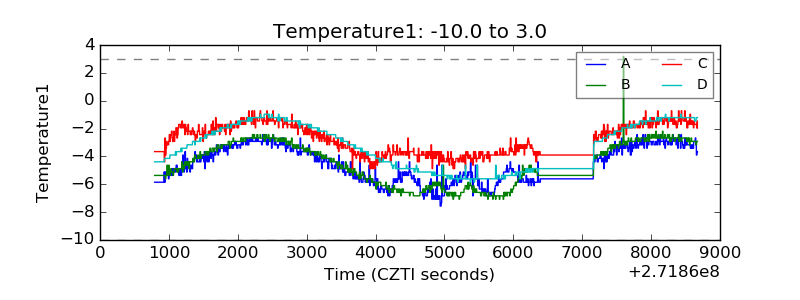 |
| Veto HV Monitor | 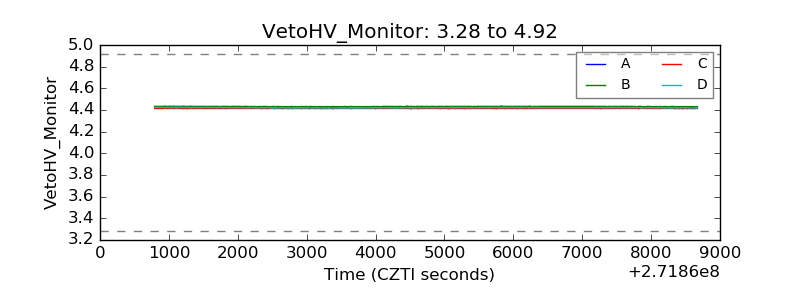 |
| Veto LLD | 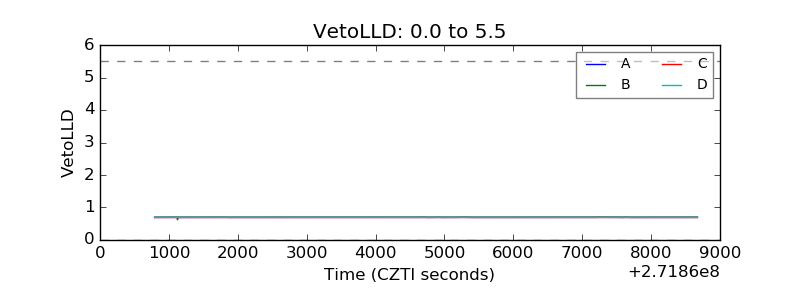 |
| Alpha Counter | 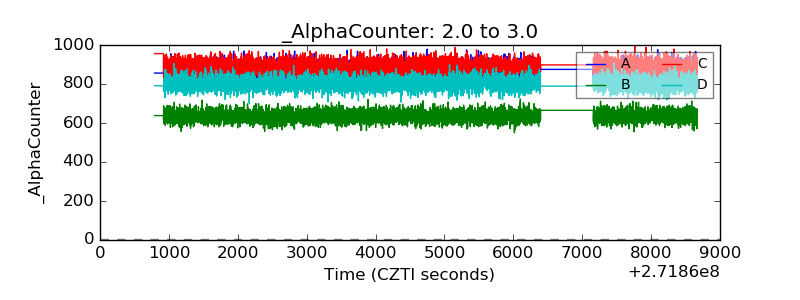 |
| _CPM_Rate | 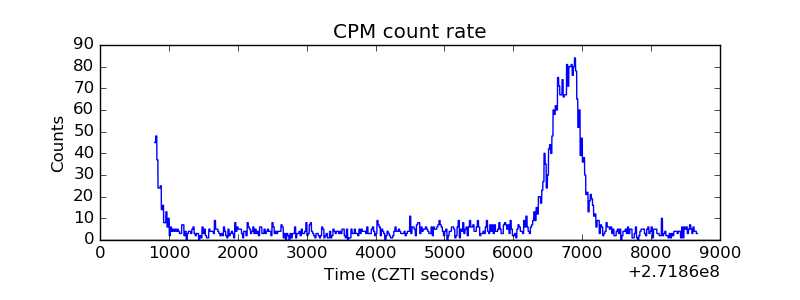 |
| CZT Counter | 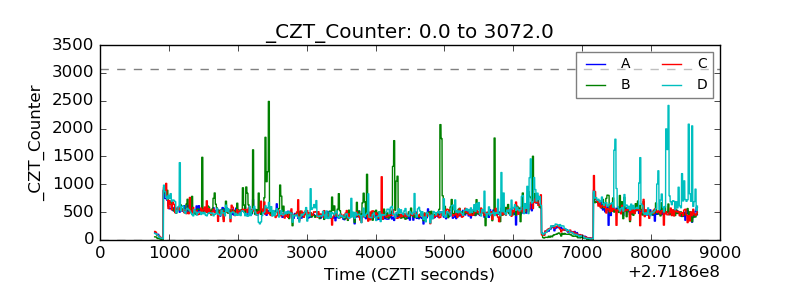 |
| +2.5 Volts monitor |  |
| +5 Volts monitor |  |
| _ROLL_ROT | 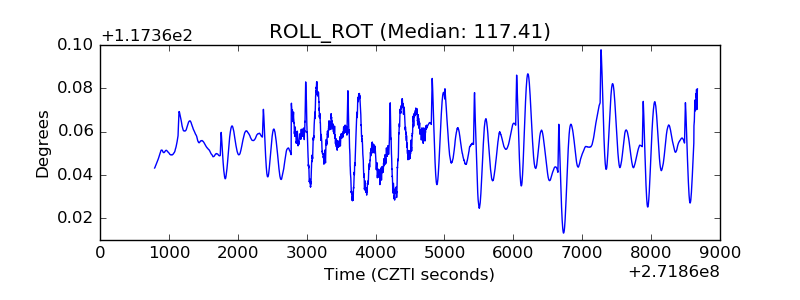 |
| _Roll_DEC | 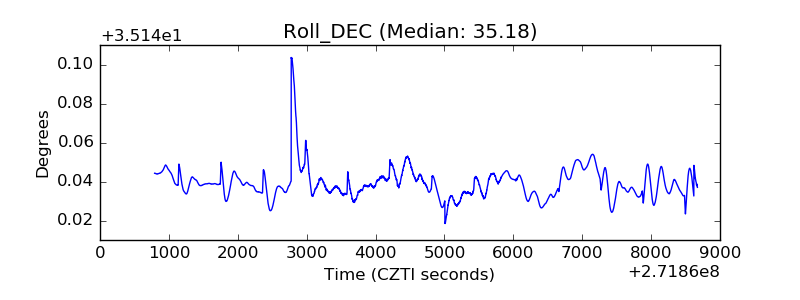 |
| _Roll_RA | 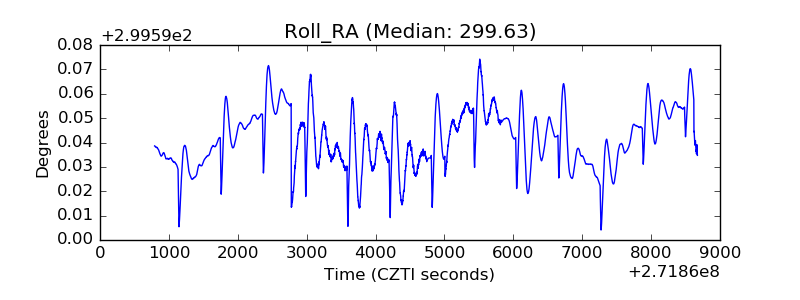 |
| Veto Counter | 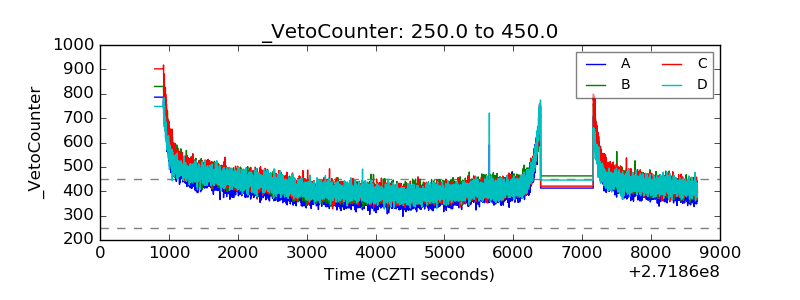 |