| Param | Original file | Final file |
|---|---|---|
| Filename | modeM0/AS1G08_030T01_9000002302_15549cztM0_level2.evt | modeM0/AS1G08_030T01_9000002302_15549cztM0_level2_quad_clean.evt |
| Size (bytes) | 530,354,880 | 99,253,440 |
| Size | 505.8 MB | 94.7 MB |
| Events in quadrant A | 3,292,157 | 660,314 |
| Events in quadrant B | 4,280,062 | 644,700 |
| Events in quadrant C | 3,398,401 | 622,779 |
| Events in quadrant D | 4,625,437 | 599,657 |
| Mode SS | |||
|---|---|---|---|
| Quadrant | BADHDUFLAG | Total packets | Discarded packets |
| A | 0 | 138 | 0 |
| B | 0 | 138 | 0 |
| C | 0 | 138 | 0 |
| D | 0 | 138 | 0 |
| Mode M0 | |||
|---|---|---|---|
| Quadrant | BADHDUFLAG | Total packets | Discarded packets |
| A | 0 | 14264 | 2 |
| B | 0 | 16967 | 1 |
| C | 0 | 14467 | 1 |
| D | 0 | 18455 | 1 |
| Mode M9 | |||
|---|---|---|---|
| Quadrant | BADHDUFLAG | Total packets | Discarded packets |
| A | 0 | 3 | 0 |
| B | 0 | 3 | 0 |
| C | 0 | 3 | 0 |
| D | 0 | 3 | 0 |
| Quadrant | Total seconds | Saturated seconds | Saturation percentage |
|---|---|---|---|
| A | 6864 | 117 | 1.704545% |
| B | 6864 | 368 | 5.361305% |
| C | 6864 | 169 | 2.462121% |
| D | 6864 | 423 | 6.162587% |
Noise dominated data is calculated using 1-second bins in cleaned event files. If a bin has >2000 counts, and if more than 50% of those come from <1% of pixels, then it is considered to be noise-dominated and hence unusable.
| Quadrant | # 1 sec bins | Bins with >0 counts | Bins with >2000 counts | High rate bins dominated by noise | Noise dominated (total time) | Noise dominated (detector-on time) | Marked lightcurve |
|---|---|---|---|---|---|---|---|
| A | 7175 | 6866 | 0 | 0 | 0.00% | 0.00% | 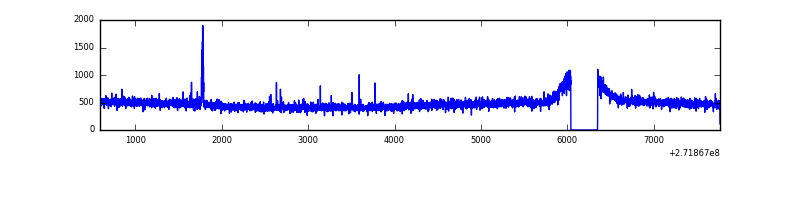 |
| B | 7175 | 6866 | 228 | 228 | 3.18% | 3.32% | 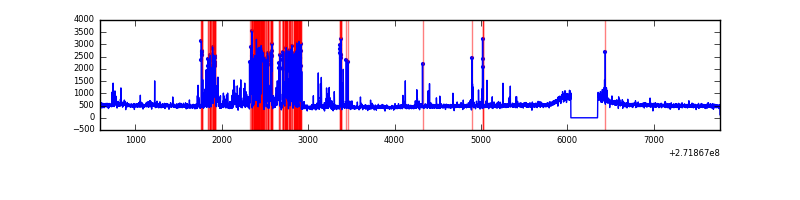 |
| C | 7175 | 6865 | 18 | 18 | 0.25% | 0.26% | 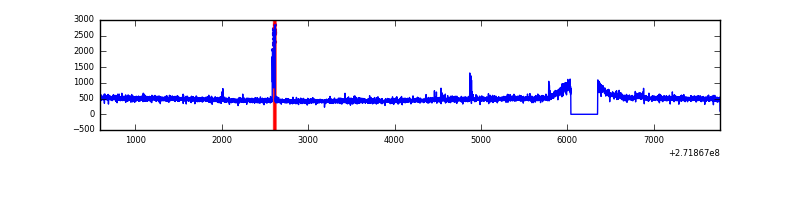 |
| D | 7175 | 6866 | 262 | 262 | 3.65% | 3.82% | 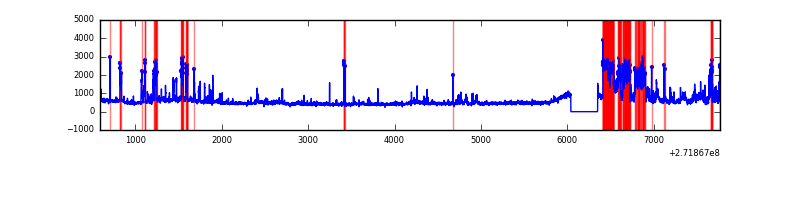 |
Top three noisy pixels from each quadrant. If the there are fewer than three noisy pixels in the level2.evt file, extra rows are filled as -1
| Pixel properties | Quadrant properties | ||||||
|---|---|---|---|---|---|---|---|
| Quadrant | DetID | PixID | Counts | Sigma | Mean | Median | Sigma |
| A | 9 | 143 | 27011 | 153.05 | 848 | 830 | 171.1 |
| A | 0 | 226 | 7656 | 39.9 | 848 | 830 | 171.1 |
| A | 12 | 194 | 6313 | 32.05 | 848 | 830 | 171.1 |
| B | 3 | 64 | 965184 | 6041.91 | 832 | 810 | 159.6 |
| B | 4 | 48 | 19075 | 114.43 | 832 | 810 | 159.6 |
| B | 12 | 111 | 18877 | 113.19 | 832 | 810 | 159.6 |
| C | 14 | 238 | 125518 | 656.17 | 810 | 814 | 190.0 |
| C | 10 | 22 | 57642 | 299.02 | 810 | 814 | 190.0 |
| C | 3 | 233 | 31297 | 160.4 | 810 | 814 | 190.0 |
| D | 1 | 52 | 1335117 | 6344.14 | 805 | 786 | 210.3 |
| D | 5 | 222 | 165167 | 781.56 | 805 | 786 | 210.3 |
| D | 2 | 234 | 29342 | 135.77 | 805 | 786 | 210.3 |
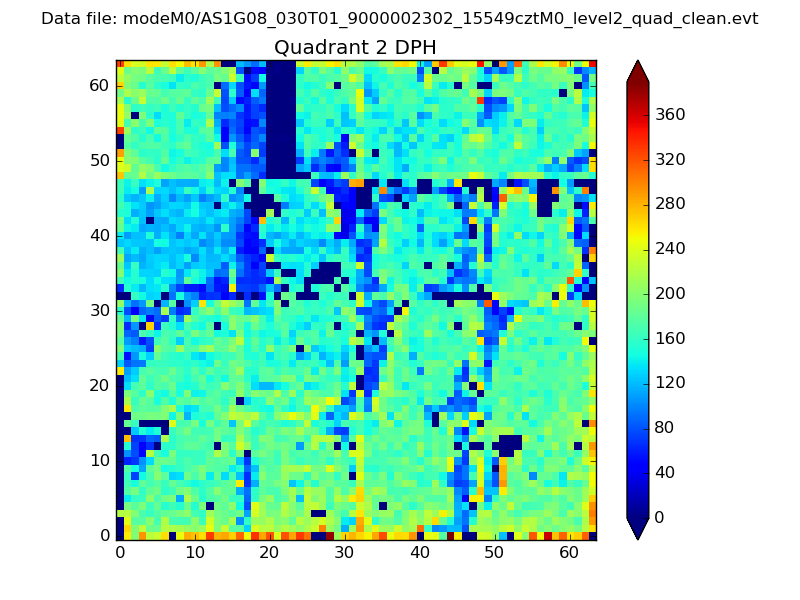
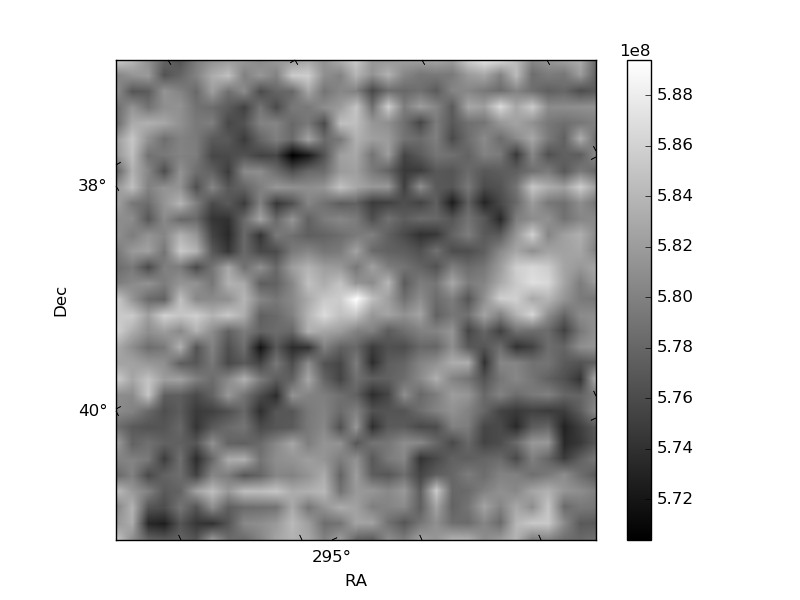
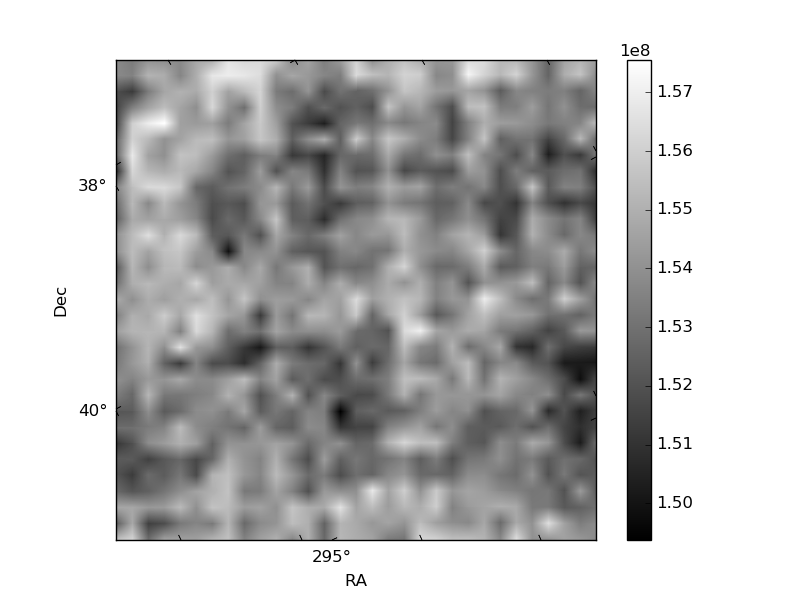
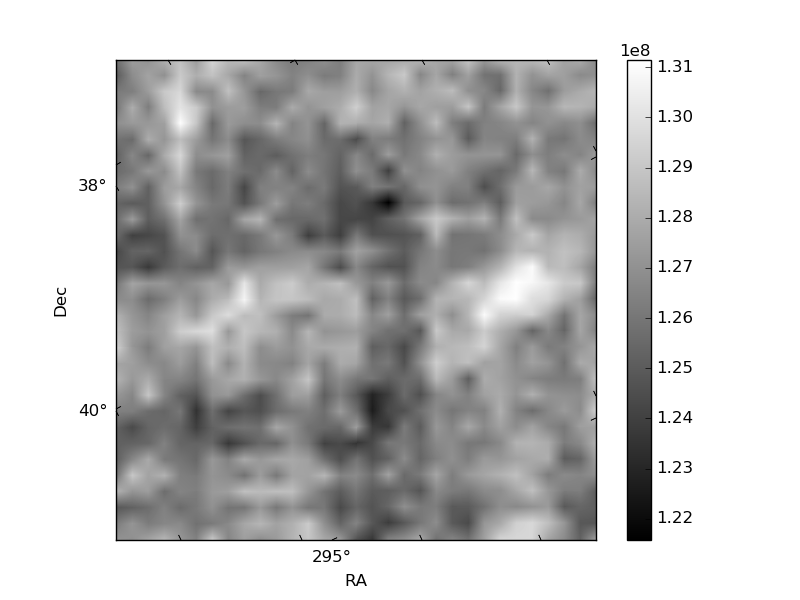
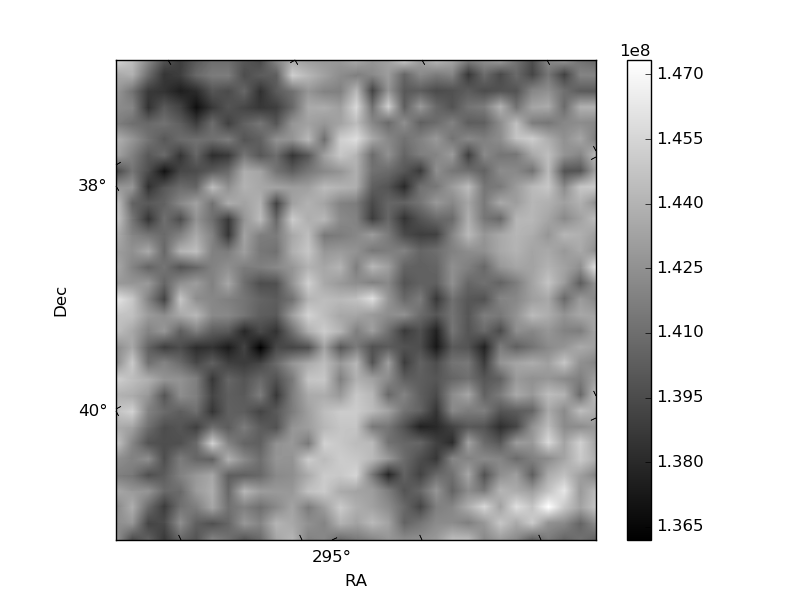
Histogram calculated using DETX and DETY for each event in the final _common_clean file
| Quadrant A | 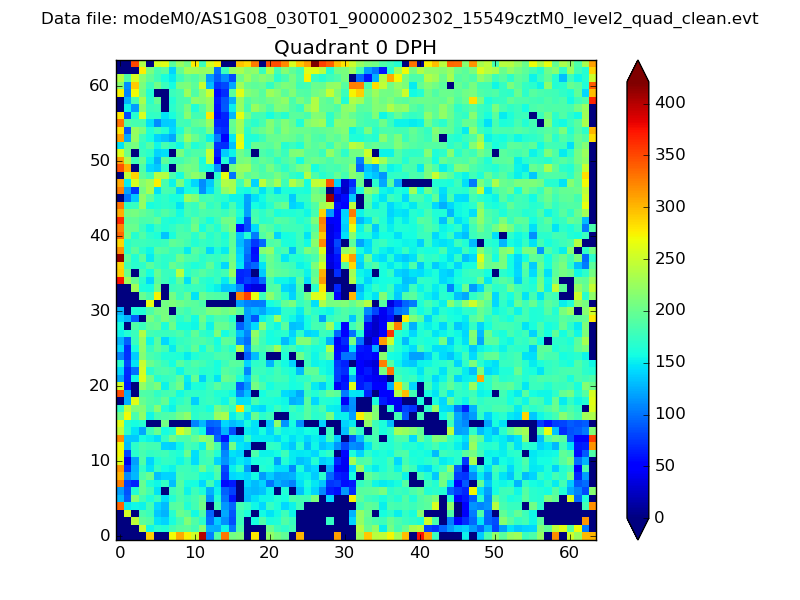 |
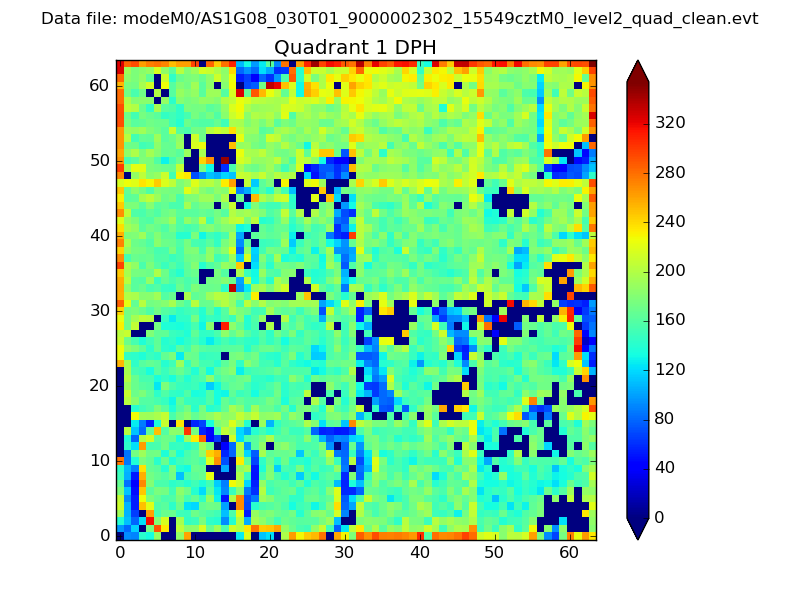 |
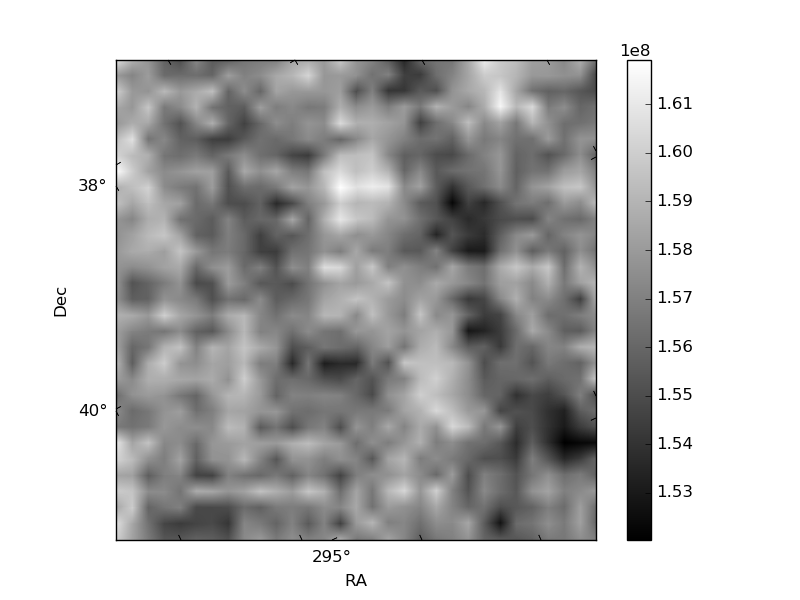
Quadrant B |
|---|---|---|---|
| Quadrant D | 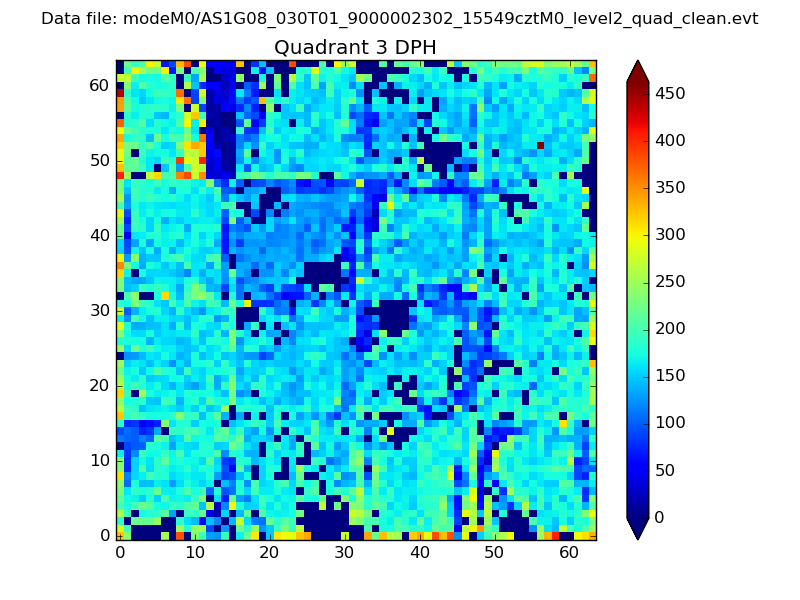 |
 |
Quadrant C |
| Plot type | Count rate plots | Images |
|---|---|---|
| Comparison with Poisson distribution Blue bars denote a histogram of data divided into 1 sec bins. Red curve is a Poisson curve with rate = median count rate of data. |
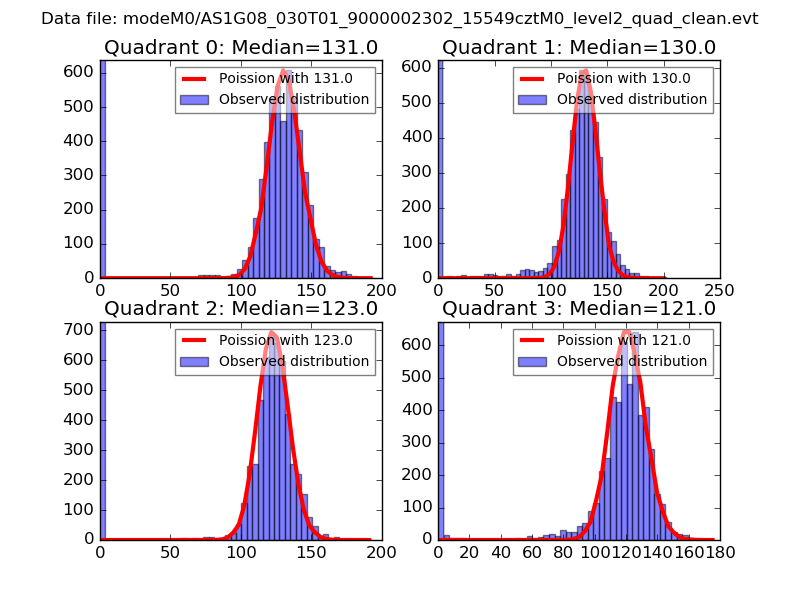 |
 |
| Quadrant-wise count rates Data is divided into 100 sec bins |
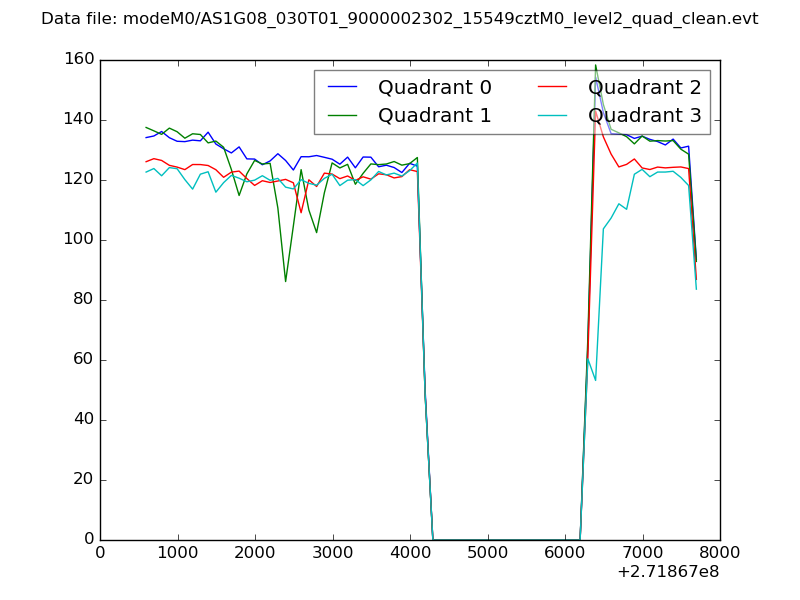 |
|
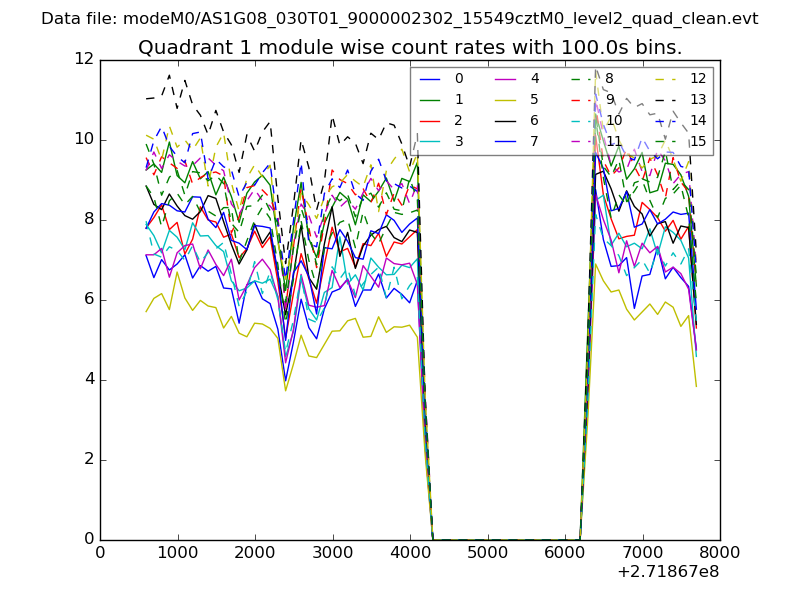
| Module-wise count rates for Quadrant A Data is divided into 100 sec bins |
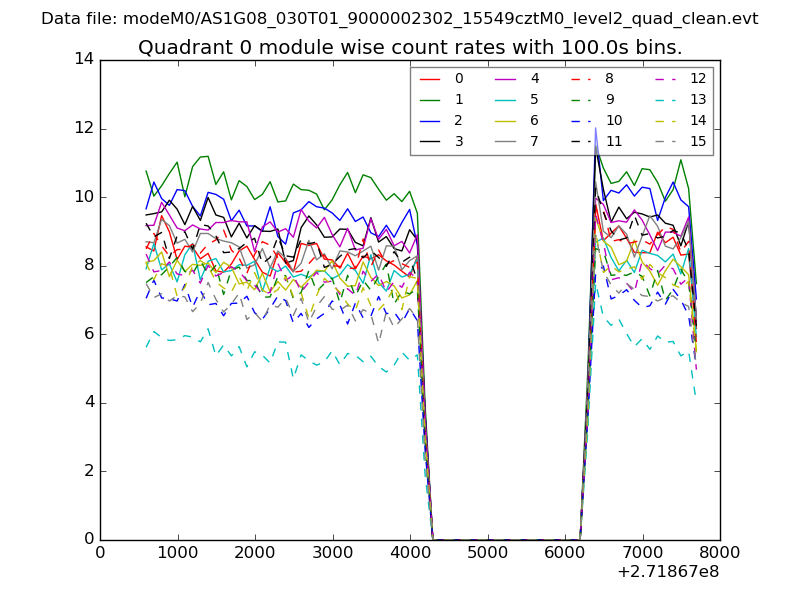 |
 |
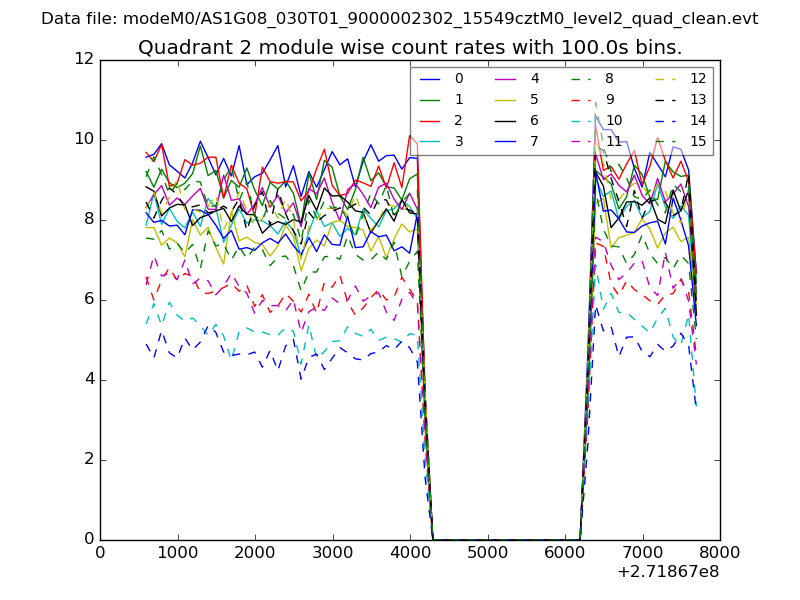
| Module-wise count rates for Quadrant B Data is divided into 100 sec bins |
 |
 |
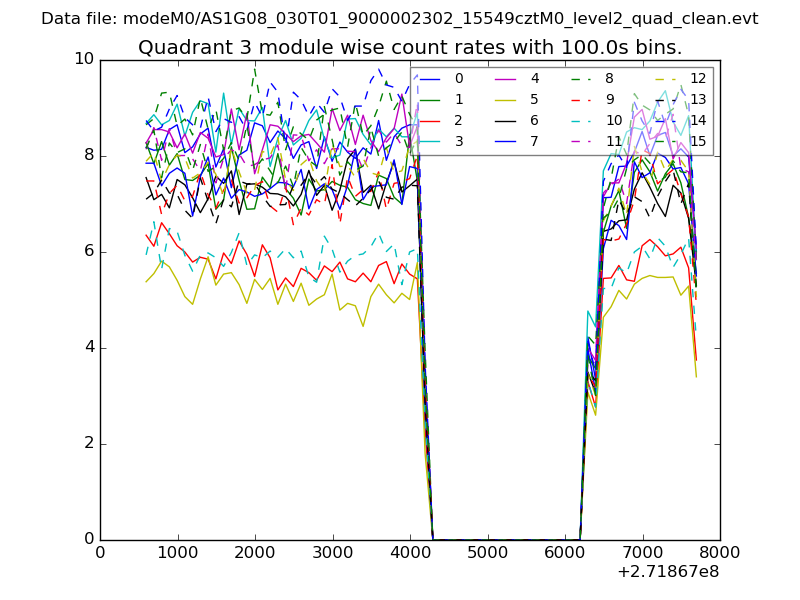
| Module-wise count rates for Quadrant C Data is divided into 100 sec bins |
 |
 |
| Module-wise count rates for Quadrant D Data is divided into 100 sec bins |
 |
 |
| Parameter | Plot |
|---|---|
| CZT HV Monitor | 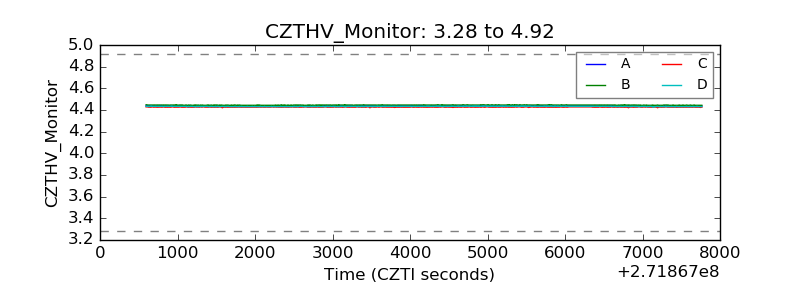 |
| D_VDD | 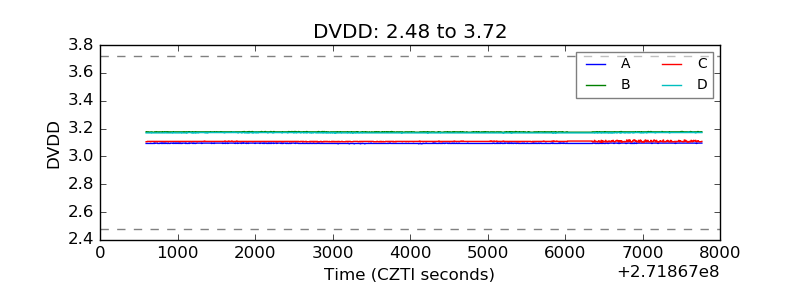 |
| Temperature 1 | 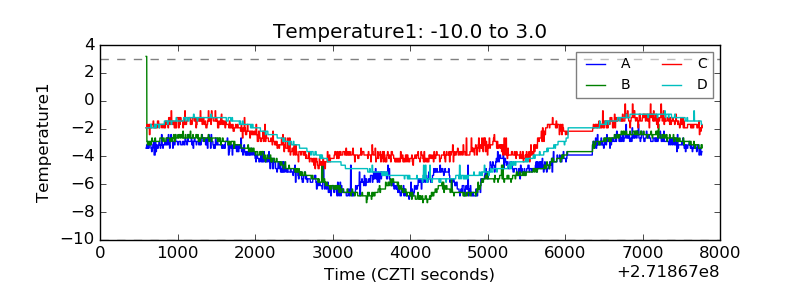 |
| Veto HV Monitor | 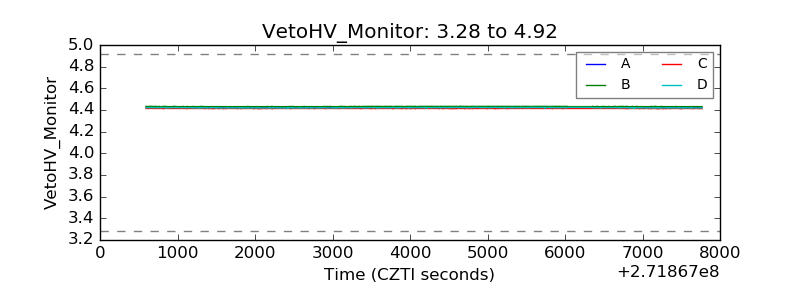 |
| Veto LLD | 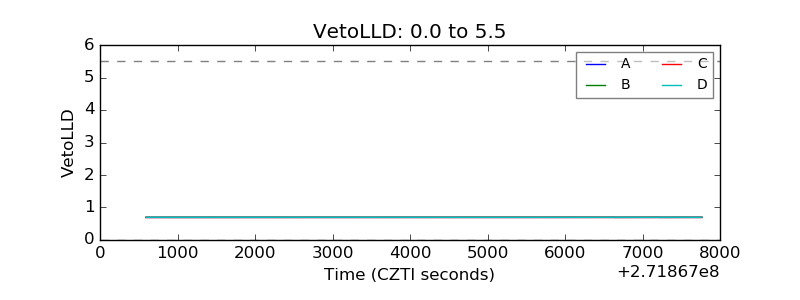 |
| Alpha Counter |  |
| _CPM_Rate | 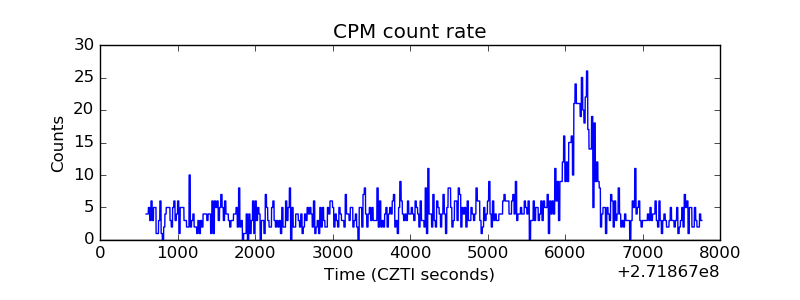 |
| CZT Counter | 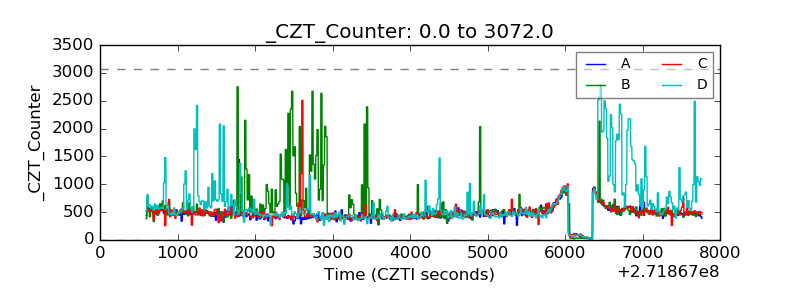 |
| +2.5 Volts monitor |  |
| +5 Volts monitor |  |
| _ROLL_ROT | 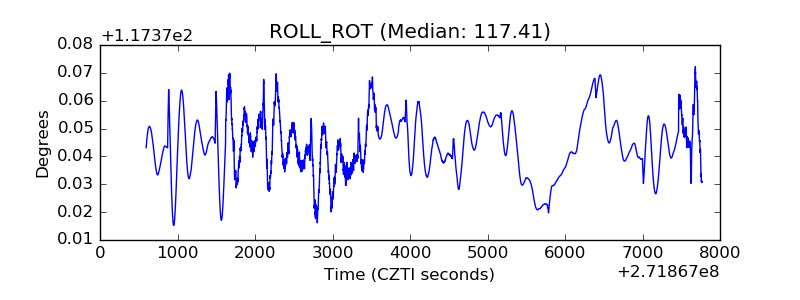 |
| _Roll_DEC | 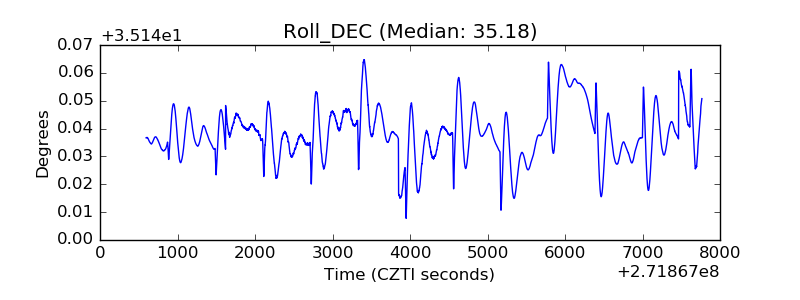 |
| _Roll_RA |  |
| Veto Counter | 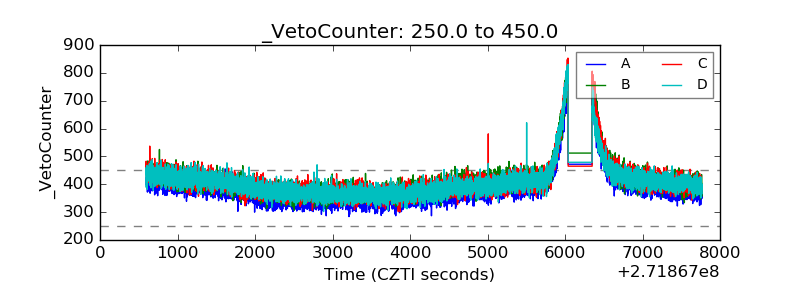 |