| Param | Original file | Final file |
|---|---|---|
| Filename | modeM0/AS1G08_030T01_9000002302_15550cztM0_level2.evt | modeM0/AS1G08_030T01_9000002302_15550cztM0_level2_quad_clean.evt |
| Size (bytes) | 537,900,480 | 106,323,840 |
| Size | 513.0 MB | 101.4 MB |
| Events in quadrant A | 3,576,472 | 695,796 |
| Events in quadrant B | 3,804,583 | 698,475 |
| Events in quadrant C | 3,678,939 | 660,922 |
| Events in quadrant D | 4,722,041 | 643,597 |
| Mode SS | |||
|---|---|---|---|
| Quadrant | BADHDUFLAG | Total packets | Discarded packets |
| A | 0 | 152 | 0 |
| B | 0 | 152 | 0 |
| C | 0 | 152 | 0 |
| D | 0 | 152 | 0 |
| Mode M0 | |||
|---|---|---|---|
| Quadrant | BADHDUFLAG | Total packets | Discarded packets |
| A | 0 | 15617 | 2 |
| B | 0 | 16146 | 1 |
| C | 0 | 15706 | 1 |
| D | 0 | 19273 | 1 |
| Mode M9 | |||
|---|---|---|---|
| Quadrant | BADHDUFLAG | Total packets | Discarded packets |
| A | 0 | 2 | 0 |
| B | 0 | 2 | 0 |
| C | 0 | 2 | 0 |
| D | 0 | 2 | 0 |
| Quadrant | Total seconds | Saturated seconds | Saturation percentage |
|---|---|---|---|
| A | 7490 | 144 | 1.922563% |
| B | 7490 | 179 | 2.389853% |
| C | 7490 | 176 | 2.349800% |
| D | 7490 | 348 | 4.646195% |
Noise dominated data is calculated using 1-second bins in cleaned event files. If a bin has >2000 counts, and if more than 50% of those come from <1% of pixels, then it is considered to be noise-dominated and hence unusable.
| Quadrant | # 1 sec bins | Bins with >0 counts | Bins with >2000 counts | High rate bins dominated by noise | Noise dominated (total time) | Noise dominated (detector-on time) | Marked lightcurve |
|---|---|---|---|---|---|---|---|
| A | 7606 | 7493 | 1 | 1 | 0.01% | 0.01% | 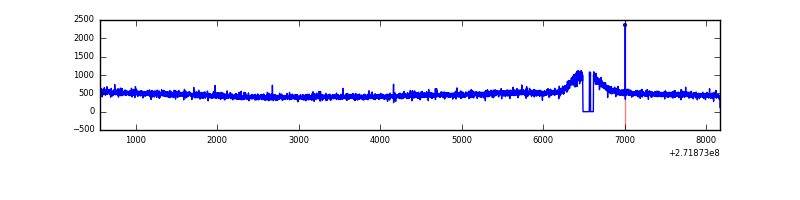 |
| B | 7606 | 7493 | 18 | 18 | 0.24% | 0.24% | 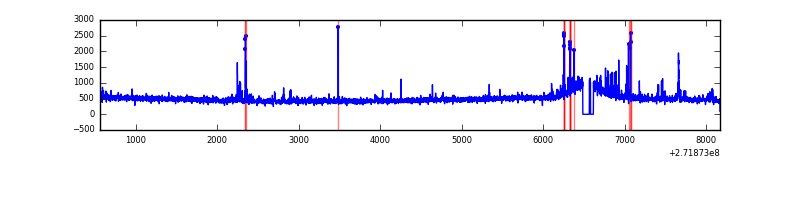 |
| C | 7606 | 7493 | 1 | 1 | 0.01% | 0.01% | 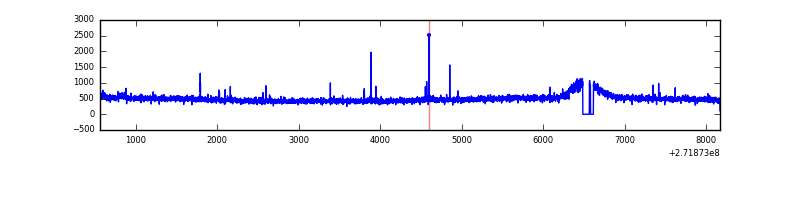 |
| D | 7606 | 7492 | 185 | 185 | 2.43% | 2.47% | 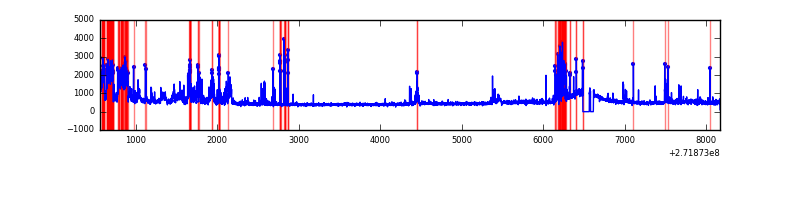 |
Top three noisy pixels from each quadrant. If the there are fewer than three noisy pixels in the level2.evt file, extra rows are filled as -1
| Pixel properties | Quadrant properties | ||||||
|---|---|---|---|---|---|---|---|
| Quadrant | DetID | PixID | Counts | Sigma | Mean | Median | Sigma |
| A | 0 | 226 | 8336 | 39.6 | 929 | 909 | 187.6 |
| A | 12 | 194 | 6745 | 31.12 | 929 | 909 | 187.6 |
| A | 3 | 137 | 6351 | 29.02 | 929 | 909 | 187.6 |
| B | 3 | 64 | 100905 | 558.1 | 923 | 897 | 179.2 |
| B | 0 | 189 | 42733 | 233.47 | 923 | 897 | 179.2 |
| B | 12 | 111 | 21340 | 114.08 | 923 | 897 | 179.2 |
| C | 14 | 238 | 137743 | 653.84 | 888 | 892 | 209.3 |
| C | 3 | 233 | 26532 | 122.5 | 888 | 892 | 209.3 |
| C | 0 | 207 | 12646 | 56.16 | 888 | 892 | 209.3 |
| D | 1 | 52 | 847549 | 3548.18 | 890 | 868 | 238.6 |
| D | 5 | 222 | 265686 | 1109.77 | 890 | 868 | 238.6 |
| D | 13 | 172 | 87328 | 362.33 | 890 | 868 | 238.6 |
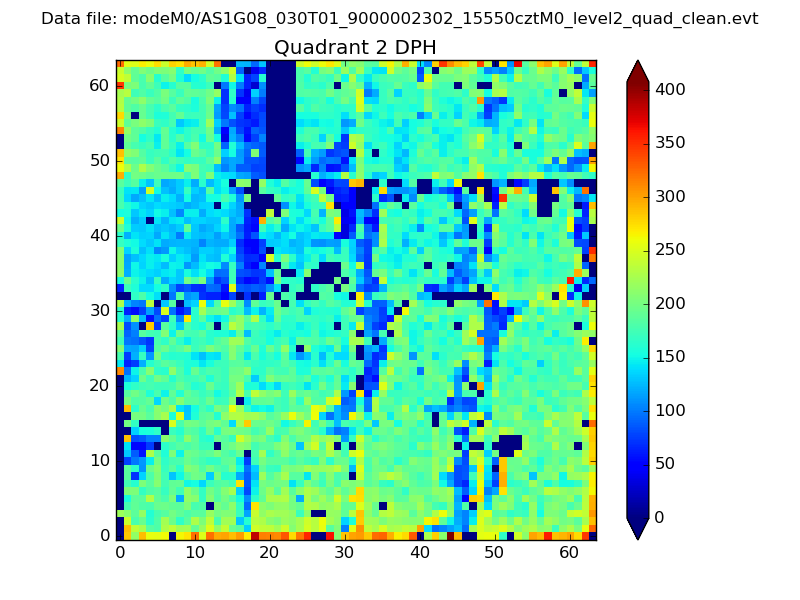
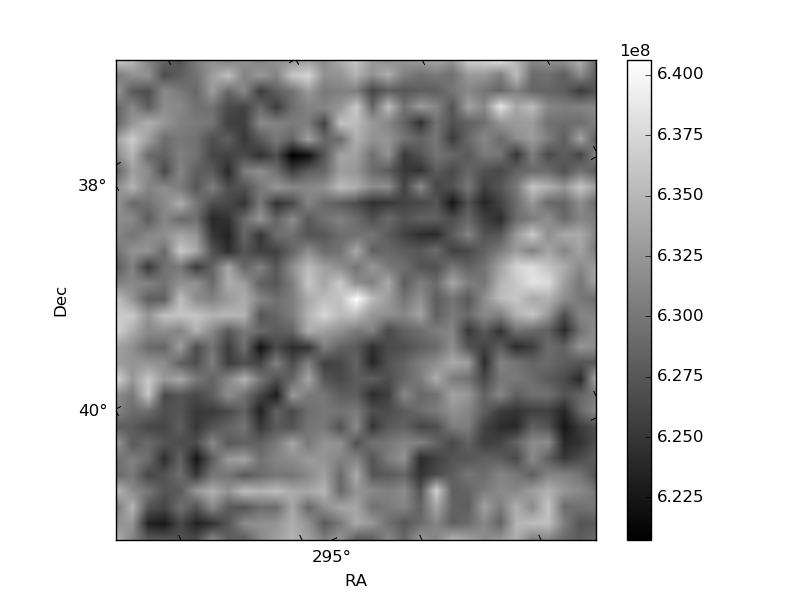
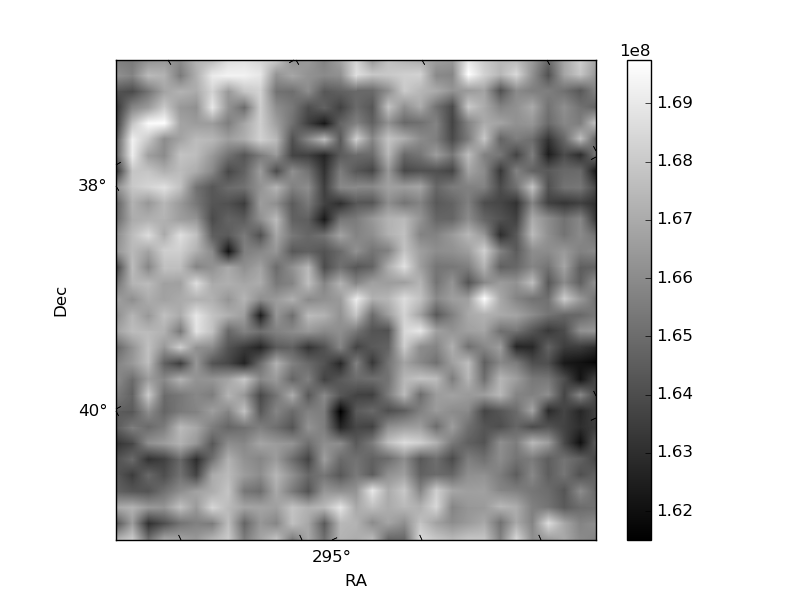
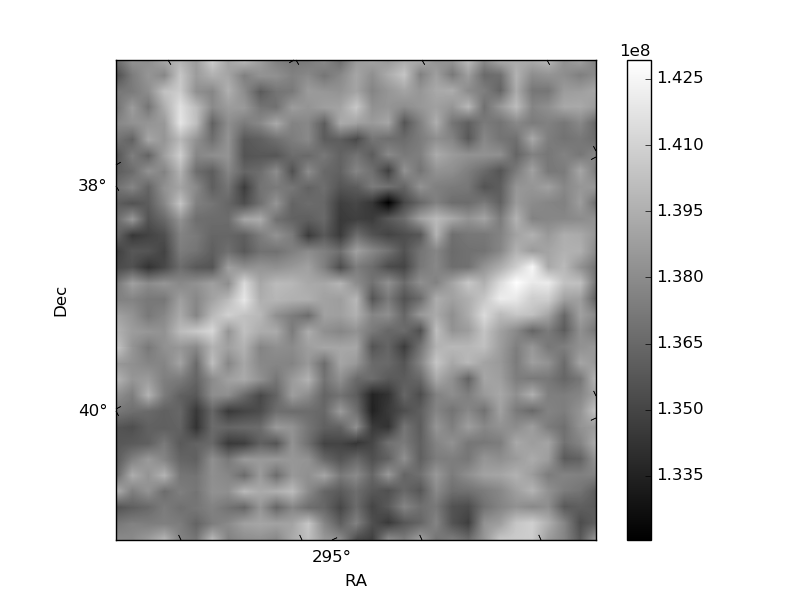
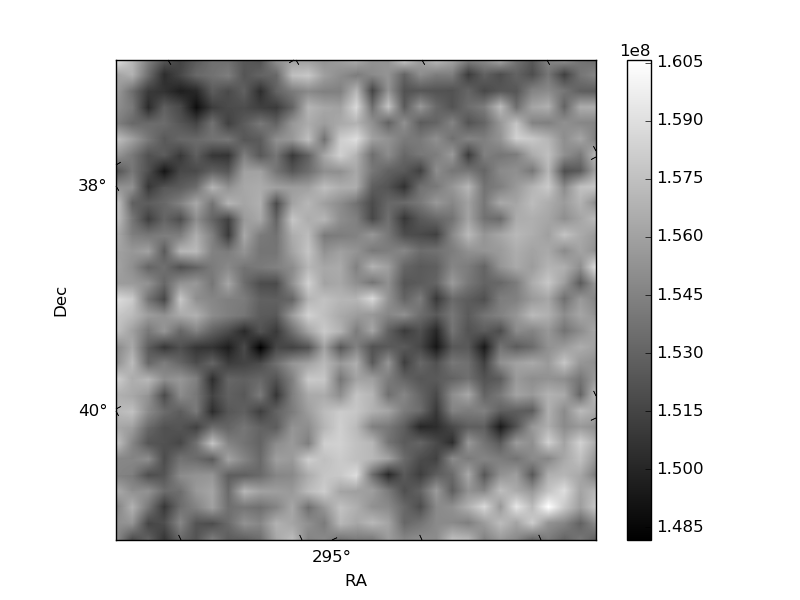
Histogram calculated using DETX and DETY for each event in the final _common_clean file
| Quadrant A | 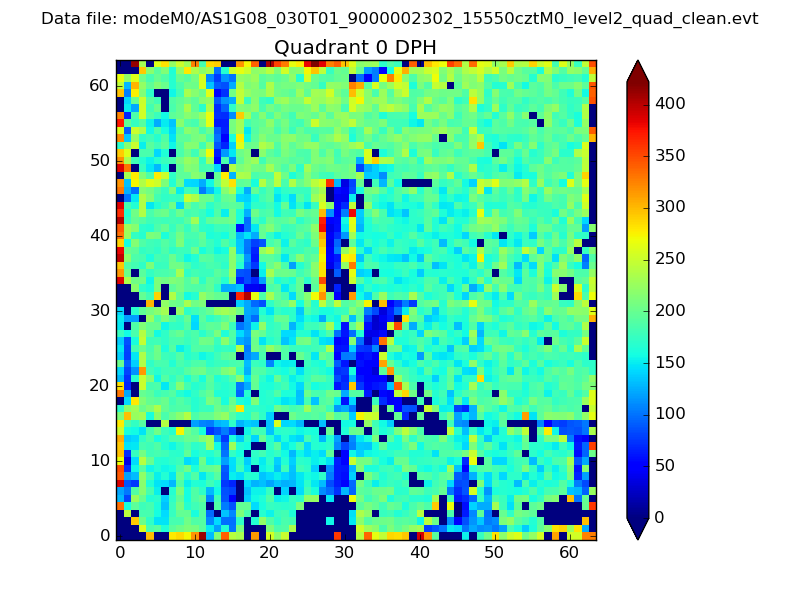 |
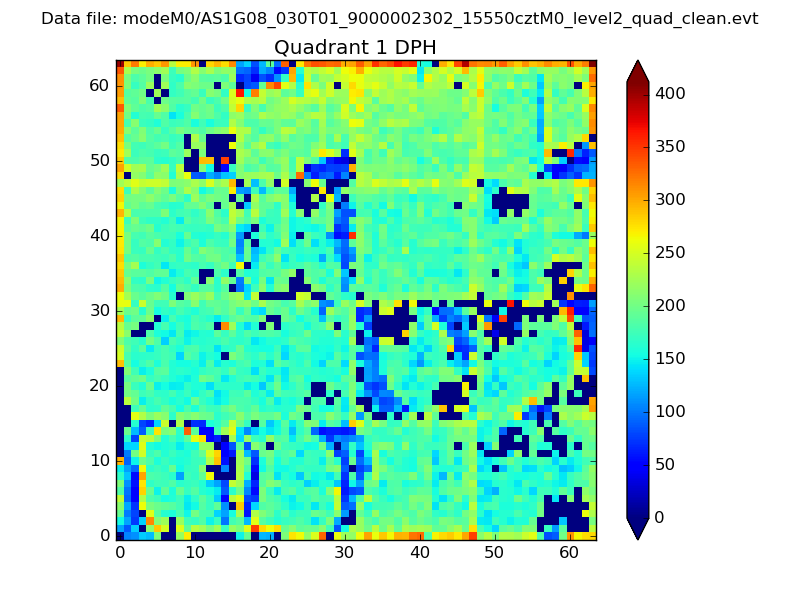 |
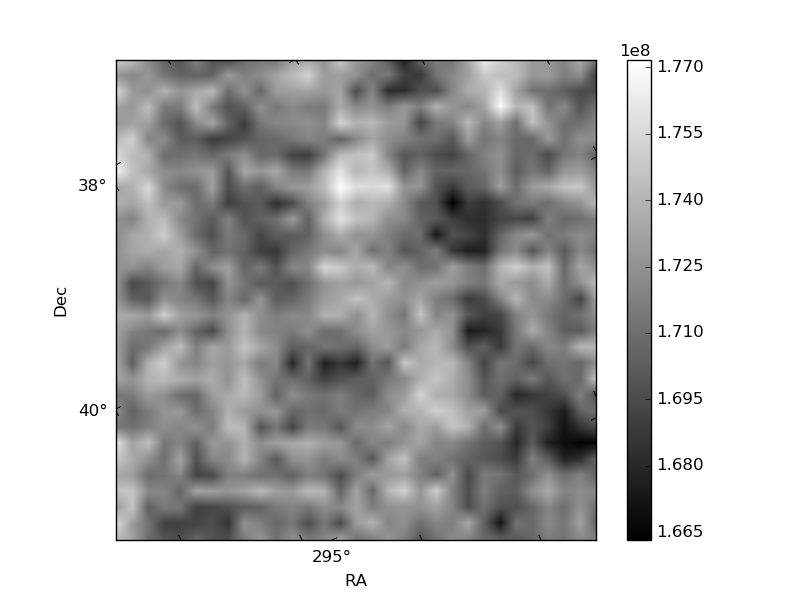
Quadrant B |
|---|---|---|---|
| Quadrant D | 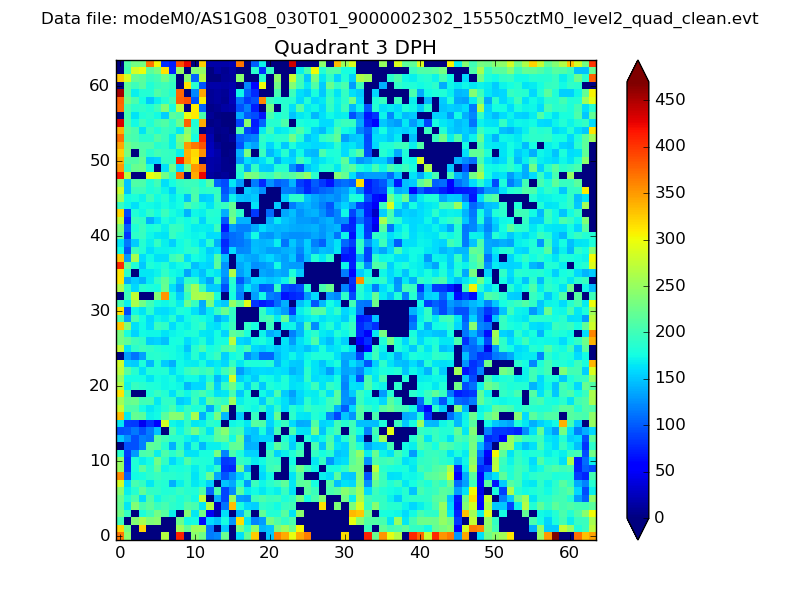 |
 |
Quadrant C |
| Plot type | Count rate plots | Images |
|---|---|---|
| Comparison with Poisson distribution Blue bars denote a histogram of data divided into 1 sec bins. Red curve is a Poisson curve with rate = median count rate of data. |
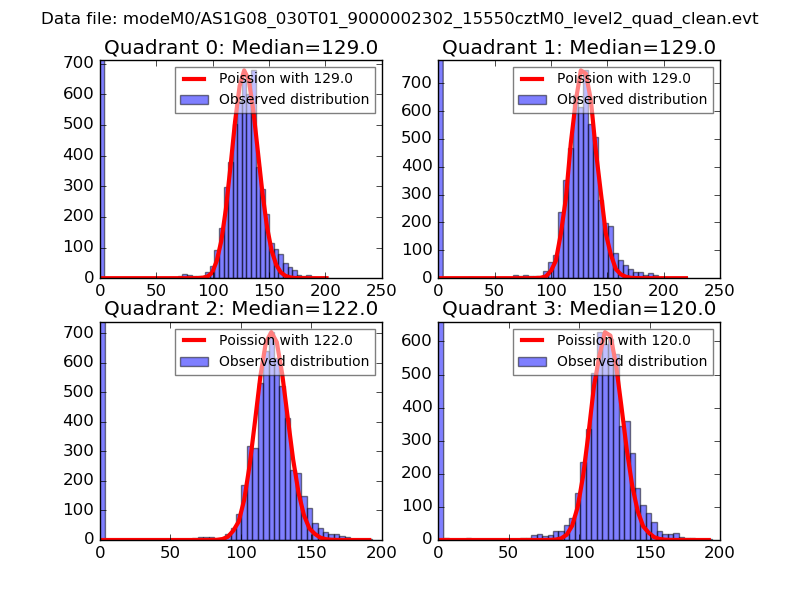 |
 |
| Quadrant-wise count rates Data is divided into 100 sec bins |
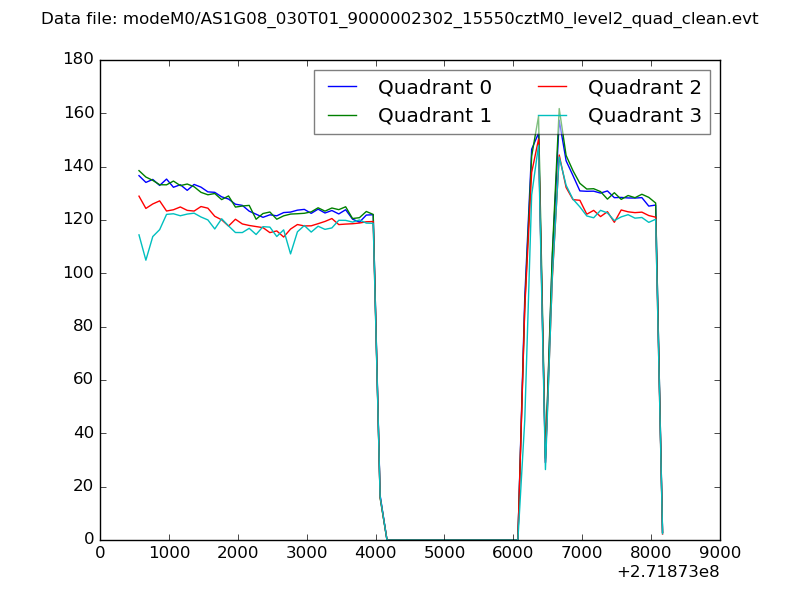 |
|
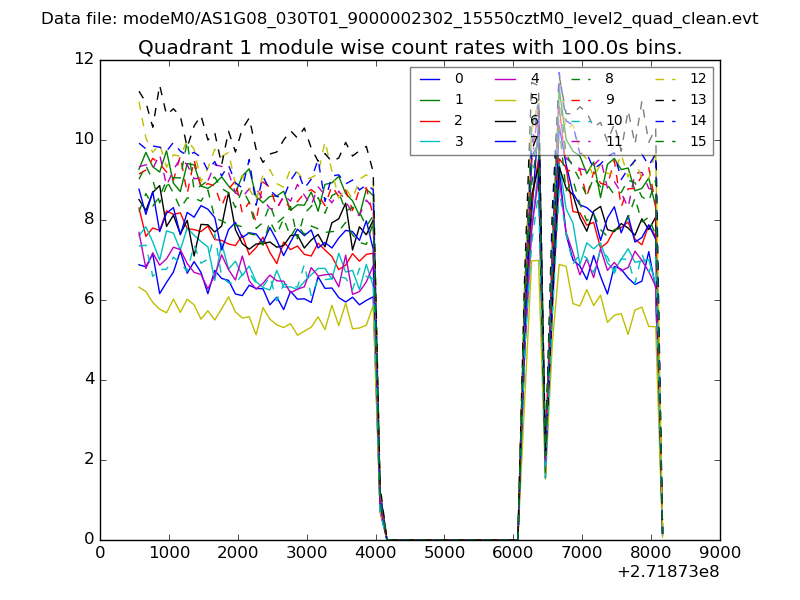
| Module-wise count rates for Quadrant A Data is divided into 100 sec bins |
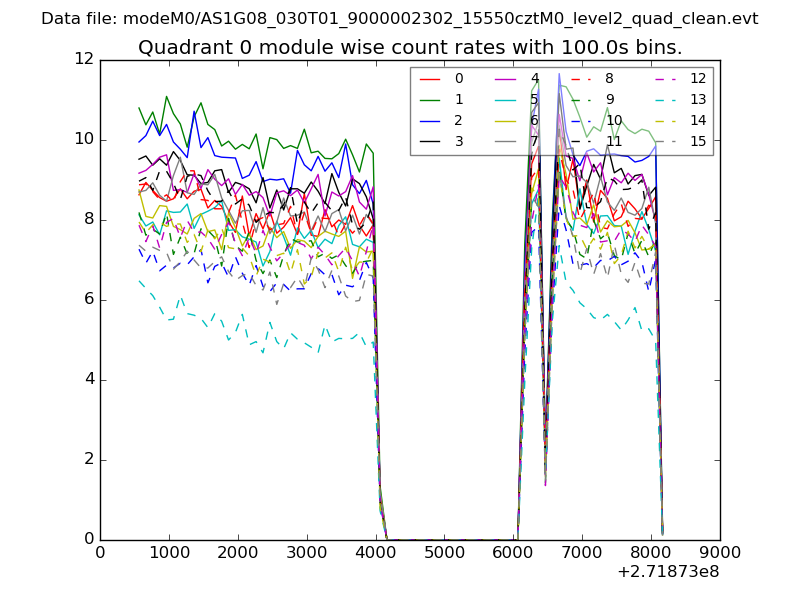 |
 |
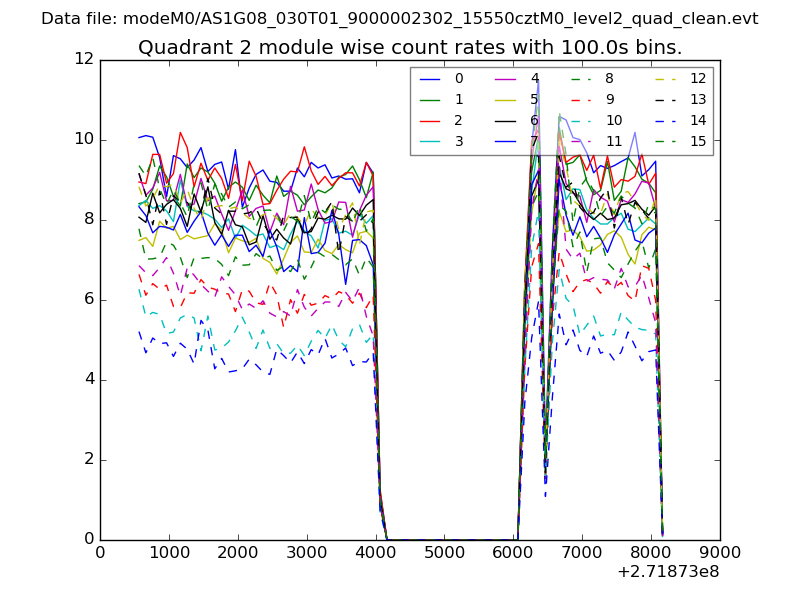
| Module-wise count rates for Quadrant B Data is divided into 100 sec bins |
 |
 |
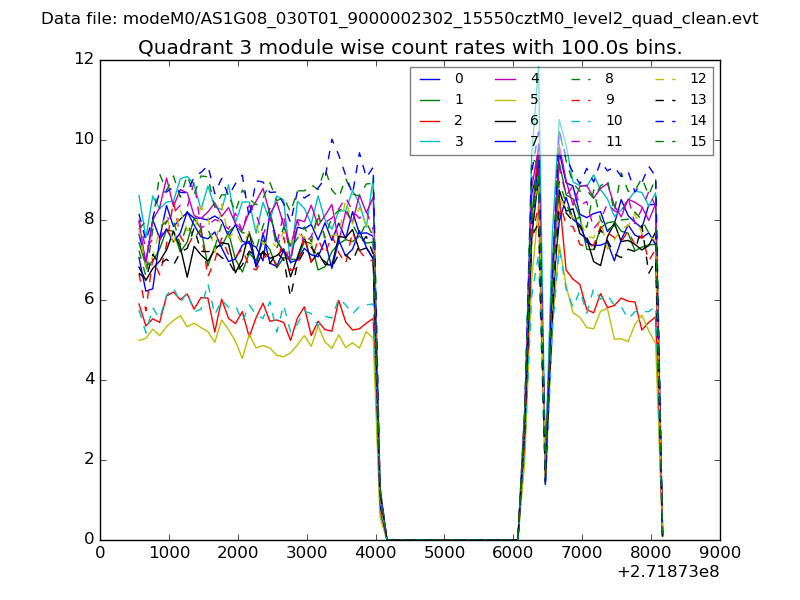
| Module-wise count rates for Quadrant C Data is divided into 100 sec bins |
 |
 |
| Module-wise count rates for Quadrant D Data is divided into 100 sec bins |
 |
 |
| Parameter | Plot |
|---|---|
| CZT HV Monitor | 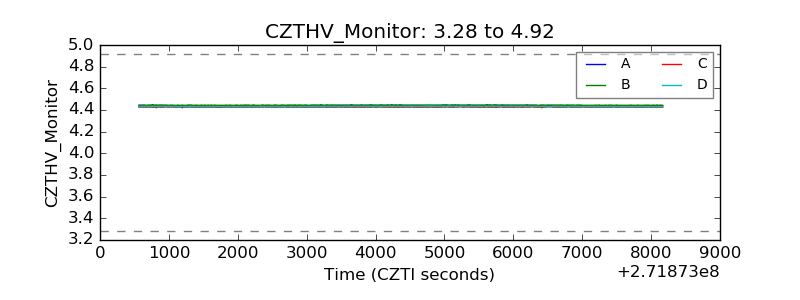 |
| D_VDD | 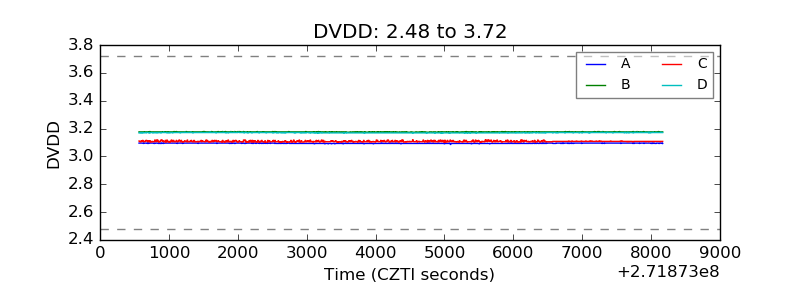 |
| Temperature 1 | 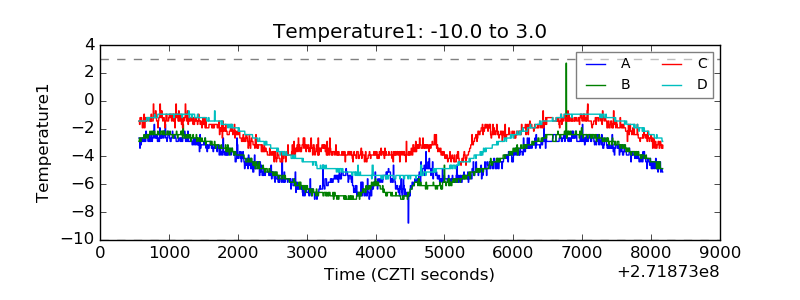 |
| Veto HV Monitor | 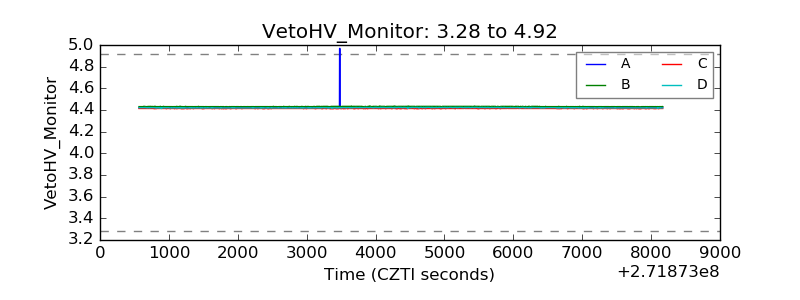 |
| Veto LLD | 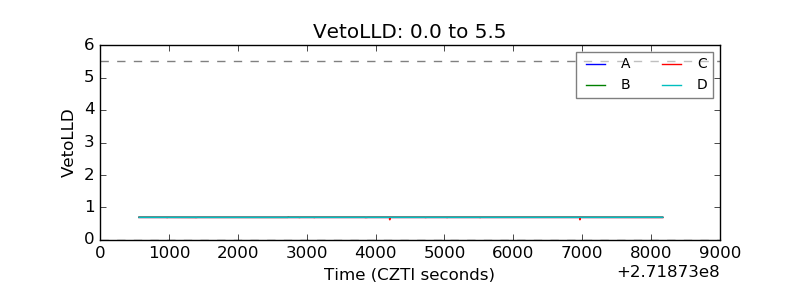 |
| Alpha Counter | 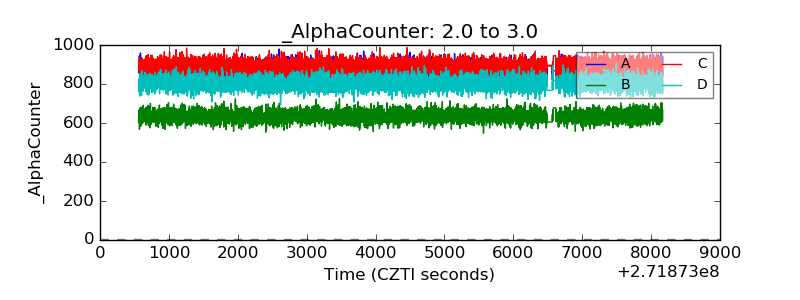 |
| _CPM_Rate | 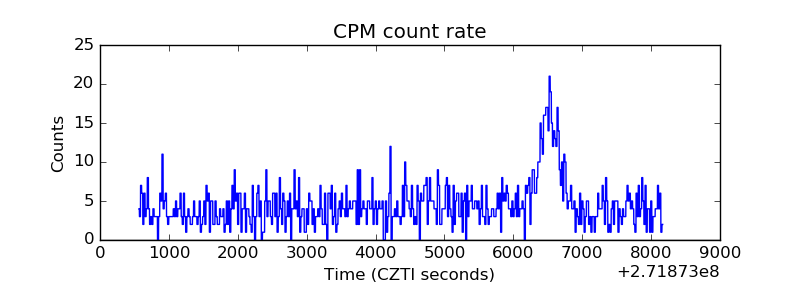 |
| CZT Counter | 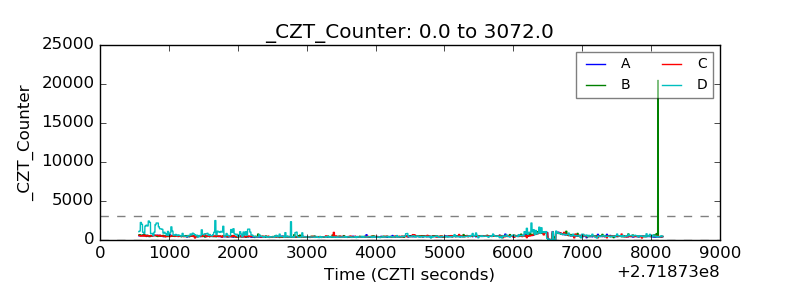 |
| +2.5 Volts monitor |  |
| +5 Volts monitor |  |
| _ROLL_ROT | 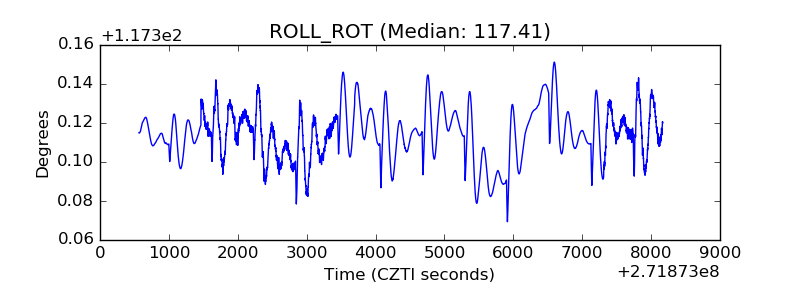 |
| _Roll_DEC | 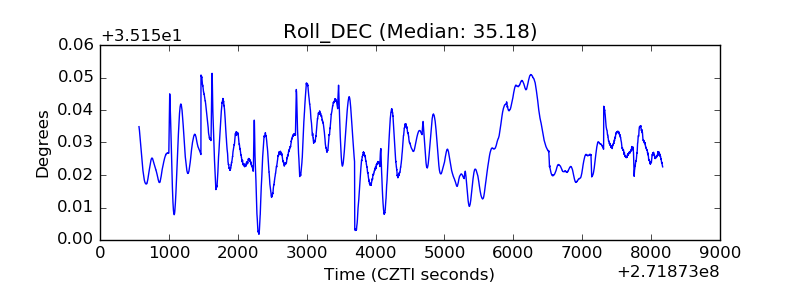 |
| _Roll_RA | 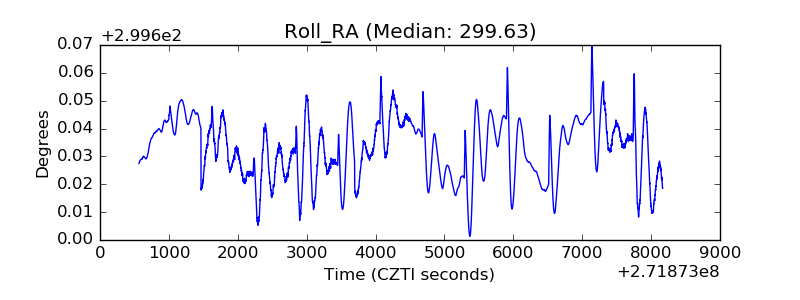 |
| Veto Counter | 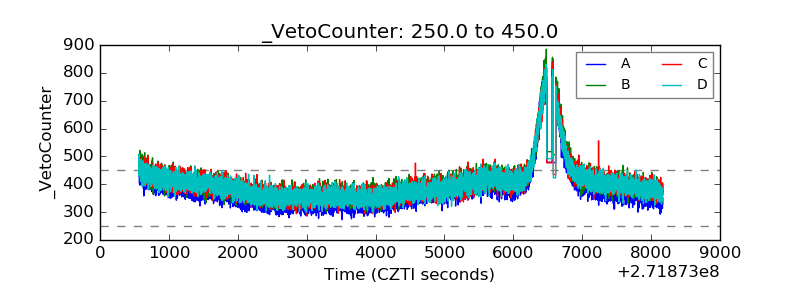 |