| Param | Original file | Final file |
|---|---|---|
| Filename | modeM0/AS1G08_030T01_9000002302_15551cztM0_level2.evt | modeM0/AS1G08_030T01_9000002302_15551cztM0_level2_quad_clean.evt |
| Size (bytes) | 494,732,160 | 104,287,680 |
| Size | 471.8 MB | 99.5 MB |
| Events in quadrant A | 3,466,067 | 675,305 |
| Events in quadrant B | 3,712,826 | 682,354 |
| Events in quadrant C | 3,543,724 | 646,815 |
| Events in quadrant D | 3,756,512 | 637,798 |
| Mode SS | |||
|---|---|---|---|
| Quadrant | BADHDUFLAG | Total packets | Discarded packets |
| A | 0 | 152 | 0 |
| B | 0 | 152 | 0 |
| C | 0 | 152 | 0 |
| D | 0 | 152 | 0 |
| Mode M0 | |||
|---|---|---|---|
| Quadrant | BADHDUFLAG | Total packets | Discarded packets |
| A | 0 | 15296 | 8 |
| B | 0 | 15911 | 7 |
| C | 0 | 15373 | 13 |
| D | 0 | 16265 | 4 |
| Mode M9 | |||
|---|---|---|---|
| Quadrant | BADHDUFLAG | Total packets | Discarded packets |
| A | 0 | 3 | 0 |
| B | 0 | 3 | 0 |
| C | 0 | 3 | 0 |
| D | 0 | 3 | 0 |
| Quadrant | Total seconds | Saturated seconds | Saturation percentage |
|---|---|---|---|
| A | 7411 | 53 | 0.715153% |
| B | 7411 | 83 | 1.119957% |
| C | 7408 | 122 | 1.646868% |
| D | 7412 | 101 | 1.362655% |
Noise dominated data is calculated using 1-second bins in cleaned event files. If a bin has >2000 counts, and if more than 50% of those come from <1% of pixels, then it is considered to be noise-dominated and hence unusable.
| Quadrant | # 1 sec bins | Bins with >0 counts | Bins with >2000 counts | High rate bins dominated by noise | Noise dominated (total time) | Noise dominated (detector-on time) | Marked lightcurve |
|---|---|---|---|---|---|---|---|
| A | 7744 | 7415 | 1 | 1 | 0.01% | 0.01% | 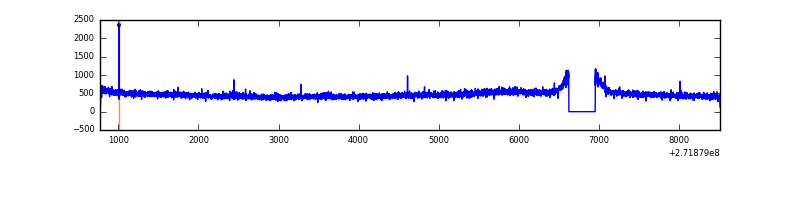 |
| B | 7743 | 7414 | 10 | 10 | 0.13% | 0.13% | 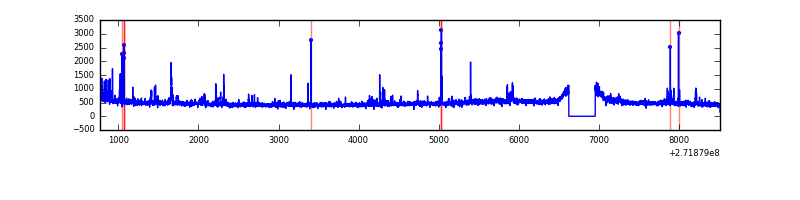 |
| C | 7741 | 7411 | 0 | 0 | 0.00% | 0.00% | 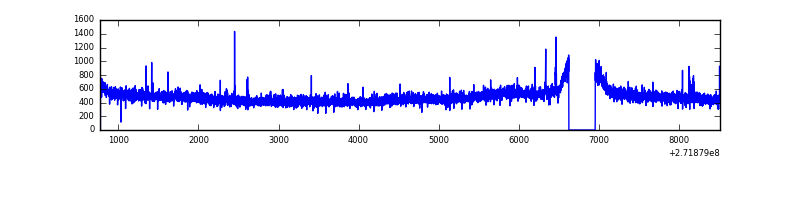 |
| D | 7743 | 7414 | 50 | 50 | 0.65% | 0.67% | 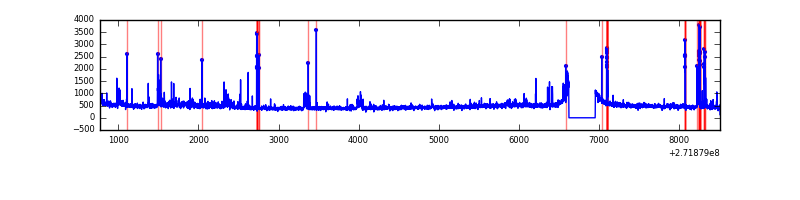 |
Top three noisy pixels from each quadrant. If the there are fewer than three noisy pixels in the level2.evt file, extra rows are filled as -1
| Pixel properties | Quadrant properties | ||||||
|---|---|---|---|---|---|---|---|
| Quadrant | DetID | PixID | Counts | Sigma | Mean | Median | Sigma |
| A | 15 | 249 | 23771 | 126.73 | 894 | 873 | 180.7 |
| A | 0 | 226 | 7885 | 38.81 | 894 | 873 | 180.7 |
| A | 12 | 194 | 6545 | 31.39 | 894 | 873 | 180.7 |
| B | 3 | 64 | 98154 | 561.5 | 893 | 869 | 173.3 |
| B | 0 | 189 | 50427 | 286.03 | 893 | 869 | 173.3 |
| B | 4 | 48 | 20789 | 114.97 | 893 | 869 | 173.3 |
| C | 14 | 238 | 141021 | 697.09 | 858 | 864 | 201.1 |
| C | 3 | 233 | 23254 | 111.36 | 858 | 864 | 201.1 |
| C | 10 | 22 | 20557 | 97.95 | 858 | 864 | 201.1 |
| D | 5 | 222 | 129540 | 563.78 | 865 | 844 | 228.3 |
| D | 13 | 172 | 119394 | 519.33 | 865 | 844 | 228.3 |
| D | 2 | 16 | 78997 | 342.36 | 865 | 844 | 228.3 |
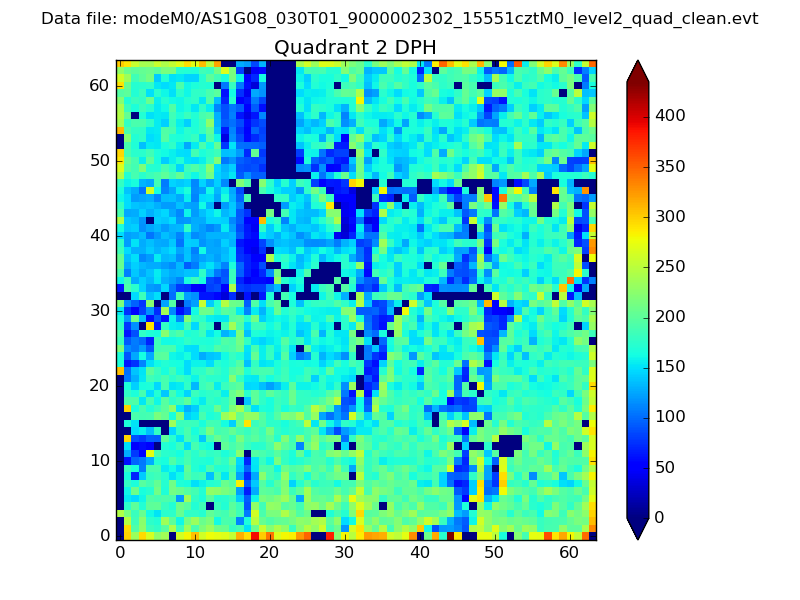
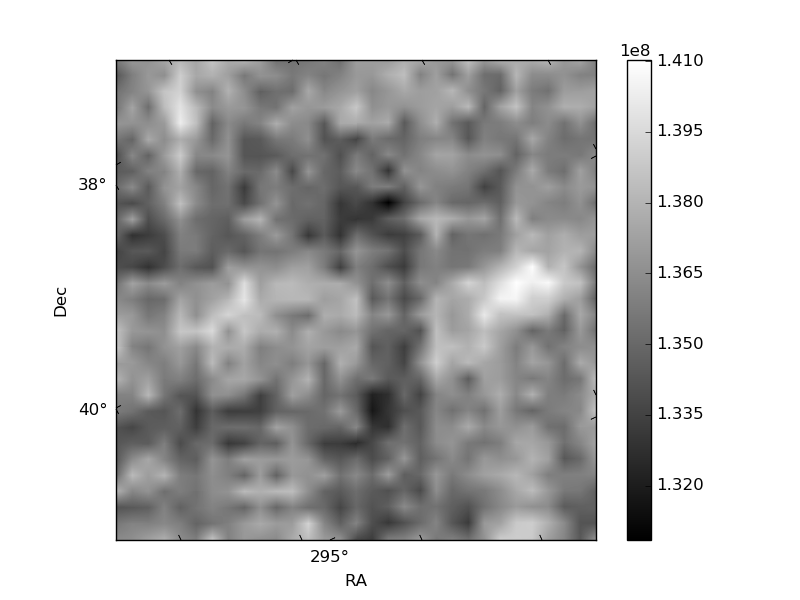
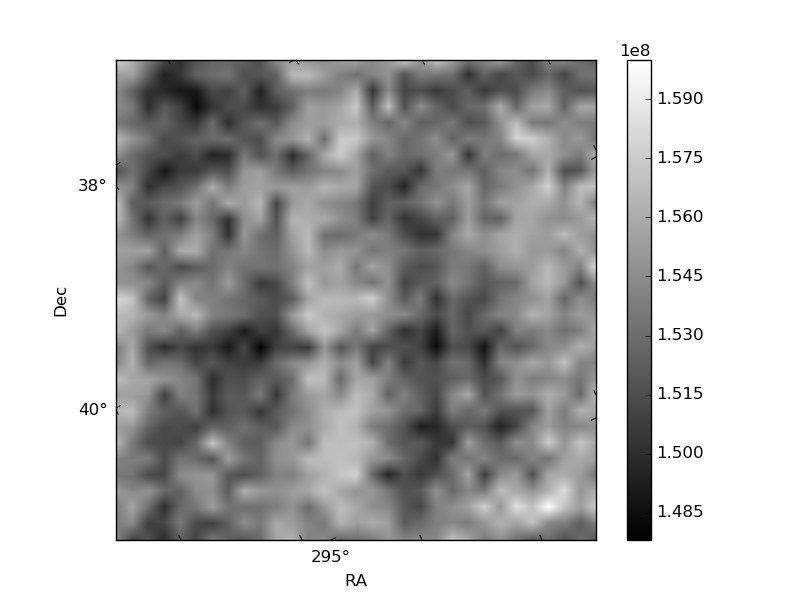
Histogram calculated using DETX and DETY for each event in the final _common_clean file
| Quadrant A | 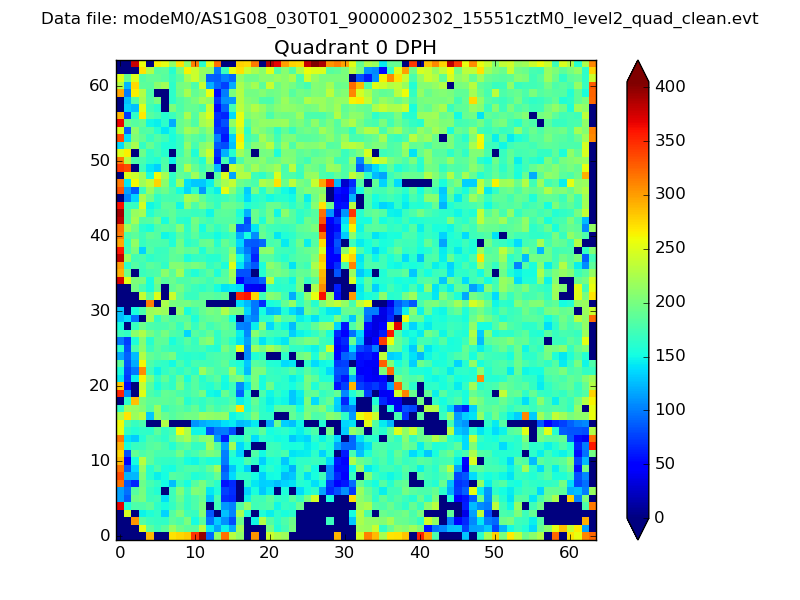 |
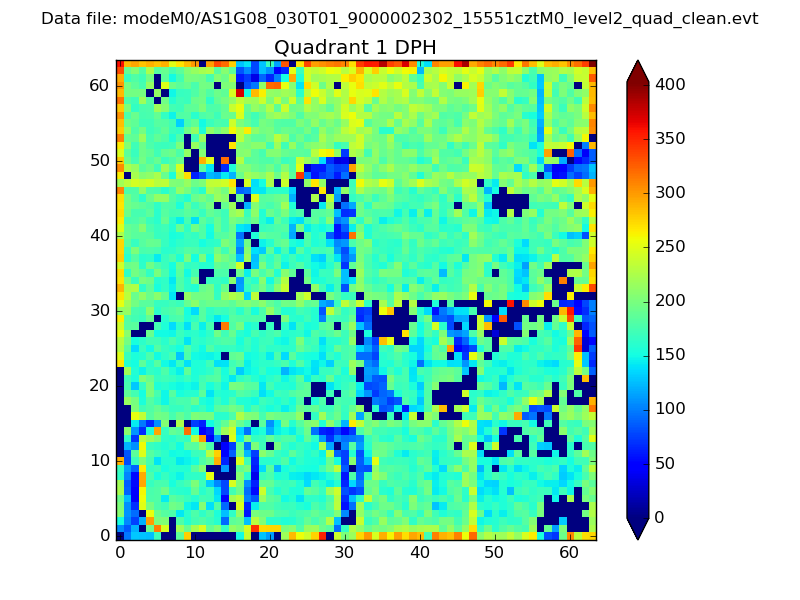 |
Quadrant B |
|---|---|---|---|
| Quadrant D | 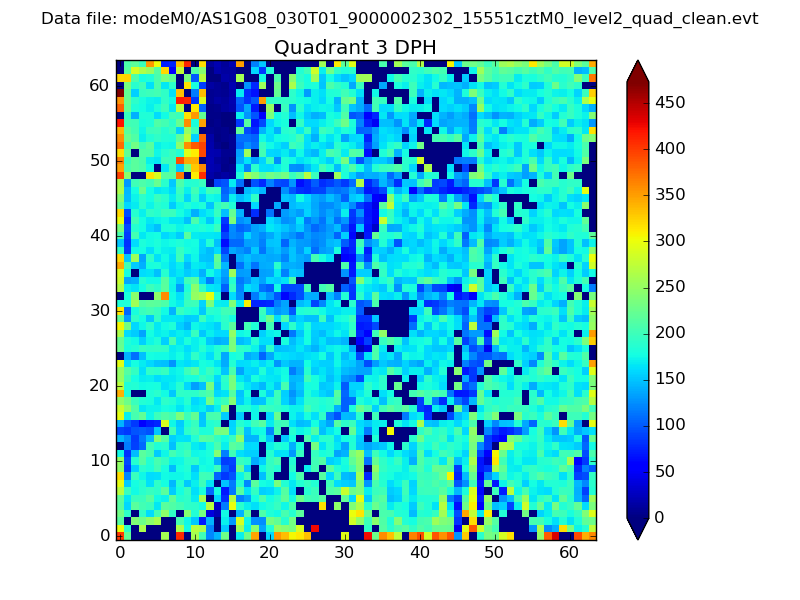 |
 |
Quadrant C |
| Plot type | Count rate plots | Images |
|---|---|---|
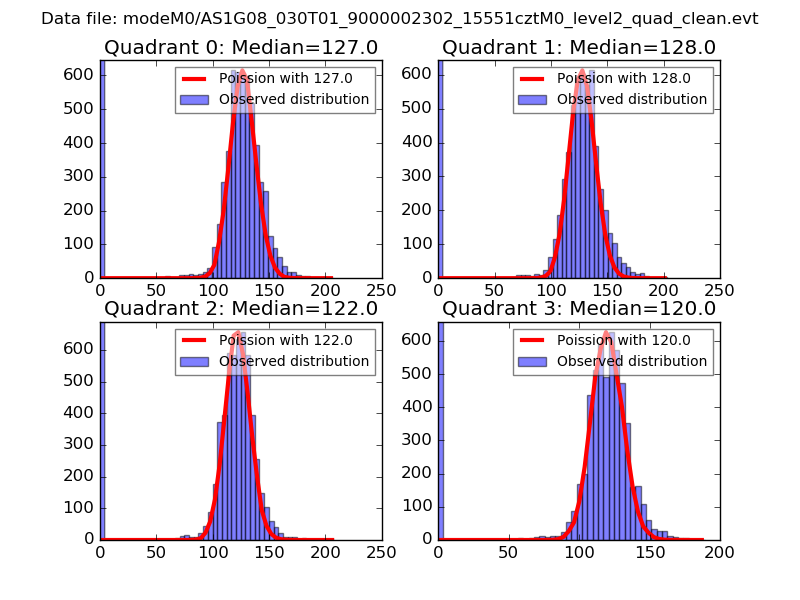
| Comparison with Poisson distribution Blue bars denote a histogram of data divided into 1 sec bins. Red curve is a Poisson curve with rate = median count rate of data. |
 |
 |
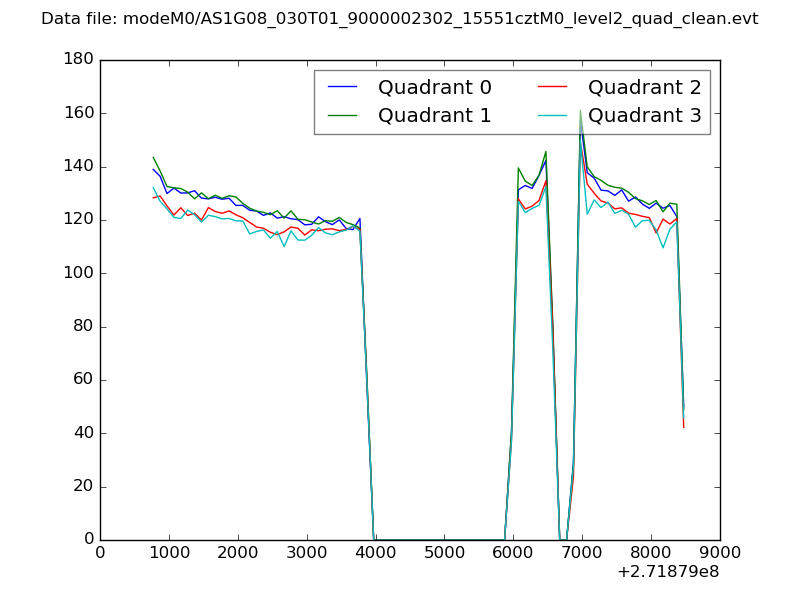
| Quadrant-wise count rates Data is divided into 100 sec bins |
 |
|
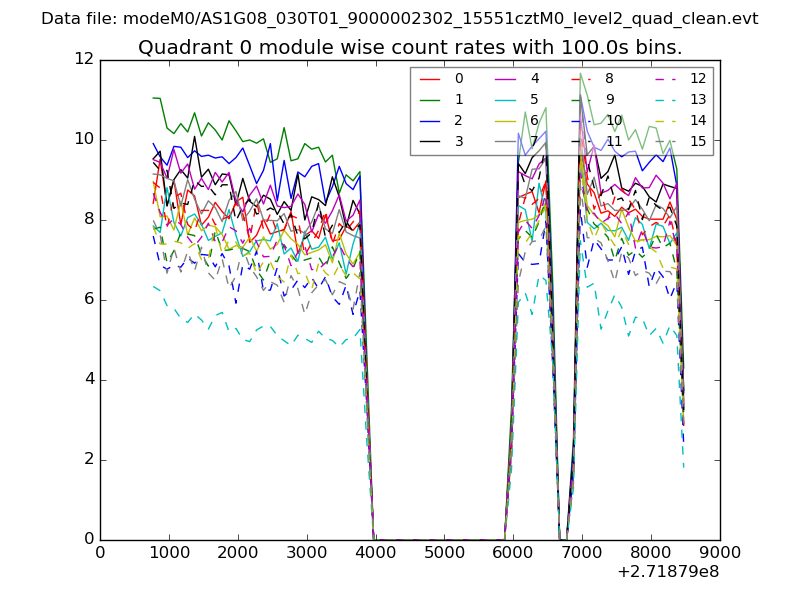
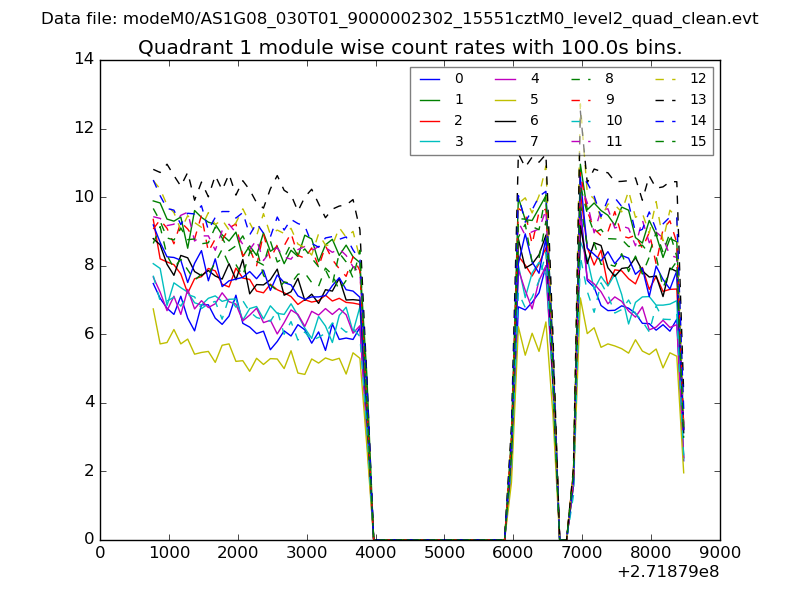
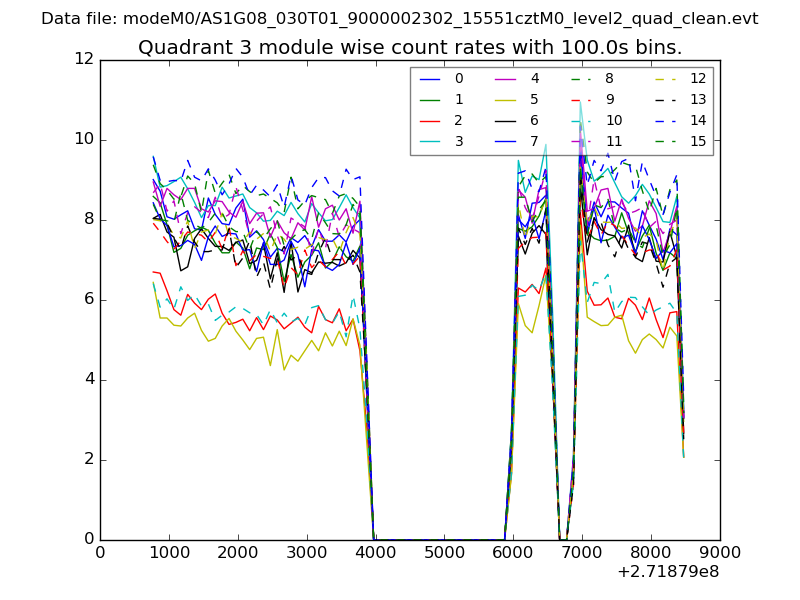
| Module-wise count rates for Quadrant A Data is divided into 100 sec bins |
 |
 |
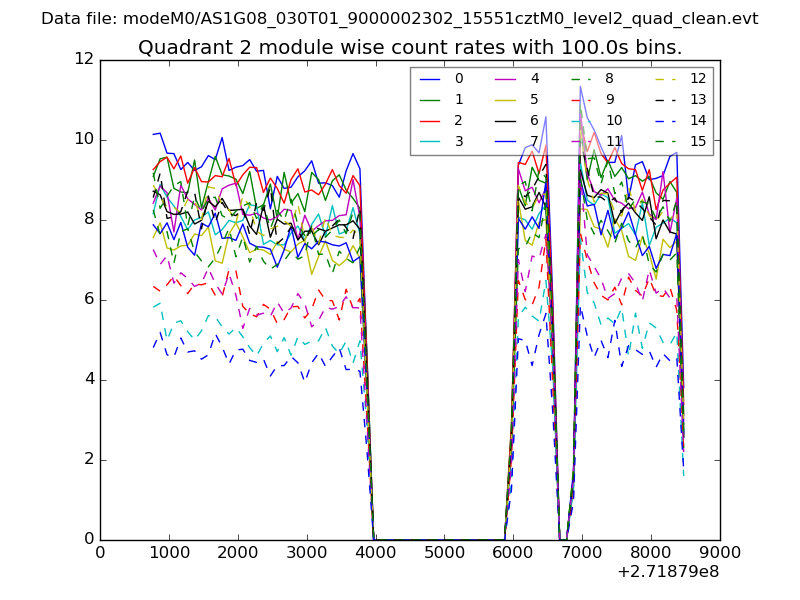
| Module-wise count rates for Quadrant B Data is divided into 100 sec bins |
 |
 |
| Module-wise count rates for Quadrant C Data is divided into 100 sec bins |
 |
 |
| Module-wise count rates for Quadrant D Data is divided into 100 sec bins |
 |
 |
| Parameter | Plot |
|---|---|
| CZT HV Monitor | 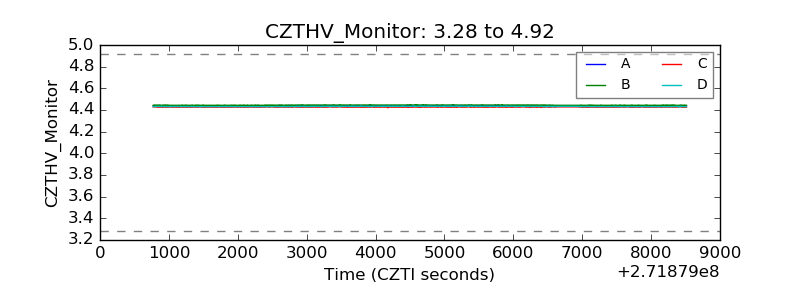 |
| D_VDD | 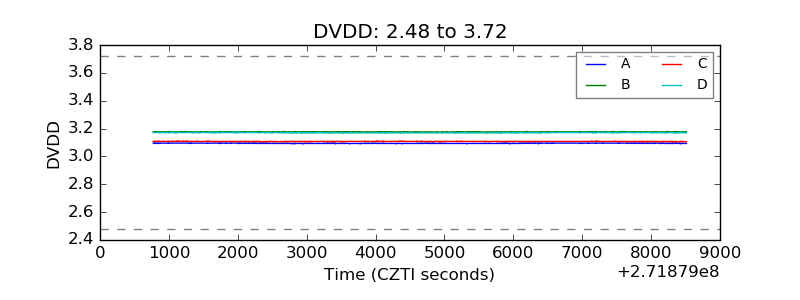 |
| Temperature 1 | 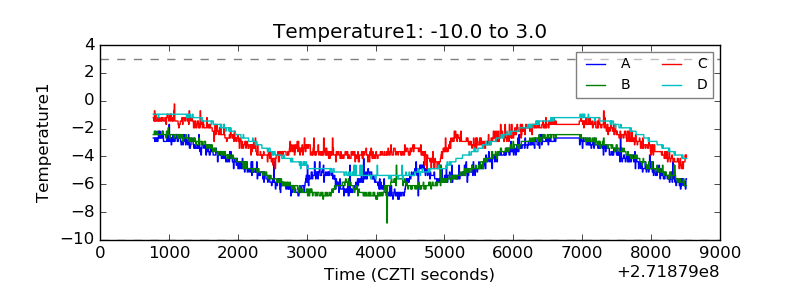 |
| Veto HV Monitor | 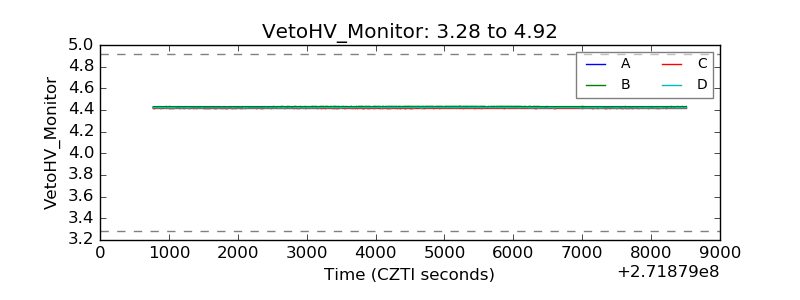 |
| Veto LLD | 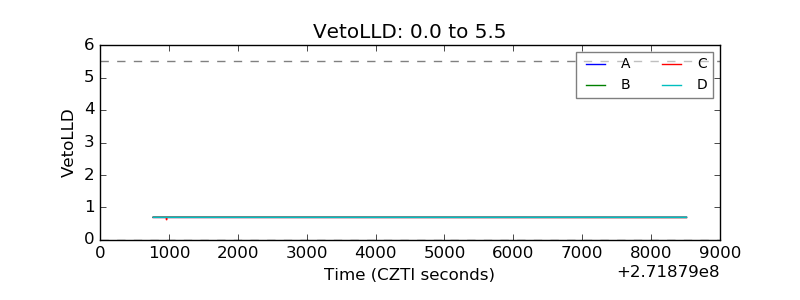 |
| Alpha Counter | 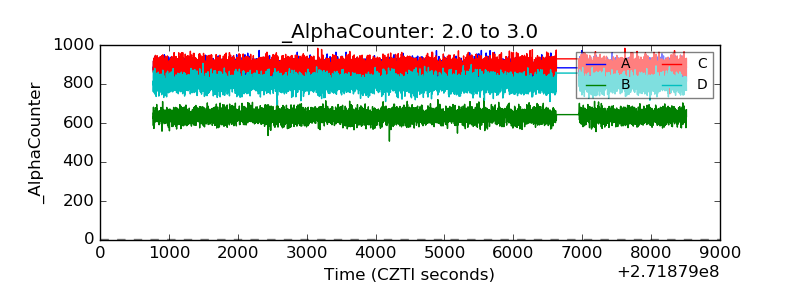 |
| _CPM_Rate | 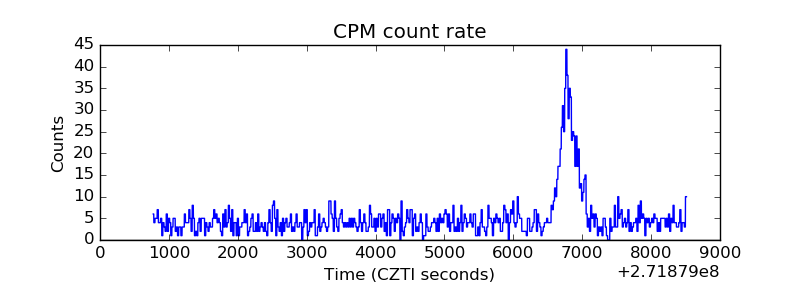 |
| CZT Counter | 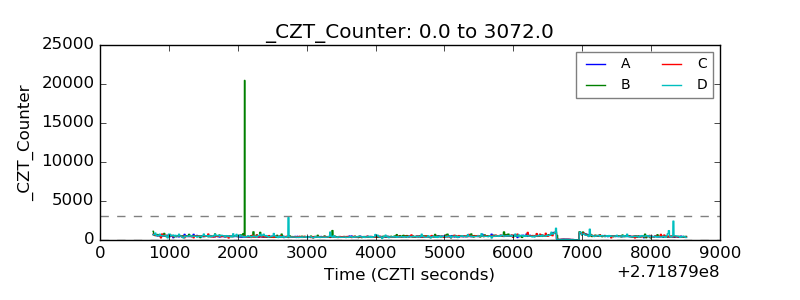 |
| +2.5 Volts monitor | 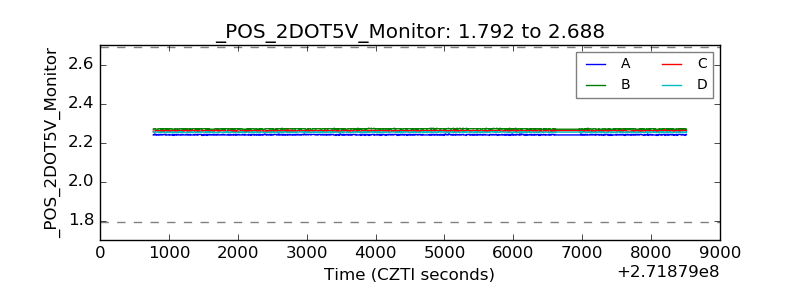 |
| +5 Volts monitor | 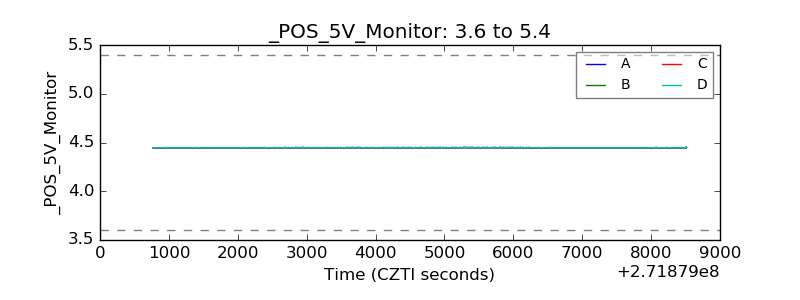 |
| _ROLL_ROT | 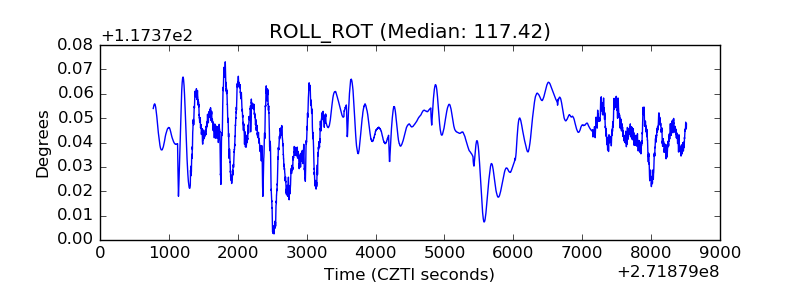 |
| _Roll_DEC | 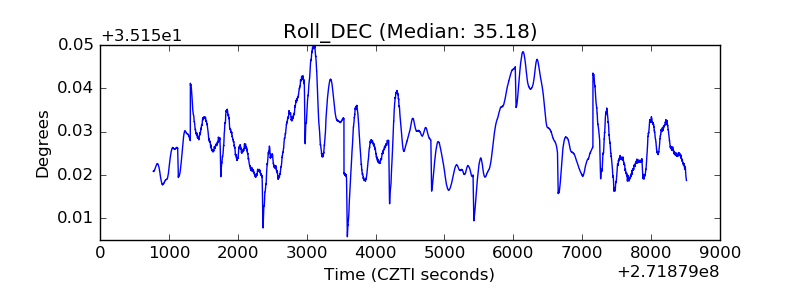 |
| _Roll_RA | 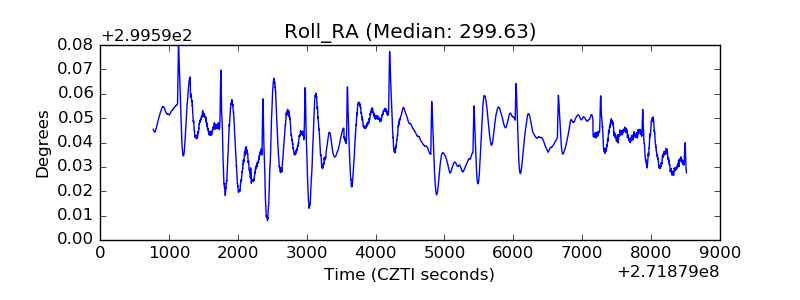 |
| Veto Counter | 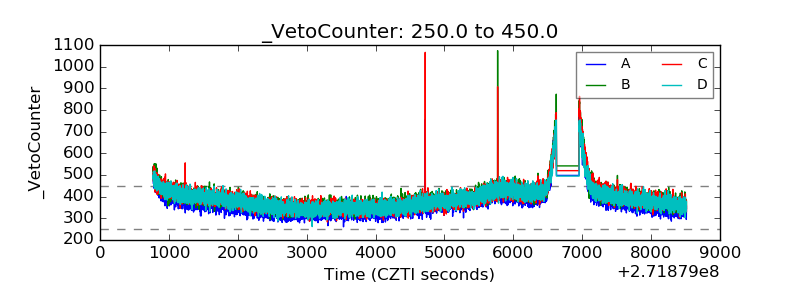 |