| Param | Original file | Final file |
|---|---|---|
| Filename | modeM0/AS1G08_030T01_9000002302_15553cztM0_level2.evt | modeM0/AS1G08_030T01_9000002302_15553cztM0_level2_quad_clean.evt |
| Size (bytes) | 850,248,000 | 173,494,080 |
| Size | 810.9 MB | 165.5 MB |
| Events in quadrant A | 5,905,146 | 1,113,175 |
| Events in quadrant B | 6,678,378 | 1,120,697 |
| Events in quadrant C | 6,082,621 | 1,069,901 |
| Events in quadrant D | 6,210,621 | 1,060,190 |
| Mode SS | |||
|---|---|---|---|
| Quadrant | BADHDUFLAG | Total packets | Discarded packets |
| A | 0 | 264 | 0 |
| B | 0 | 264 | 0 |
| C | 0 | 264 | 0 |
| D | 0 | 264 | 0 |
| Mode M0 | |||
|---|---|---|---|
| Quadrant | BADHDUFLAG | Total packets | Discarded packets |
| A | 0 | 26443 | 4 |
| B | 0 | 28446 | 3 |
| C | 0 | 26616 | 3 |
| D | 0 | 27617 | 3 |
| Mode M9 | |||
|---|---|---|---|
| Quadrant | BADHDUFLAG | Total packets | Discarded packets |
| A | 0 | 16 | 0 |
| B | 0 | 16 | 0 |
| C | 0 | 16 | 0 |
| D | 0 | 16 | 0 |
| Quadrant | Total seconds | Saturated seconds | Saturation percentage |
|---|---|---|---|
| A | 12885 | 69 | 0.535506% |
| B | 12885 | 210 | 1.629802% |
| C | 12885 | 169 | 1.311603% |
| D | 12885 | 177 | 1.373690% |
Noise dominated data is calculated using 1-second bins in cleaned event files. If a bin has >2000 counts, and if more than 50% of those come from <1% of pixels, then it is considered to be noise-dominated and hence unusable.
| Quadrant | # 1 sec bins | Bins with >0 counts | Bins with >2000 counts | High rate bins dominated by noise | Noise dominated (total time) | Noise dominated (detector-on time) | Marked lightcurve |
|---|---|---|---|---|---|---|---|
| A | 14161 | 12888 | 2 | 2 | 0.01% | 0.02% | 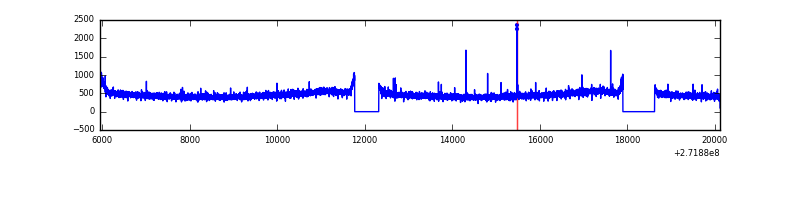 |
| B | 14161 | 12888 | 78 | 78 | 0.55% | 0.61% | 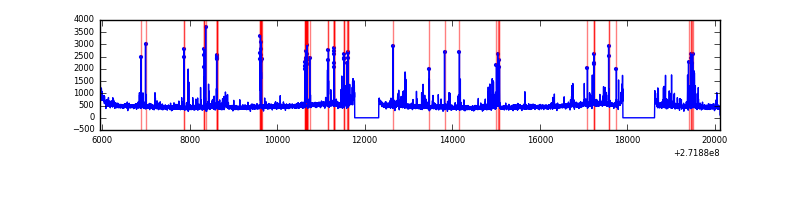 |
| C | 14161 | 12886 | 1 | 1 | 0.01% | 0.01% | 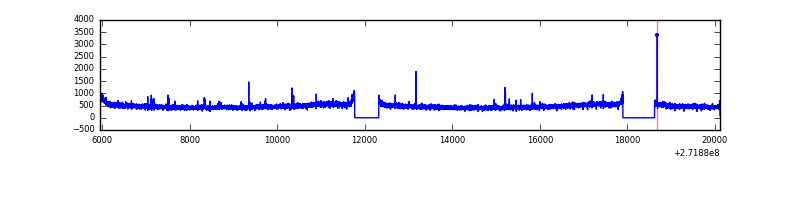 |
| D | 14161 | 12888 | 106 | 106 | 0.75% | 0.82% | 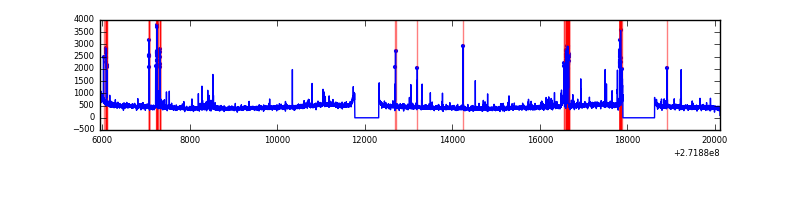 |
Top three noisy pixels from each quadrant. If the there are fewer than three noisy pixels in the level2.evt file, extra rows are filled as -1
| Pixel properties | Quadrant properties | ||||||
|---|---|---|---|---|---|---|---|
| Quadrant | DetID | PixID | Counts | Sigma | Mean | Median | Sigma |
| A | 9 | 143 | 24669 | 75.29 | 1527 | 1494 | 307.8 |
| A | 0 | 226 | 13350 | 38.52 | 1527 | 1494 | 307.8 |
| A | 12 | 194 | 11300 | 31.86 | 1527 | 1494 | 307.8 |
| B | 3 | 64 | 371996 | 1256.1 | 1527 | 1488 | 295.0 |
| B | 4 | 48 | 189635 | 637.86 | 1527 | 1488 | 295.0 |
| B | 0 | 189 | 67416 | 223.51 | 1527 | 1488 | 295.0 |
| C | 14 | 238 | 233918 | 675.57 | 1470 | 1479 | 344.1 |
| C | 3 | 233 | 75674 | 215.64 | 1470 | 1479 | 344.1 |
| C | 0 | 207 | 13990 | 36.36 | 1470 | 1479 | 344.1 |
| D | 5 | 222 | 204881 | 514.02 | 1472 | 1438 | 395.8 |
| D | 15 | 0 | 103678 | 258.32 | 1472 | 1438 | 395.8 |
| D | 13 | 172 | 100998 | 251.55 | 1472 | 1438 | 395.8 |
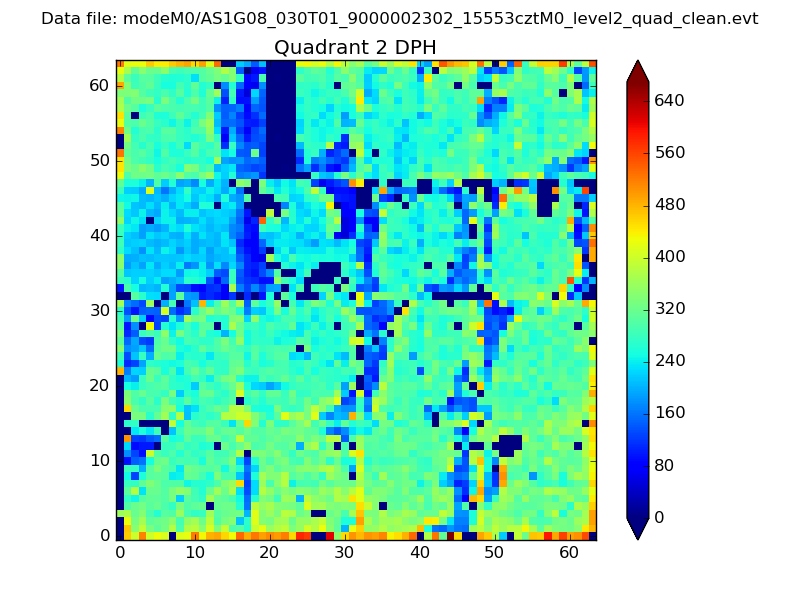
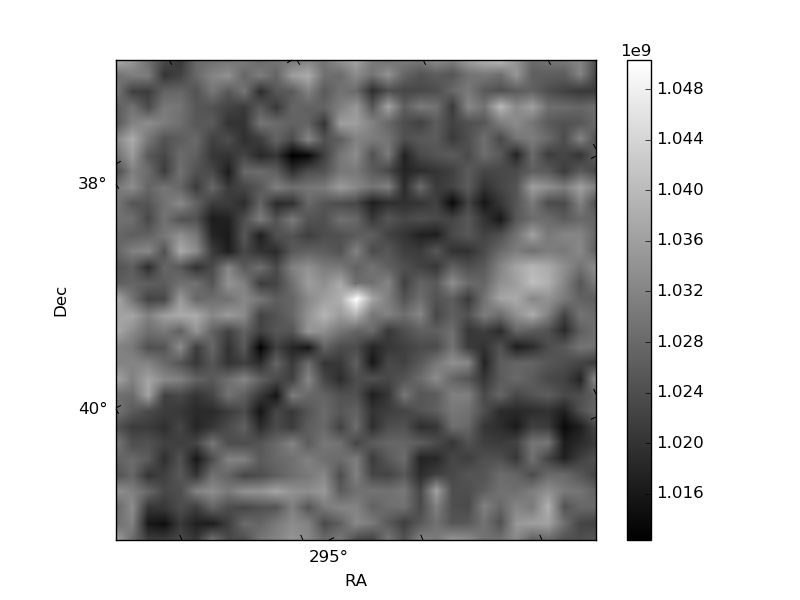
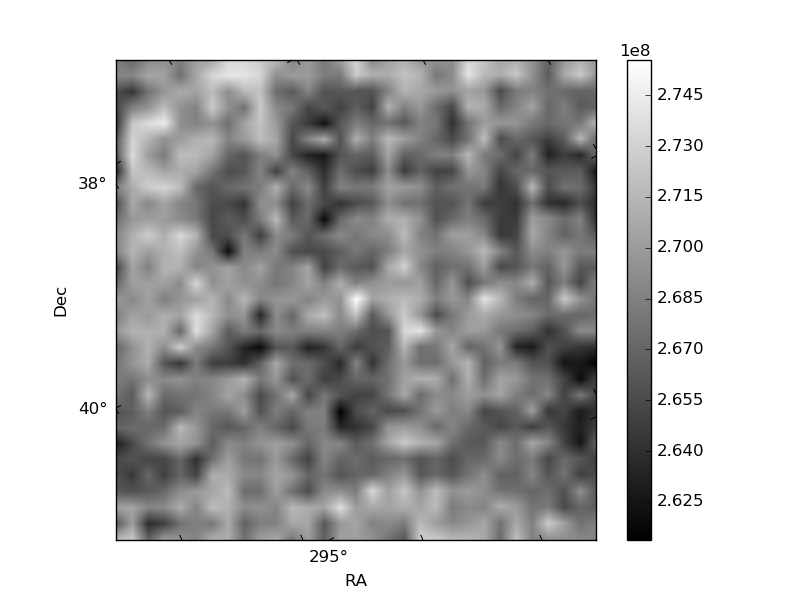
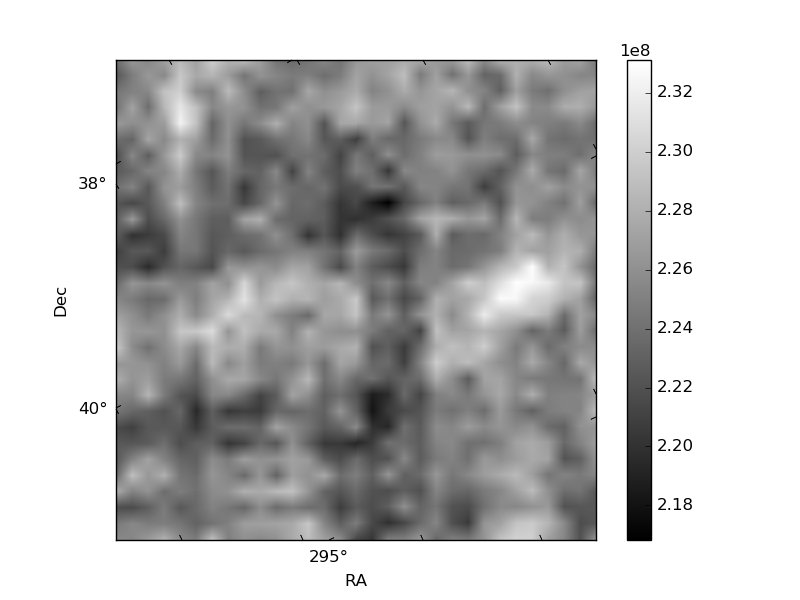
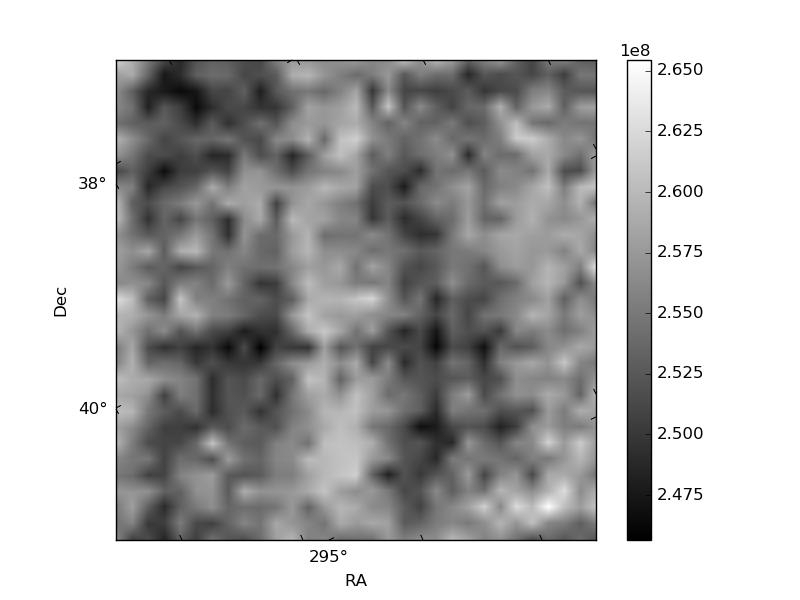
Histogram calculated using DETX and DETY for each event in the final _common_clean file
| Quadrant A | 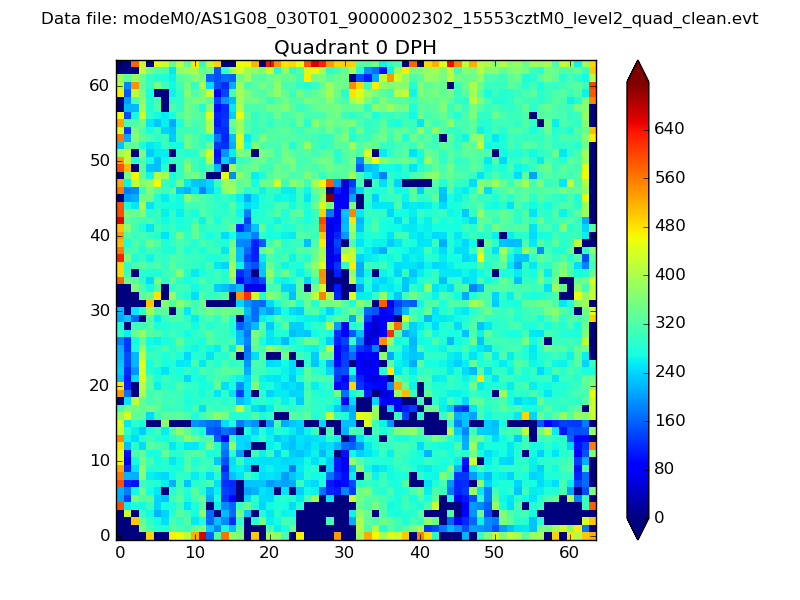 |
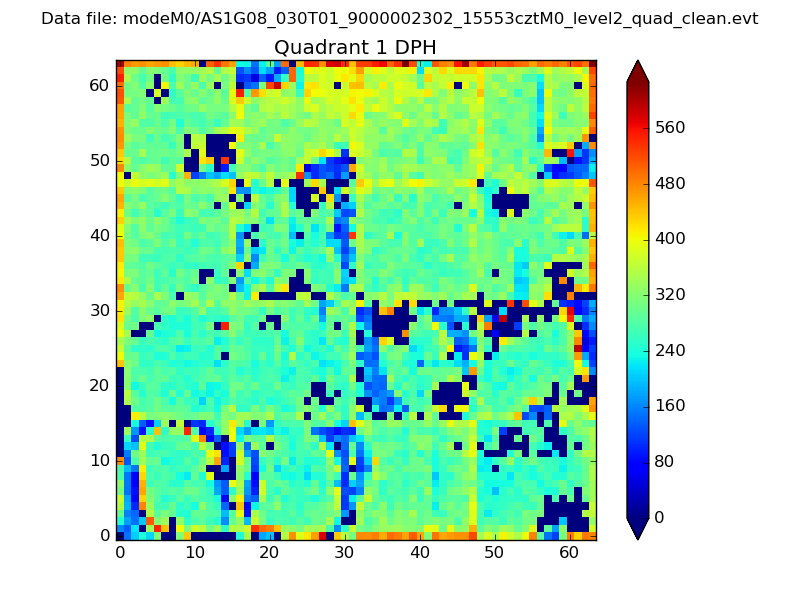 |
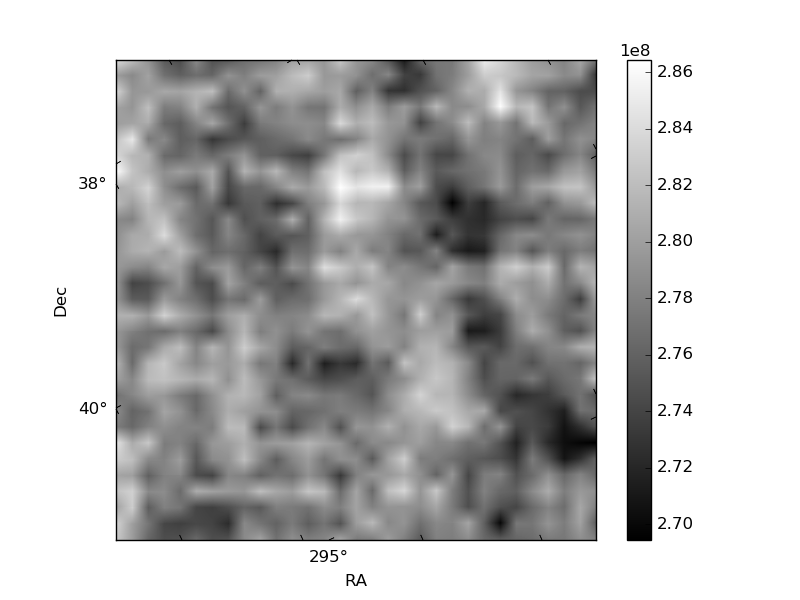
Quadrant B |
|---|---|---|---|
| Quadrant D | 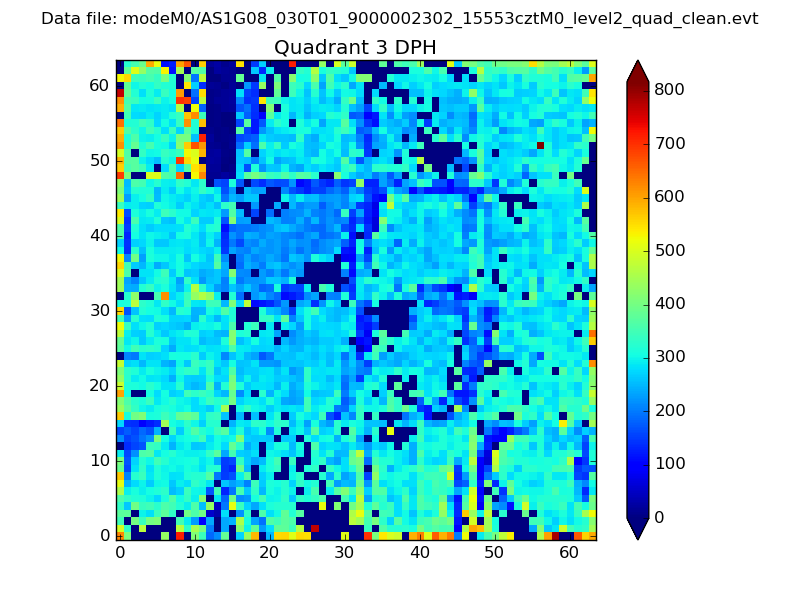 |
 |
Quadrant C |
| Plot type | Count rate plots | Images |
|---|---|---|
| Comparison with Poisson distribution Blue bars denote a histogram of data divided into 1 sec bins. Red curve is a Poisson curve with rate = median count rate of data. |
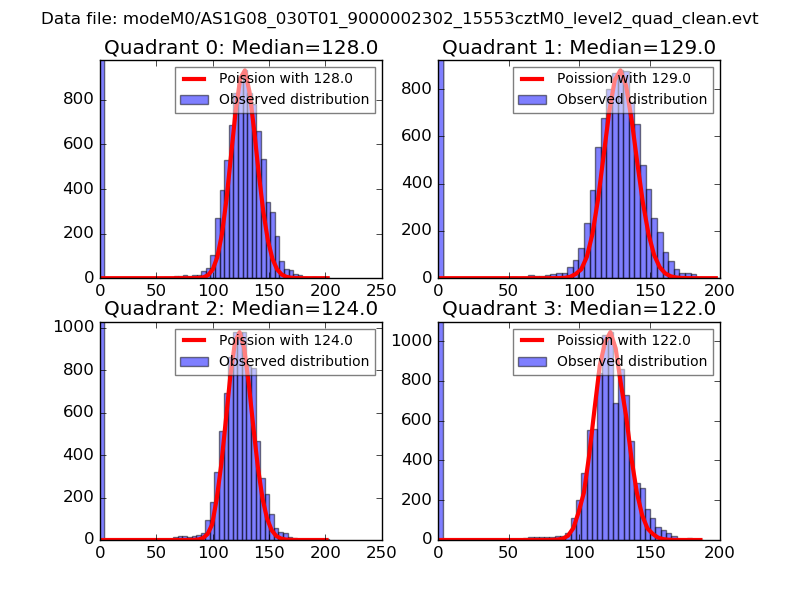 |
 |
| Quadrant-wise count rates Data is divided into 100 sec bins |
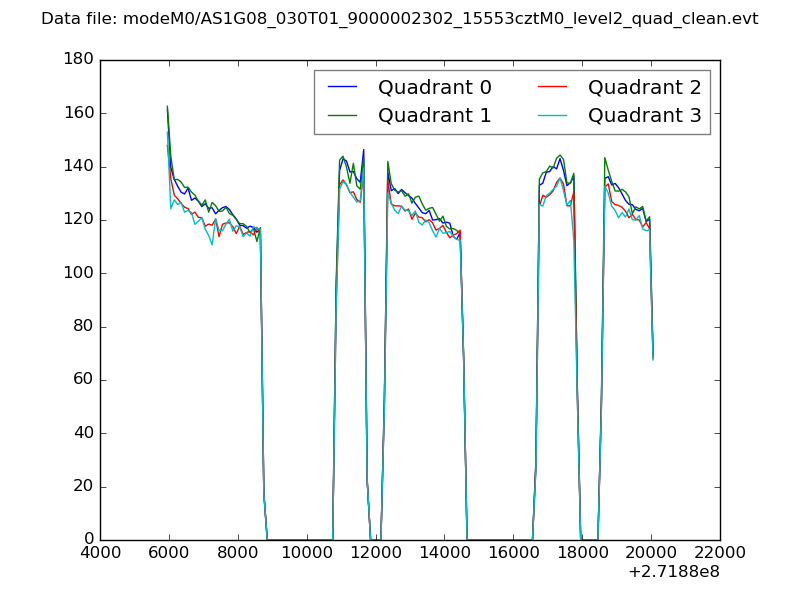 |
|
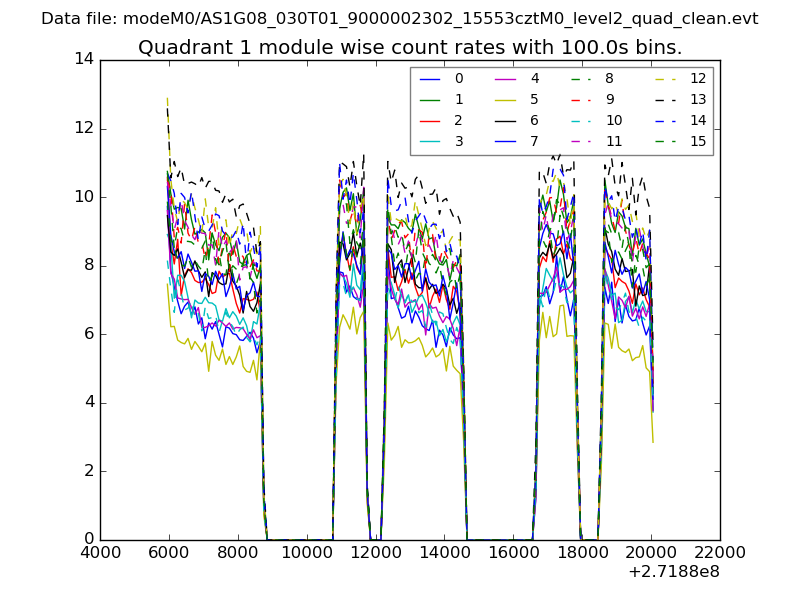
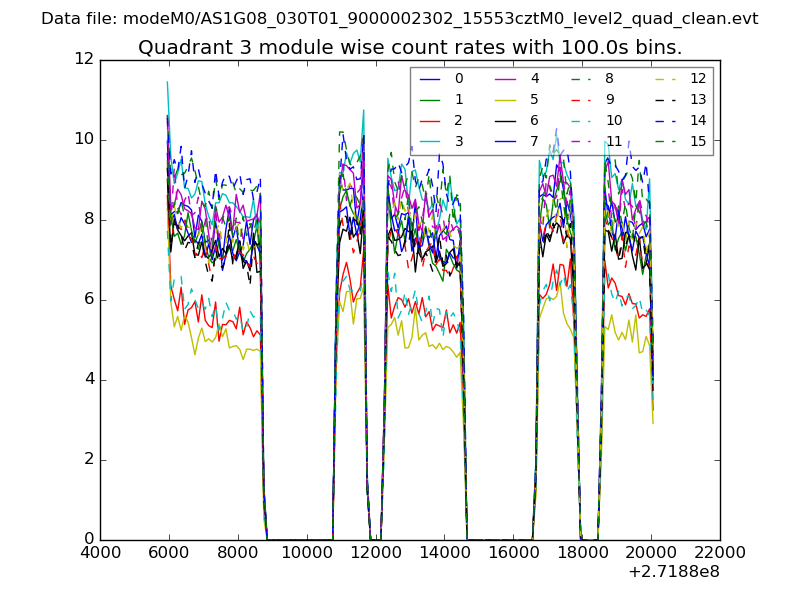
| Module-wise count rates for Quadrant A Data is divided into 100 sec bins |
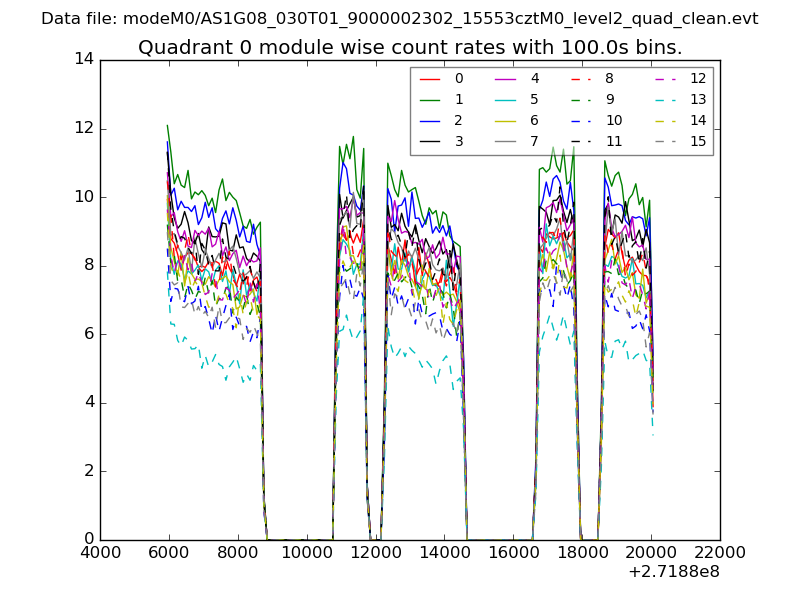 |
 |
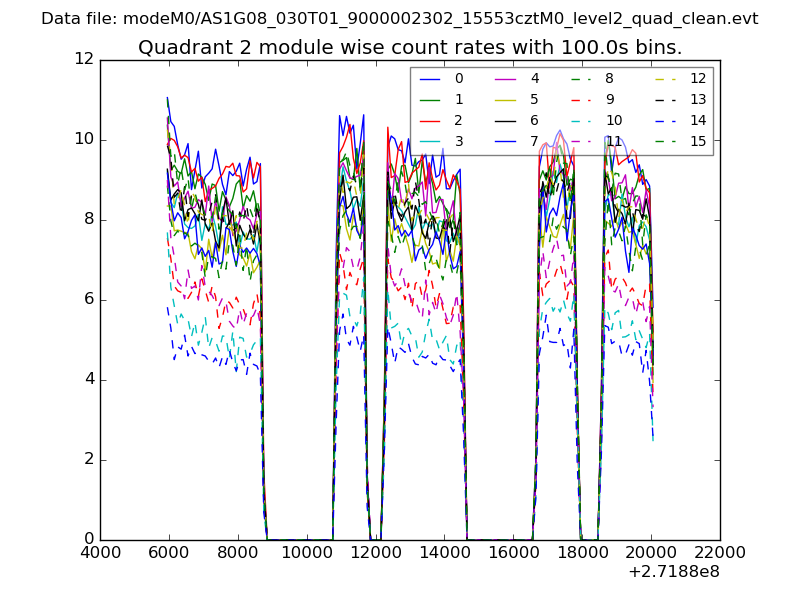
| Module-wise count rates for Quadrant B Data is divided into 100 sec bins |
 |
 |
| Module-wise count rates for Quadrant C Data is divided into 100 sec bins |
 |
 |
| Module-wise count rates for Quadrant D Data is divided into 100 sec bins |
 |
 |
| Parameter | Plot |
|---|---|
| CZT HV Monitor | 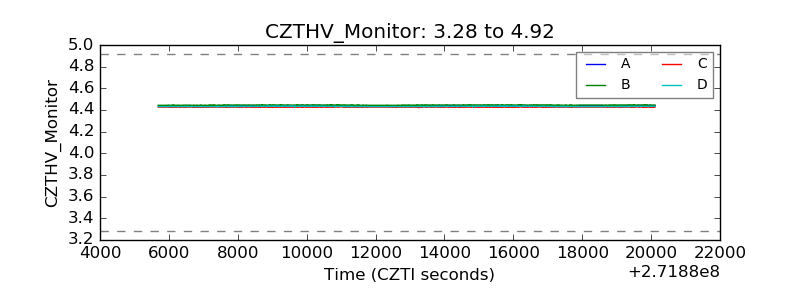 |
| D_VDD | 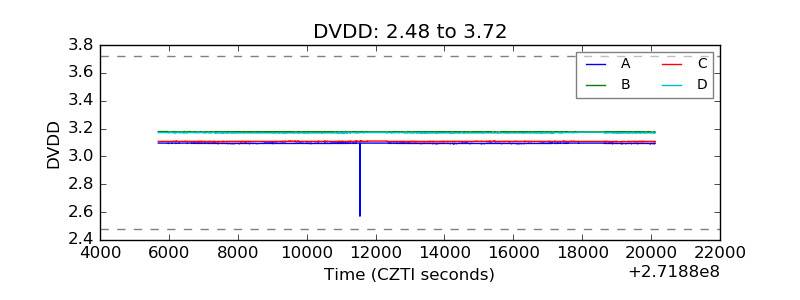 |
| Temperature 1 | 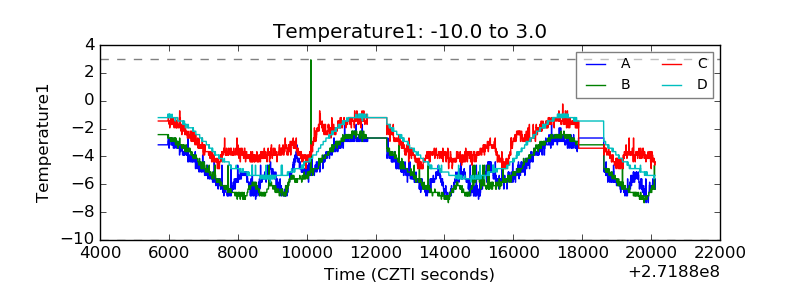 |
| Veto HV Monitor | 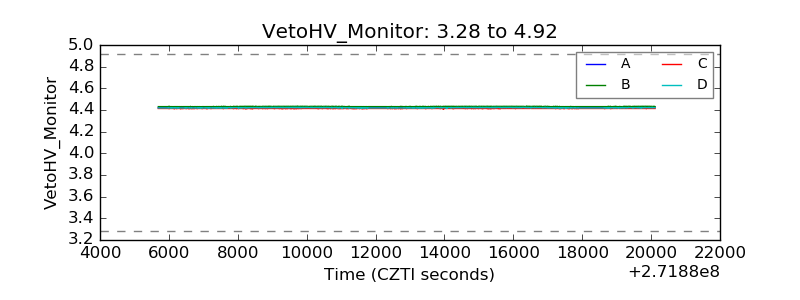 |
| Veto LLD | 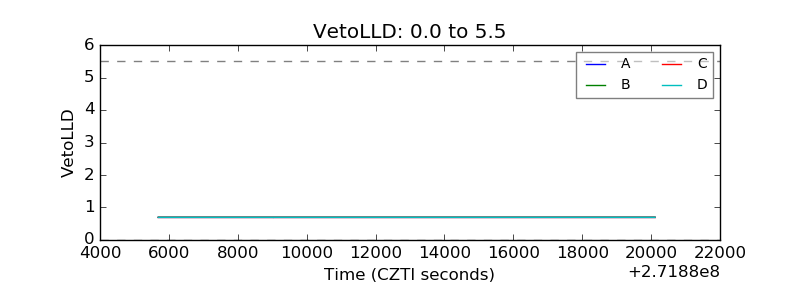 |
| Alpha Counter | 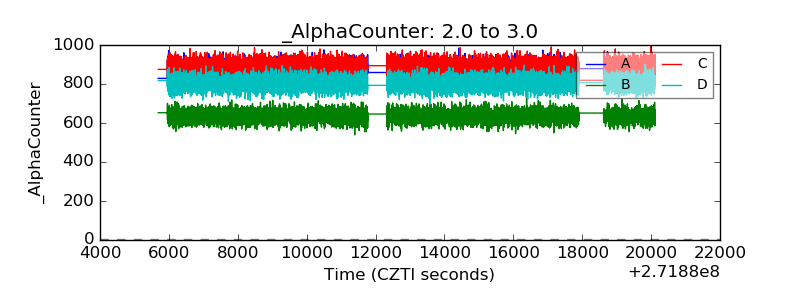 |
| _CPM_Rate | 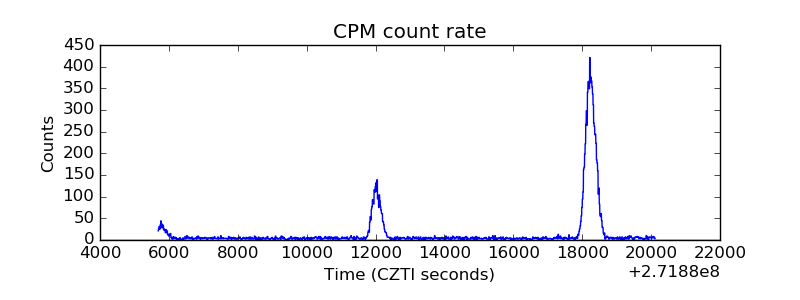 |
| CZT Counter | 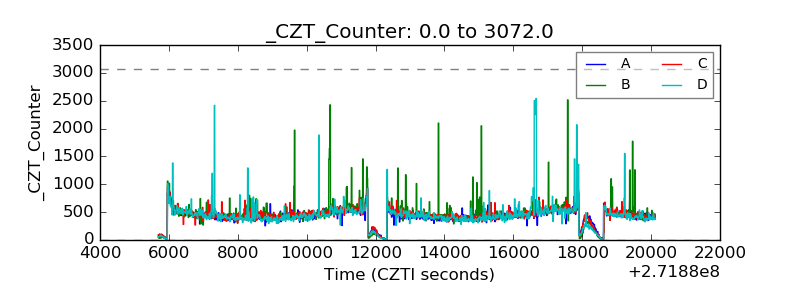 |
| +2.5 Volts monitor |  |
| +5 Volts monitor |  |
| _ROLL_ROT | 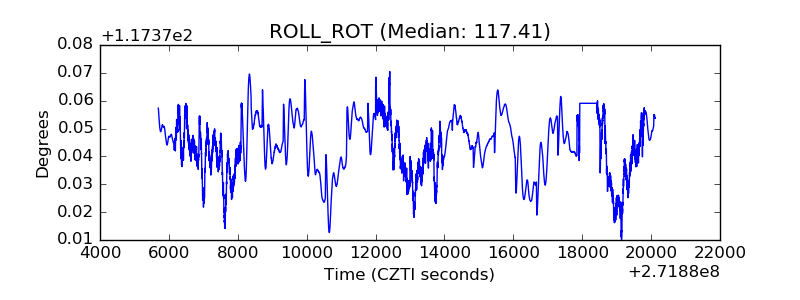 |
| _Roll_DEC | 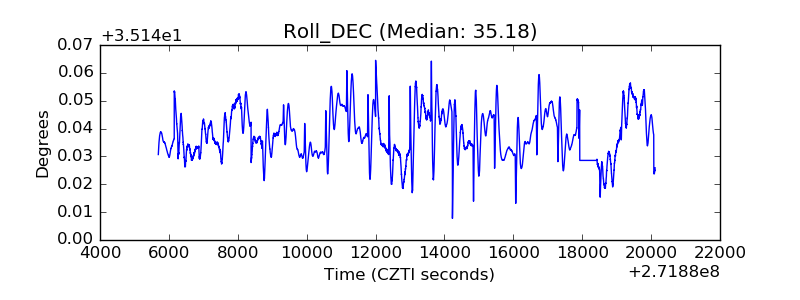 |
| _Roll_RA | 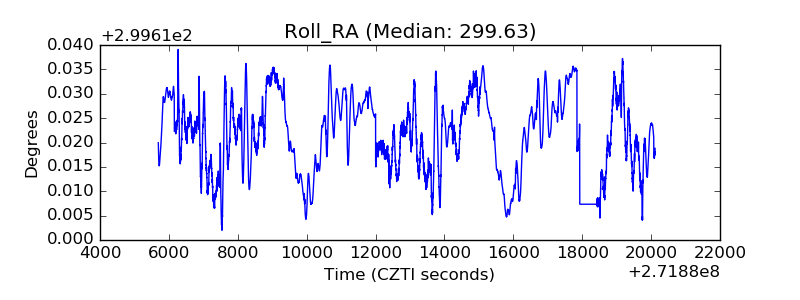 |
| Veto Counter | 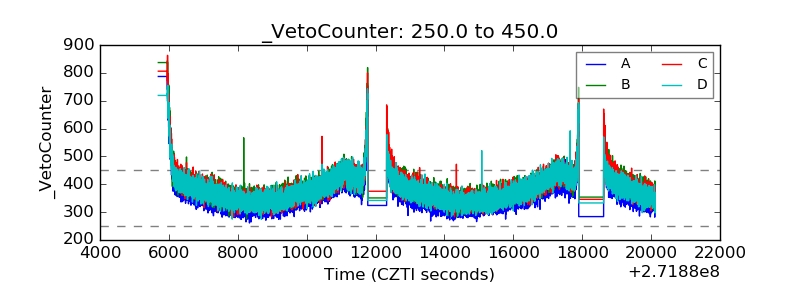 |