| Param | Original file | Final file |
|---|---|---|
| Filename | modeM0/AS1A04_198T01_9000002308_15568cztM0_level2.evt | modeM0/AS1A04_198T01_9000002308_15568cztM0_level2_quad_clean.evt |
| Size (bytes) | 1,012,567,680 | 204,168,960 |
| Size | 965.7 MB | 194.7 MB |
| Events in quadrant A | 6,960,314 | 1,298,307 |
| Events in quadrant B | 7,227,446 | 1,316,488 |
| Events in quadrant C | 7,446,955 | 1,271,574 |
| Events in quadrant D | 8,012,799 | 1,259,354 |
| Mode M0 | |||
|---|---|---|---|
| Quadrant | BADHDUFLAG | Total packets | Discarded packets |
| A | 0 | 30648 | 4 |
| B | 0 | 31150 | 3 |
| C | 0 | 31497 | 3 |
| D | 0 | 34016 | 3 |
| Mode SS | |||
|---|---|---|---|
| Quadrant | BADHDUFLAG | Total packets | Discarded packets |
| A | 0 | 308 | 0 |
| B | 0 | 308 | 0 |
| C | 0 | 308 | 0 |
| D | 0 | 308 | 0 |
| Mode M9 | |||
|---|---|---|---|
| Quadrant | BADHDUFLAG | Total packets | Discarded packets |
| A | 0 | 19 | 0 |
| B | 0 | 19 | 0 |
| C | 0 | 19 | 0 |
| D | 0 | 19 | 0 |
| Quadrant | Total seconds | Saturated seconds | Saturation percentage |
|---|---|---|---|
| A | 15040 | 84 | 0.558511% |
| B | 15040 | 102 | 0.678191% |
| C | 15040 | 175 | 1.163564% |
| D | 15040 | 238 | 1.582447% |
Noise dominated data is calculated using 1-second bins in cleaned event files. If a bin has >2000 counts, and if more than 50% of those come from <1% of pixels, then it is considered to be noise-dominated and hence unusable.
| Quadrant | # 1 sec bins | Bins with >0 counts | Bins with >2000 counts | High rate bins dominated by noise | Noise dominated (total time) | Noise dominated (detector-on time) | Marked lightcurve |
|---|---|---|---|---|---|---|---|
| A | 16946 | 15044 | 0 | 0 | 0.00% | 0.00% | 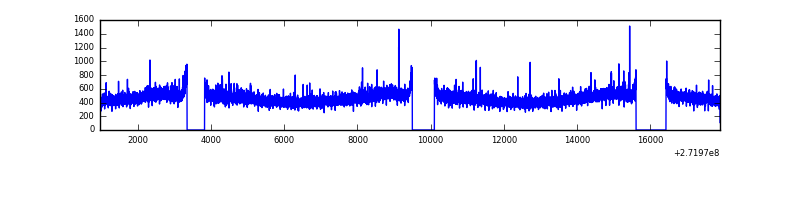 |
| B | 16946 | 15043 | 2 | 2 | 0.01% | 0.01% | 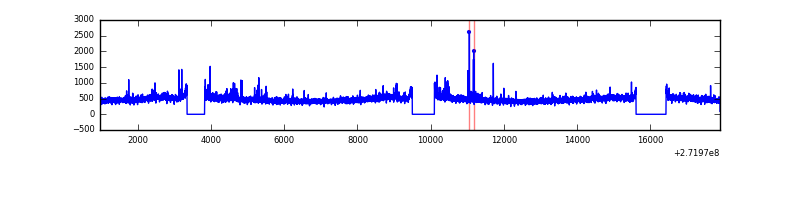 |
| C | 16946 | 15043 | 3 | 3 | 0.02% | 0.02% | 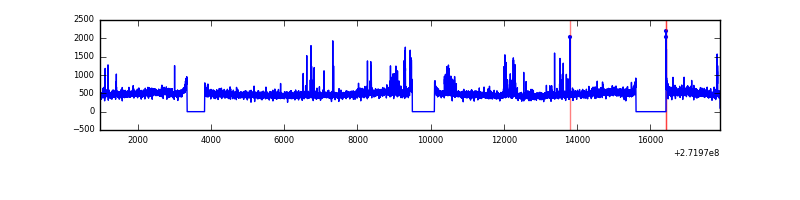 |
| D | 16946 | 15043 | 137 | 137 | 0.81% | 0.91% | 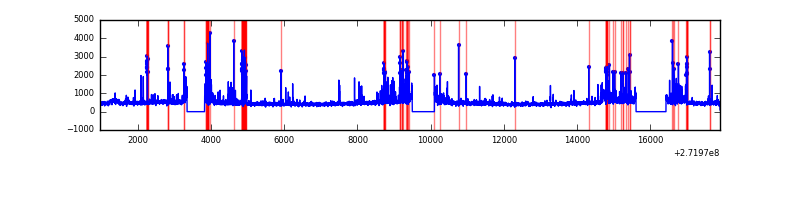 |
Top three noisy pixels from each quadrant. If the there are fewer than three noisy pixels in the level2.evt file, extra rows are filled as -1
| Pixel properties | Quadrant properties | ||||||
|---|---|---|---|---|---|---|---|
| Quadrant | DetID | PixID | Counts | Sigma | Mean | Median | Sigma |
| A | 8 | 247 | 30015 | 78.04 | 1796 | 1755 | 362.1 |
| A | 0 | 226 | 15917 | 39.11 | 1796 | 1755 | 362.1 |
| A | 12 | 194 | 13371 | 32.07 | 1796 | 1755 | 362.1 |
| B | 0 | 189 | 46484 | 130.14 | 1796 | 1749 | 343.7 |
| B | 12 | 111 | 40178 | 111.8 | 1796 | 1749 | 343.7 |
| B | 4 | 216 | 37973 | 105.38 | 1796 | 1749 | 343.7 |
| C | 3 | 233 | 381144 | 941.02 | 1729 | 1739 | 403.2 |
| C | 14 | 238 | 266633 | 657.01 | 1729 | 1739 | 403.2 |
| C | 10 | 22 | 23671 | 54.4 | 1729 | 1739 | 403.2 |
| D | 5 | 222 | 363190 | 799.82 | 1745 | 1701 | 452.0 |
| D | 1 | 52 | 249318 | 547.87 | 1745 | 1701 | 452.0 |
| D | 15 | 0 | 212086 | 465.49 | 1745 | 1701 | 452.0 |
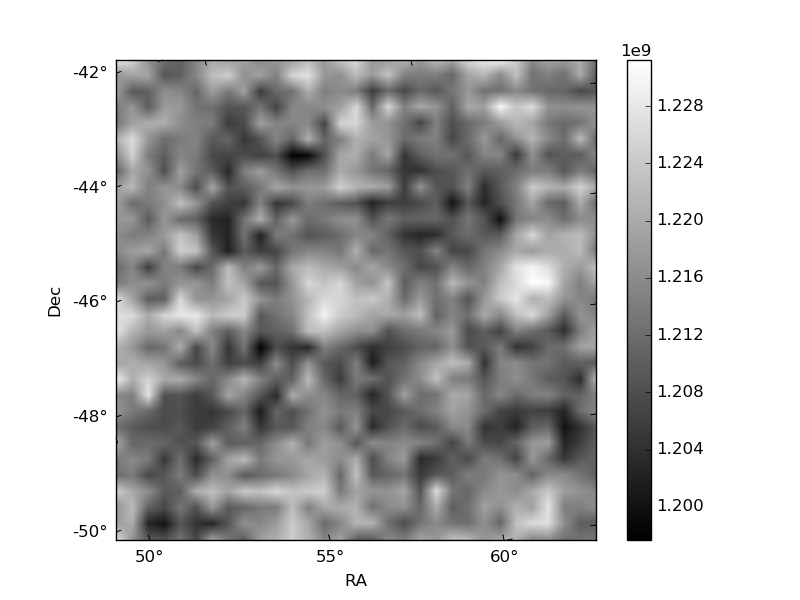
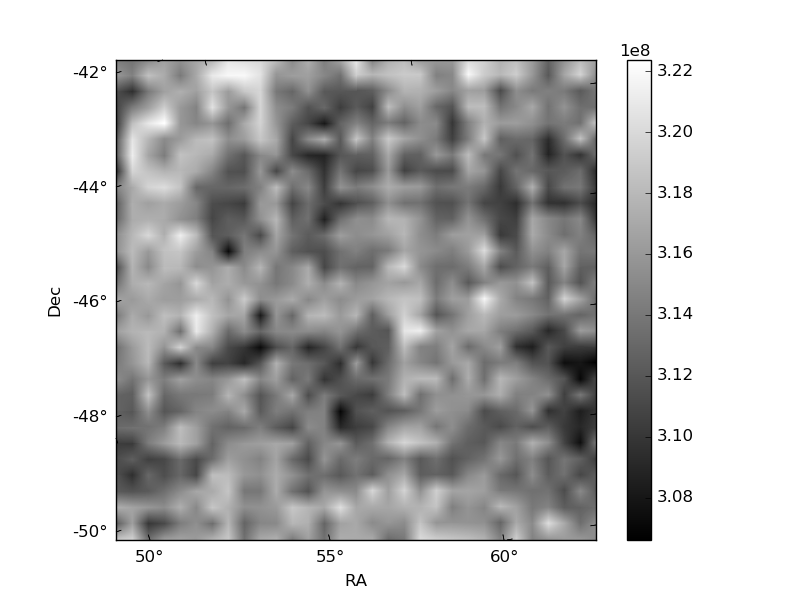
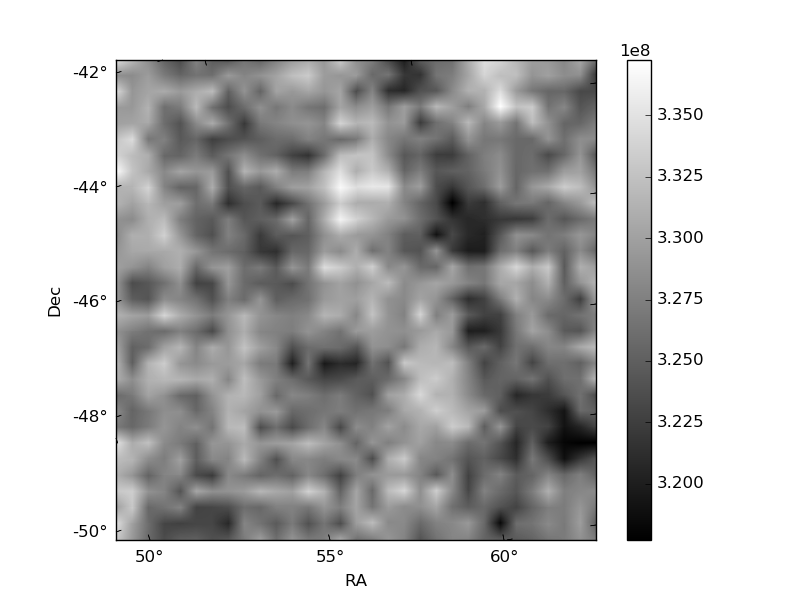
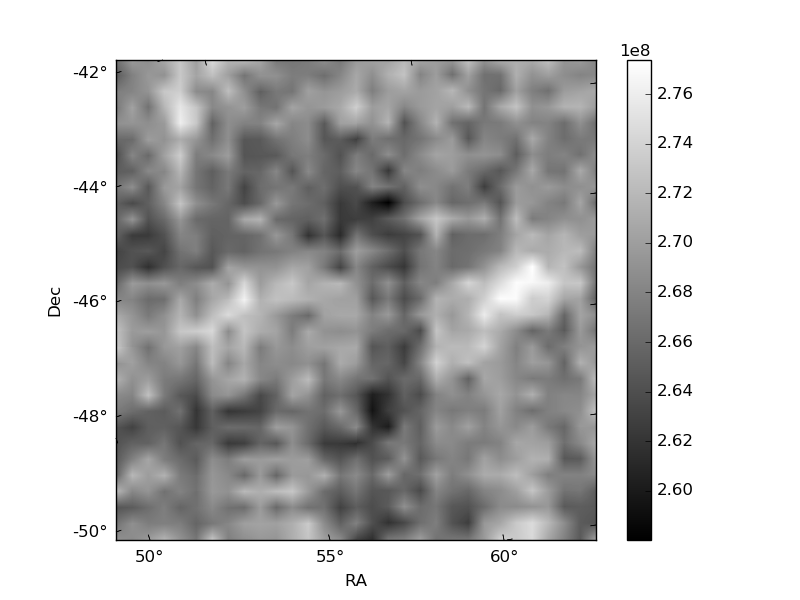
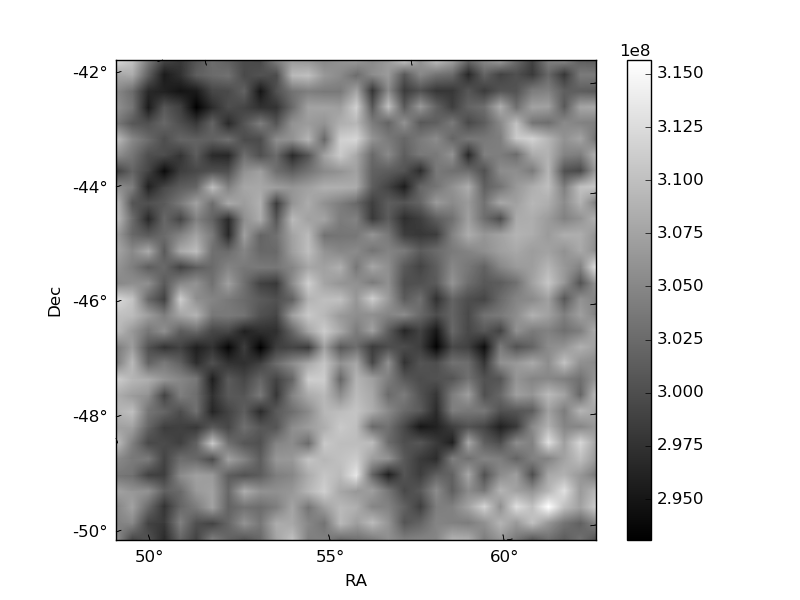
Histogram calculated using DETX and DETY for each event in the final _common_clean file
| Quadrant A | 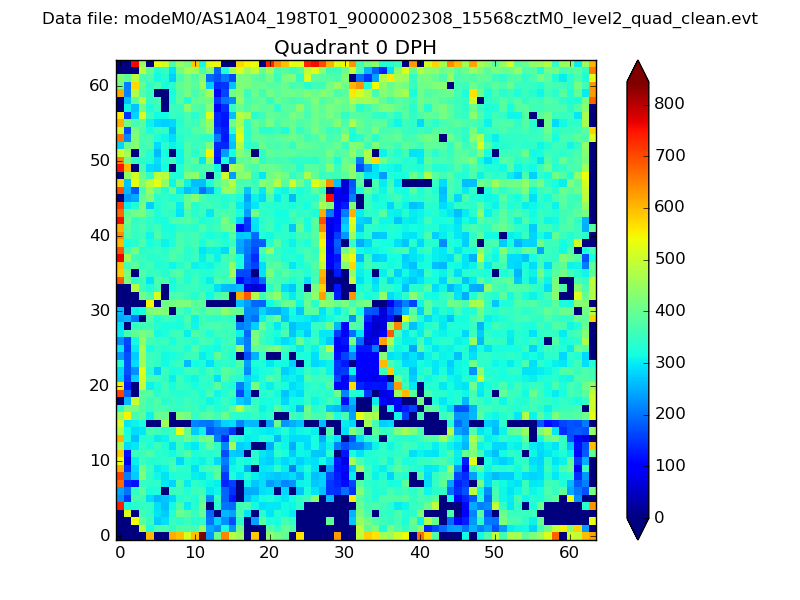 |
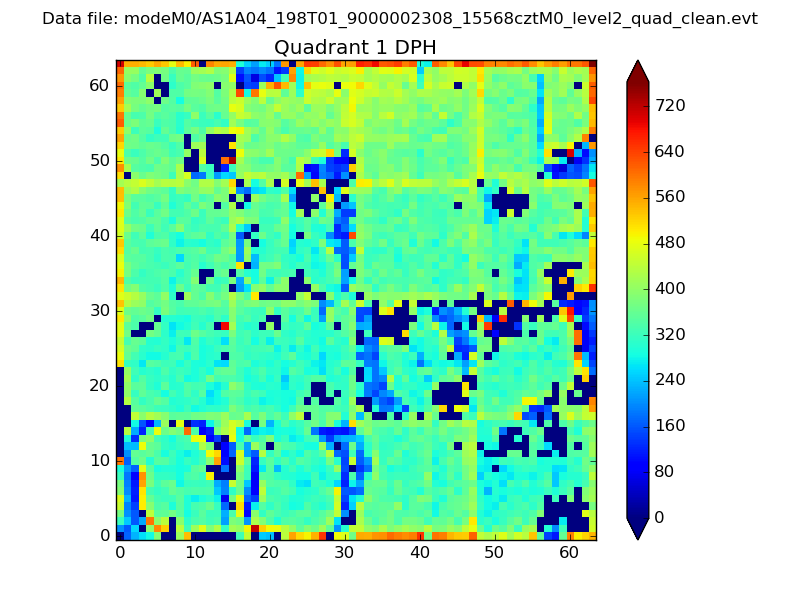 |
Quadrant B |
|---|---|---|---|
| Quadrant D | 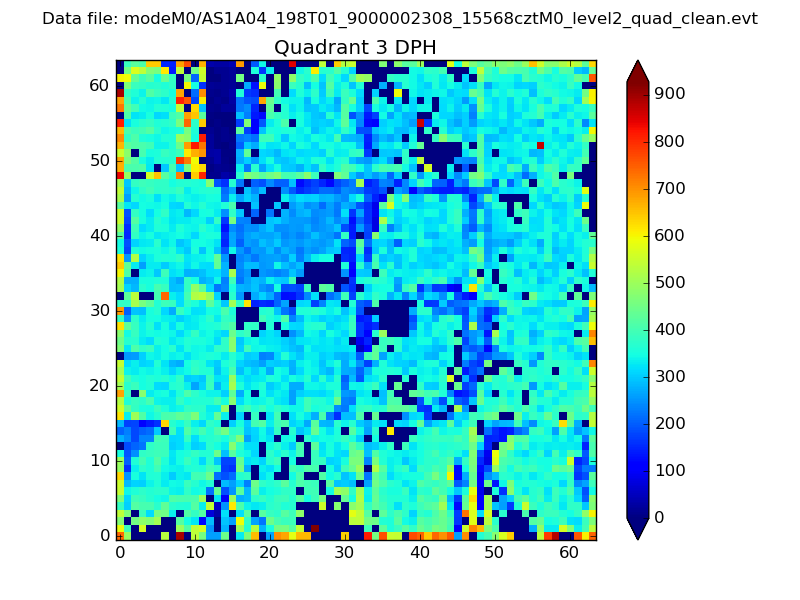 |
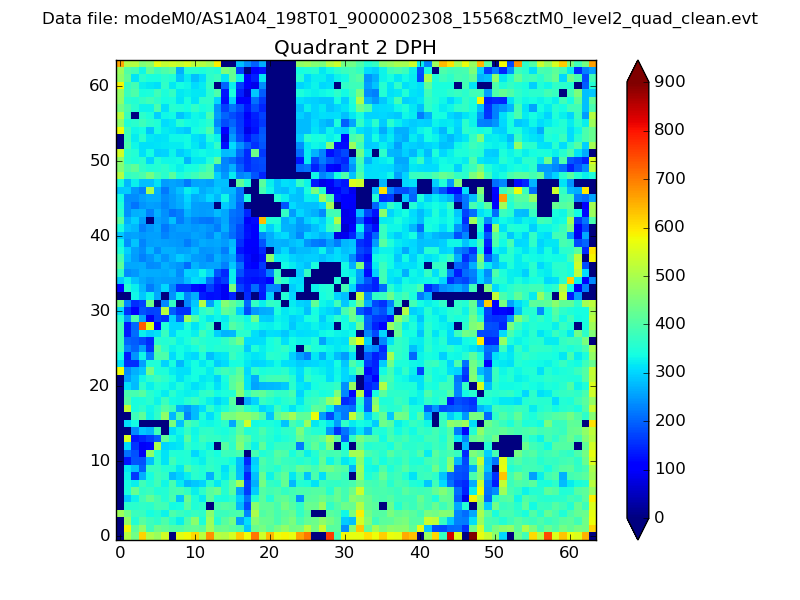 |
Quadrant C |
| Plot type | Count rate plots | Images |
|---|---|---|
| Comparison with Poisson distribution Blue bars denote a histogram of data divided into 1 sec bins. Red curve is a Poisson curve with rate = median count rate of data. |
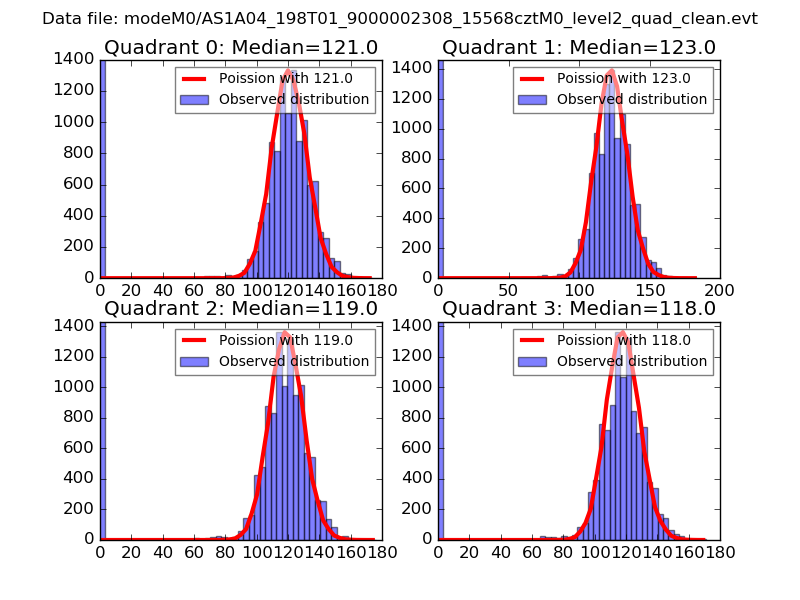 |
 |
| Quadrant-wise count rates Data is divided into 100 sec bins |
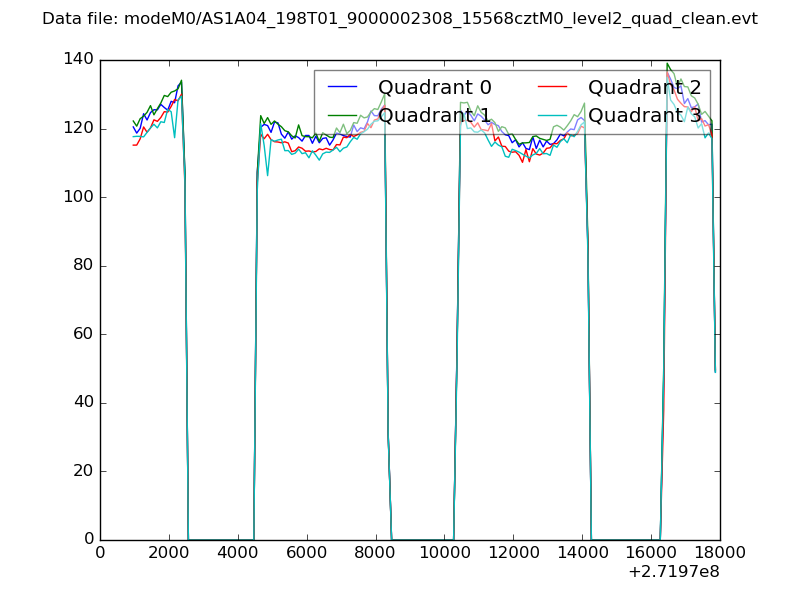 |
|
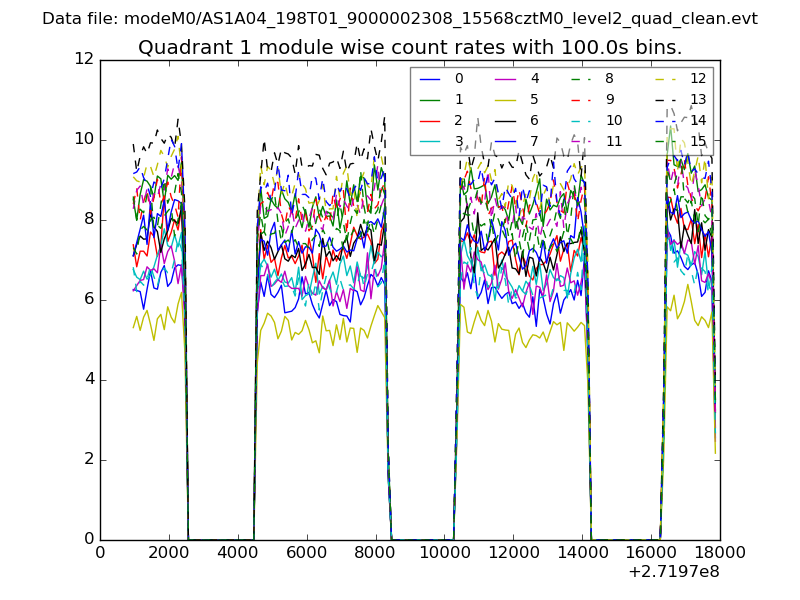
| Module-wise count rates for Quadrant A Data is divided into 100 sec bins |
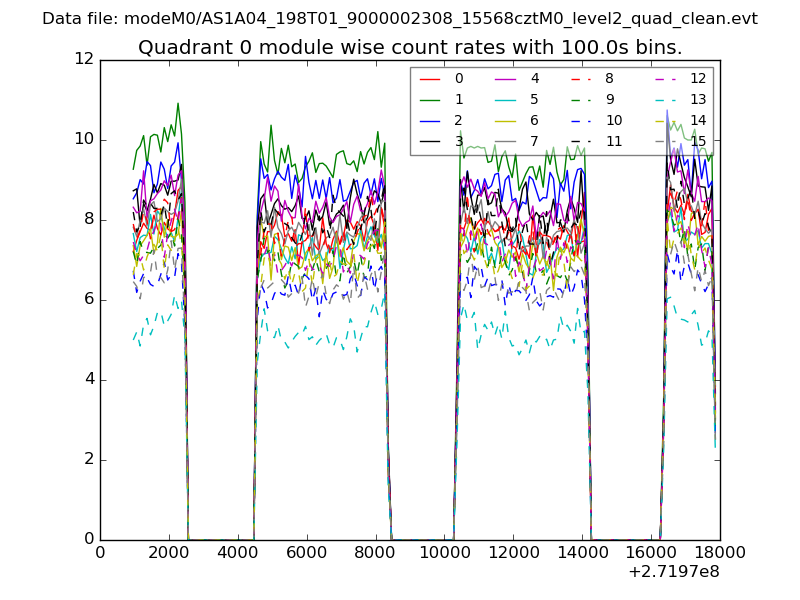 |
 |
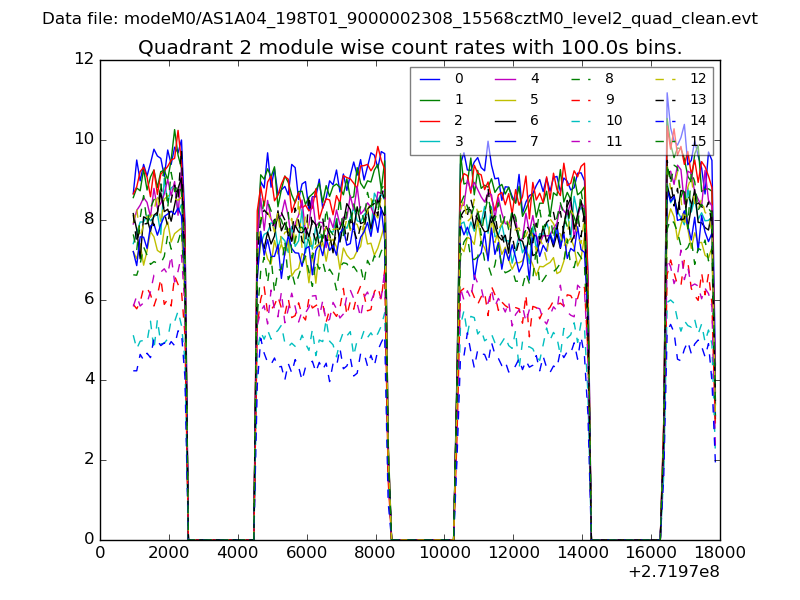
| Module-wise count rates for Quadrant B Data is divided into 100 sec bins |
 |
 |
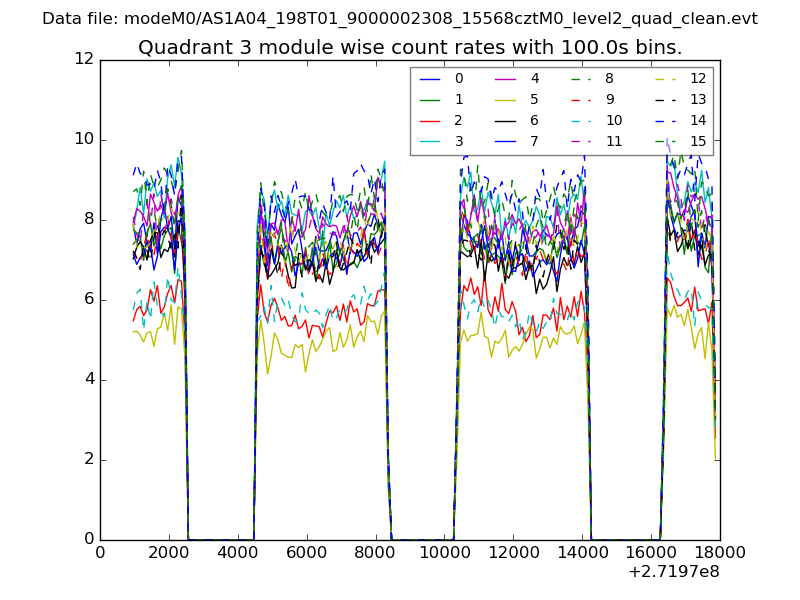
| Module-wise count rates for Quadrant C Data is divided into 100 sec bins |
 |
 |
| Module-wise count rates for Quadrant D Data is divided into 100 sec bins |
 |
 |
| Parameter | Plot |
|---|---|
| CZT HV Monitor | 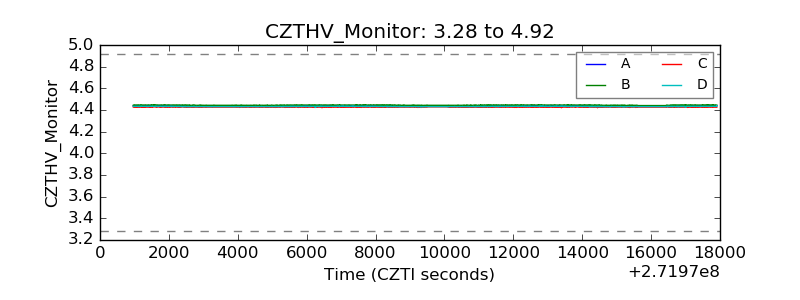 |
| D_VDD | 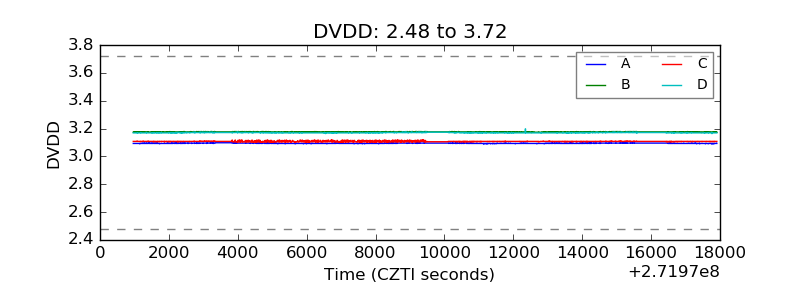 |
| Temperature 1 | 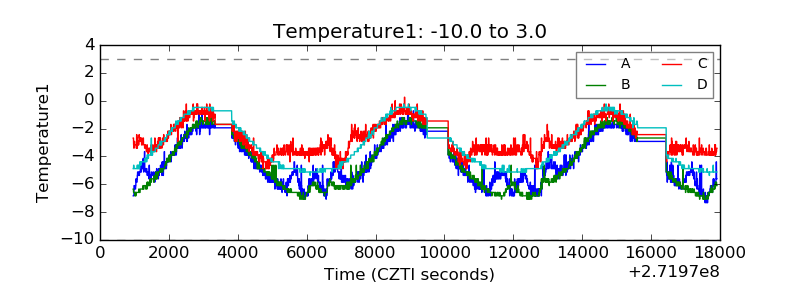 |
| Veto HV Monitor | 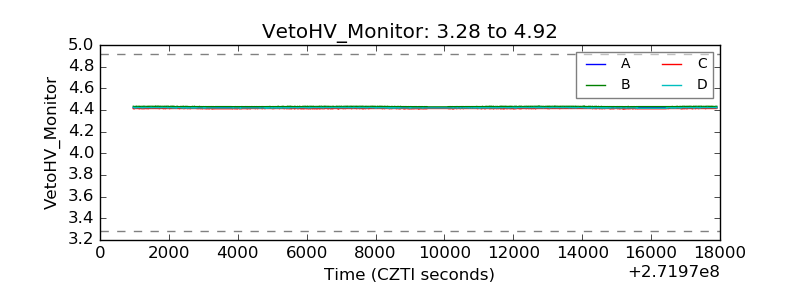 |
| Veto LLD | 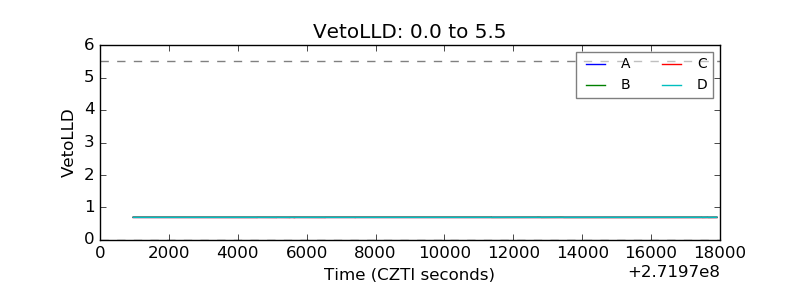 |
| Alpha Counter | 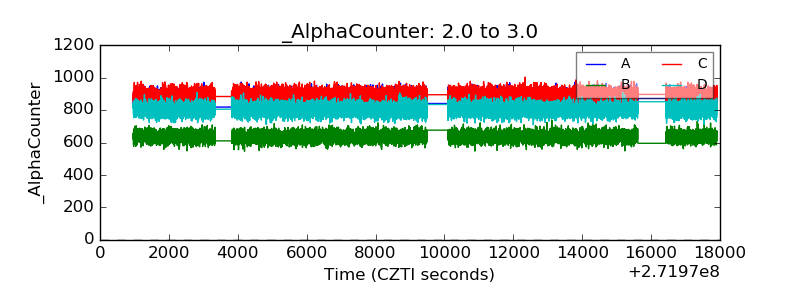 |
| _CPM_Rate | 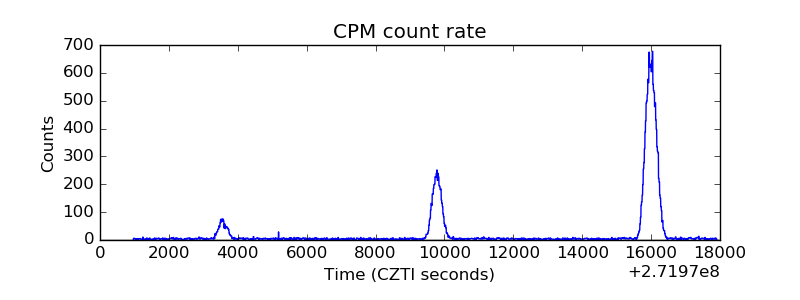 |
| CZT Counter | 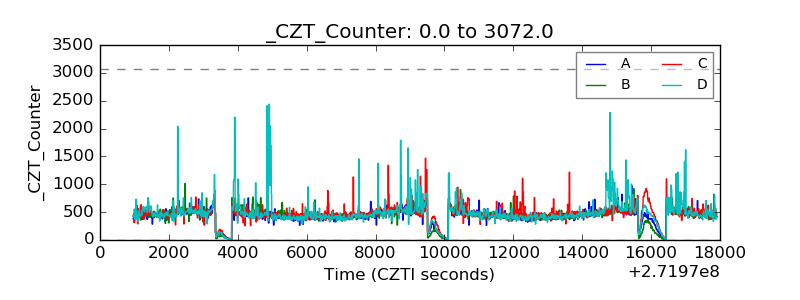 |
| +2.5 Volts monitor |  |
| +5 Volts monitor |  |
| _ROLL_ROT | 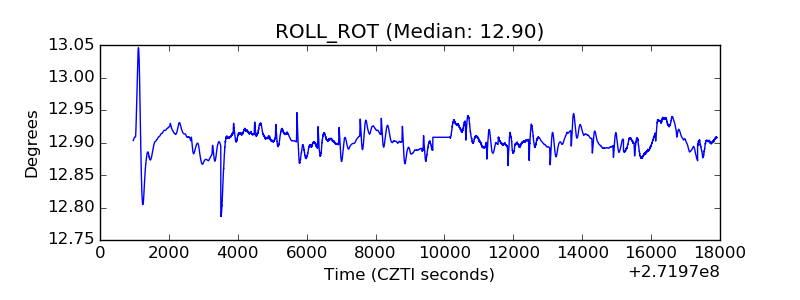 |
| _Roll_DEC | 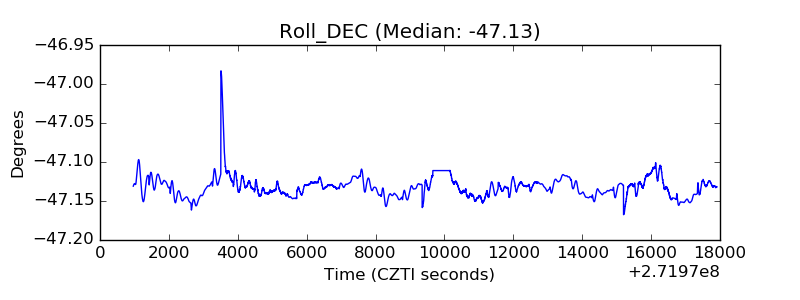 |
| _Roll_RA | 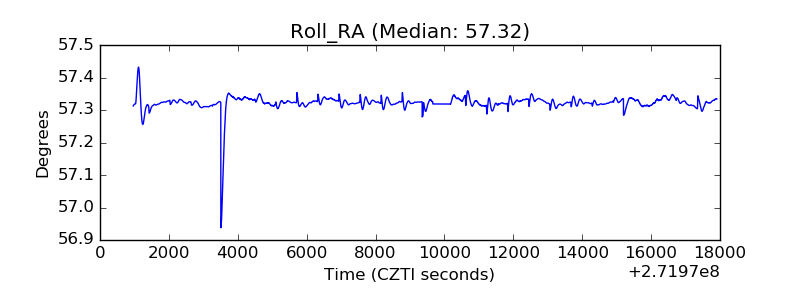 |
| Veto Counter | 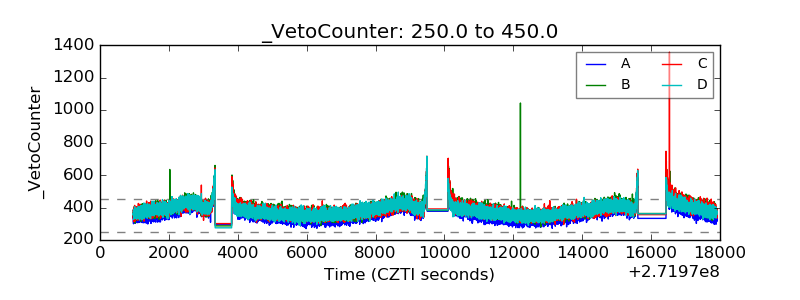 |