| Param | Original file | Final file |
|---|---|---|
| Filename | modeM0/AS1A04_198T01_9000002308_15569cztM0_level2.evt | modeM0/AS1A04_198T01_9000002308_15569cztM0_level2_quad_clean.evt |
| Size (bytes) | 457,136,640 | 98,830,080 |
| Size | 436.0 MB | 94.3 MB |
| Events in quadrant A | 3,157,122 | 633,377 |
| Events in quadrant B | 3,222,972 | 647,590 |
| Events in quadrant C | 3,285,166 | 628,234 |
| Events in quadrant D | 3,723,782 | 616,677 |
| Mode M0 | |||
|---|---|---|---|
| Quadrant | BADHDUFLAG | Total packets | Discarded packets |
| A | 0 | 13879 | 3 |
| B | 0 | 13854 | 2 |
| C | 0 | 13875 | 2 |
| D | 0 | 15561 | 2 |
| Mode SS | |||
|---|---|---|---|
| Quadrant | BADHDUFLAG | Total packets | Discarded packets |
| A | 0 | 136 | 0 |
| B | 0 | 136 | 0 |
| C | 0 | 136 | 0 |
| D | 0 | 136 | 0 |
| Mode M9 | |||
|---|---|---|---|
| Quadrant | BADHDUFLAG | Total packets | Discarded packets |
| A | 0 | 14 | 0 |
| B | 0 | 14 | 0 |
| C | 0 | 14 | 0 |
| D | 0 | 15 | 0 |
| Quadrant | Total seconds | Saturated seconds | Saturation percentage |
|---|---|---|---|
| A | 6701 | 12 | 0.179078% |
| B | 6701 | 23 | 0.343232% |
| C | 6701 | 52 | 0.776004% |
| D | 6701 | 72 | 1.074466% |
Noise dominated data is calculated using 1-second bins in cleaned event files. If a bin has >2000 counts, and if more than 50% of those come from <1% of pixels, then it is considered to be noise-dominated and hence unusable.
| Quadrant | # 1 sec bins | Bins with >0 counts | Bins with >2000 counts | High rate bins dominated by noise | Noise dominated (total time) | Noise dominated (detector-on time) | Marked lightcurve |
|---|---|---|---|---|---|---|---|
| A | 7707 | 6703 | 1 | 1 | 0.01% | 0.01% |  |
| B | 7707 | 6703 | 4 | 4 | 0.05% | 0.06% | 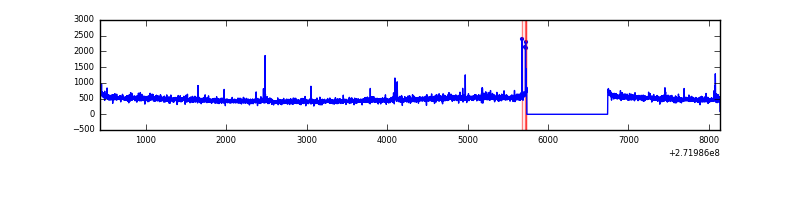 |
| C | 7707 | 6703 | 2 | 2 | 0.03% | 0.03% | 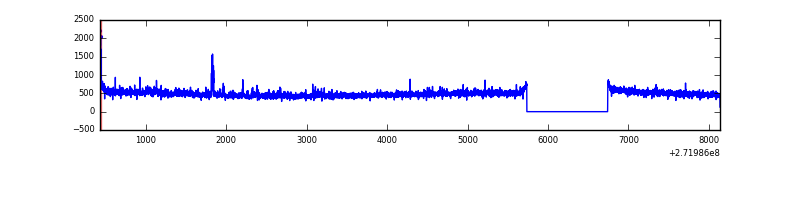 |
| D | 7707 | 6703 | 49 | 49 | 0.64% | 0.73% | 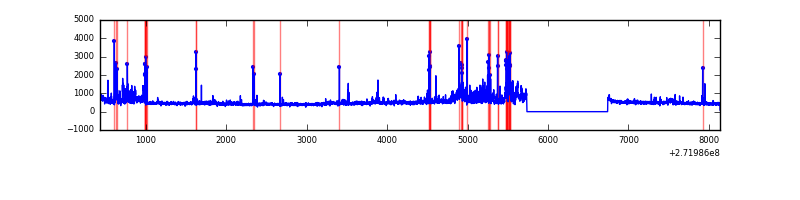 |
Top three noisy pixels from each quadrant. If the there are fewer than three noisy pixels in the level2.evt file, extra rows are filled as -1
| Pixel properties | Quadrant properties | ||||||
|---|---|---|---|---|---|---|---|
| Quadrant | DetID | PixID | Counts | Sigma | Mean | Median | Sigma |
| A | 14 | 238 | 72344 | 437.66 | 800 | 783 | 163.5 |
| A | 0 | 226 | 6991 | 37.97 | 800 | 783 | 163.5 |
| A | 3 | 80 | 6234 | 33.34 | 800 | 783 | 163.5 |
| B | 4 | 173 | 19578 | 122.02 | 805 | 784 | 154.0 |
| B | 12 | 111 | 18093 | 112.38 | 805 | 784 | 154.0 |
| B | 11 | 111 | 15474 | 95.38 | 805 | 784 | 154.0 |
| C | 14 | 238 | 120533 | 652.4 | 781 | 785 | 183.6 |
| C | 3 | 233 | 116024 | 627.83 | 781 | 785 | 183.6 |
| C | 13 | 61 | 5623 | 26.36 | 781 | 785 | 183.6 |
| D | 1 | 52 | 398244 | 2072.98 | 787 | 764 | 191.7 |
| D | 7 | 223 | 98926 | 511.94 | 787 | 764 | 191.7 |
| D | 7 | 38 | 83706 | 432.57 | 787 | 764 | 191.7 |
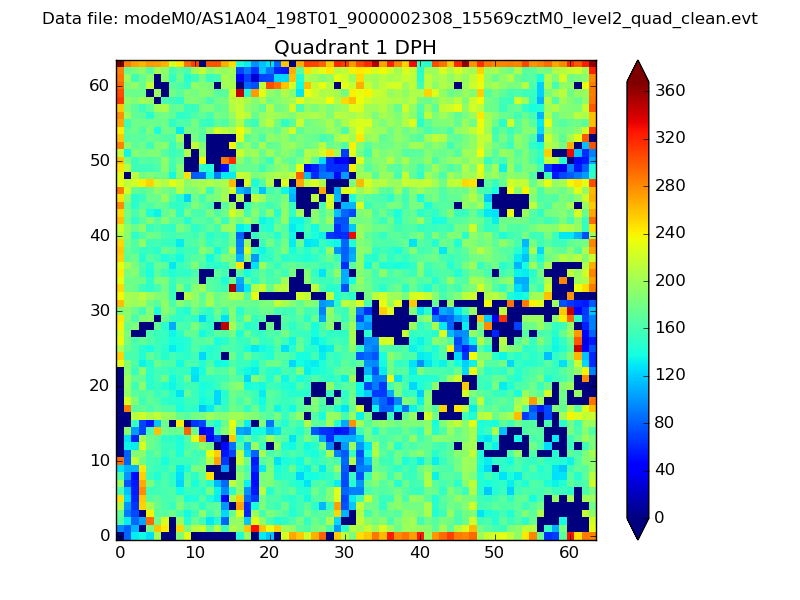
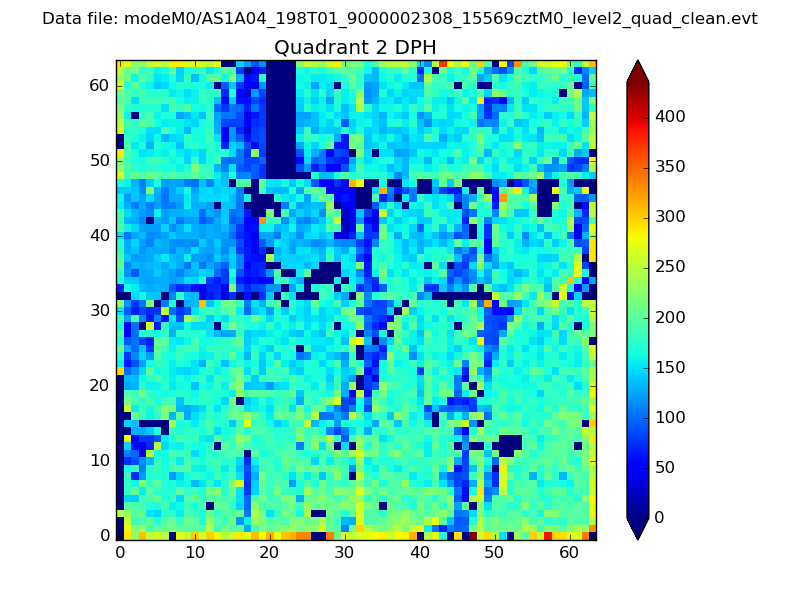
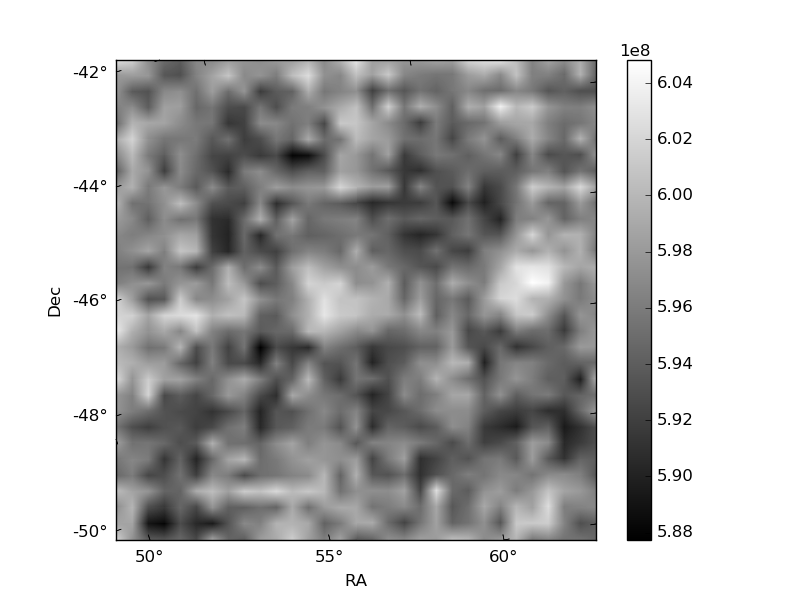
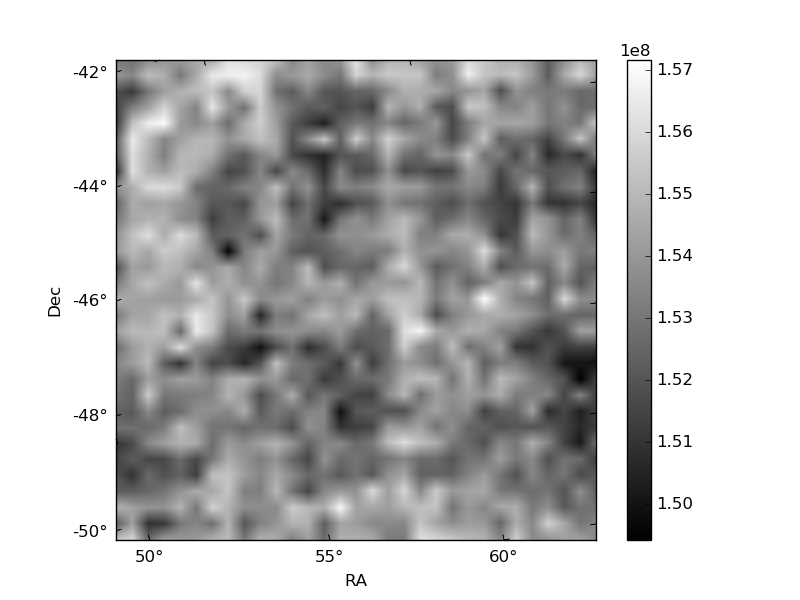
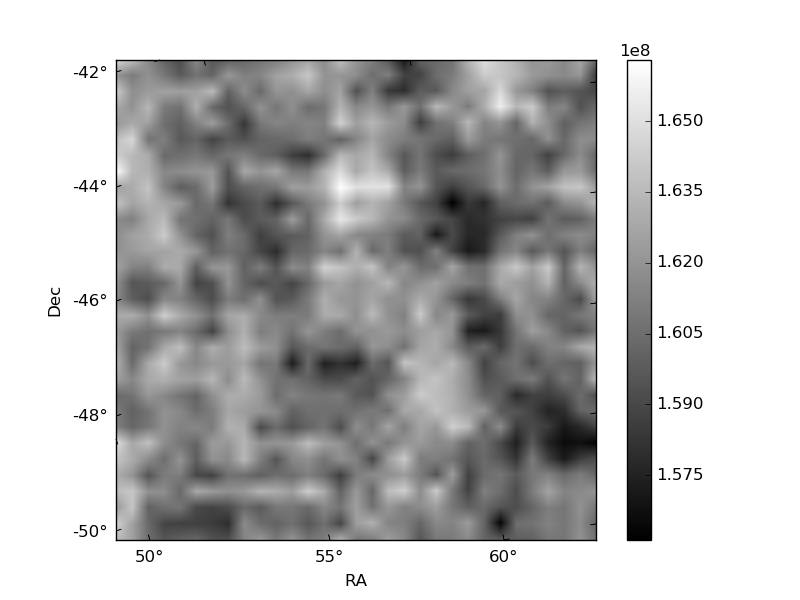
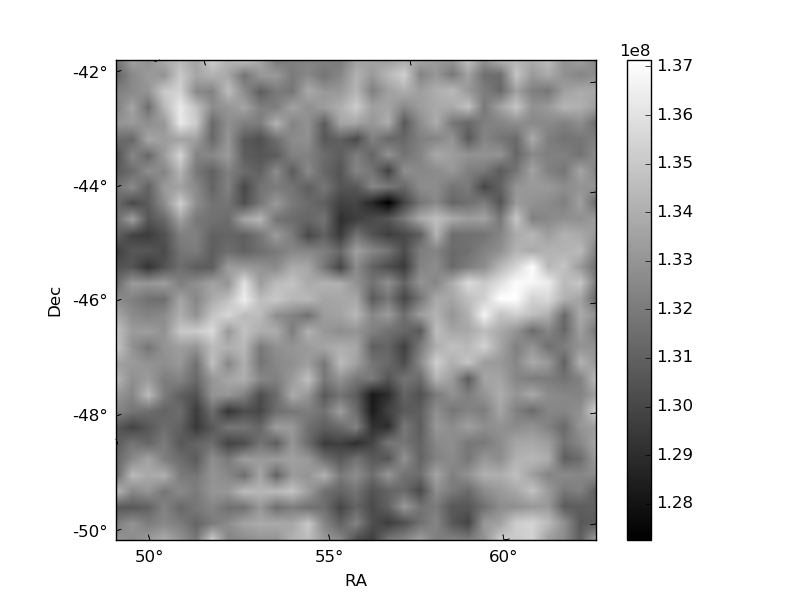
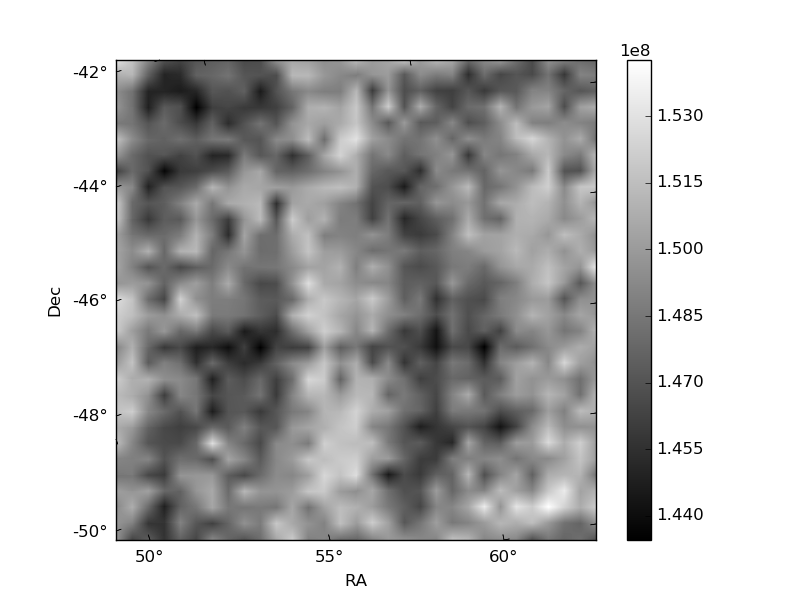
Histogram calculated using DETX and DETY for each event in the final _common_clean file
| Quadrant A | 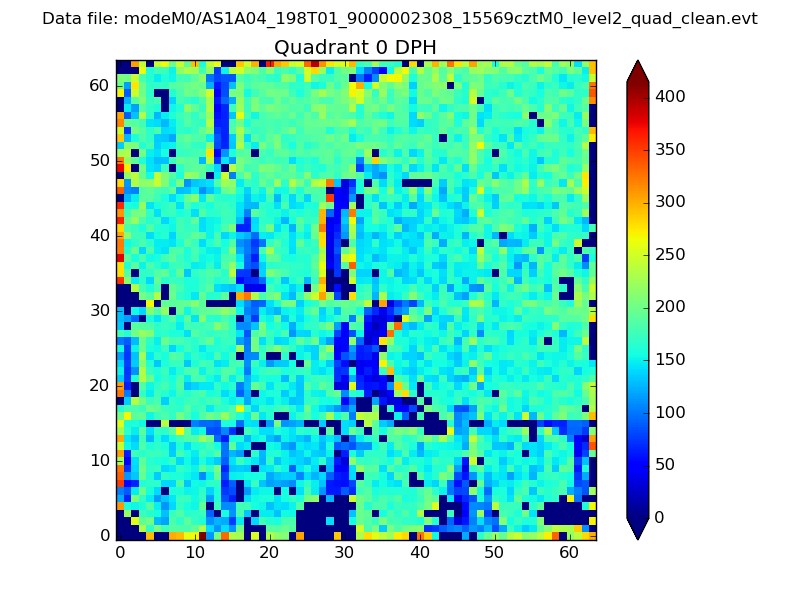 |
 |
Quadrant B |
|---|---|---|---|
| Quadrant D | 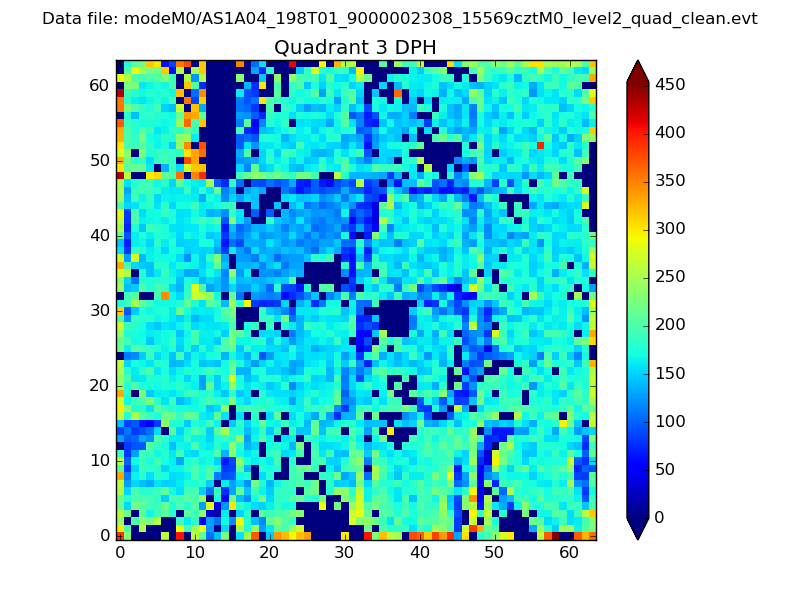 |
 |
Quadrant C |
| Plot type | Count rate plots | Images |
|---|---|---|
| Comparison with Poisson distribution Blue bars denote a histogram of data divided into 1 sec bins. Red curve is a Poisson curve with rate = median count rate of data. |
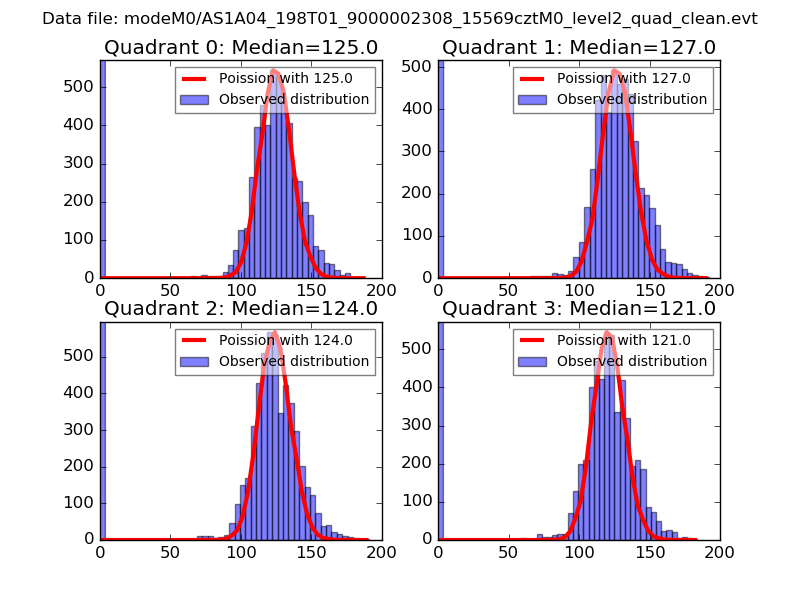 |
 |
| Quadrant-wise count rates Data is divided into 100 sec bins |
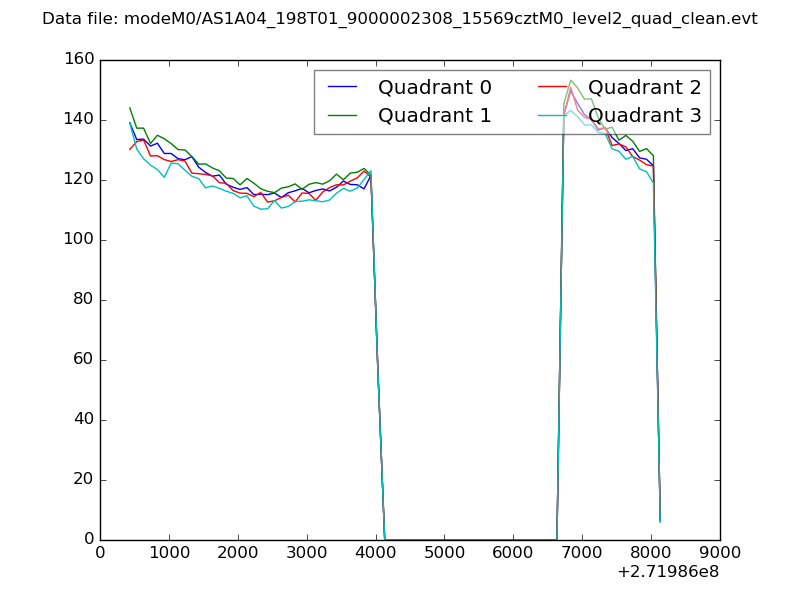 |
|
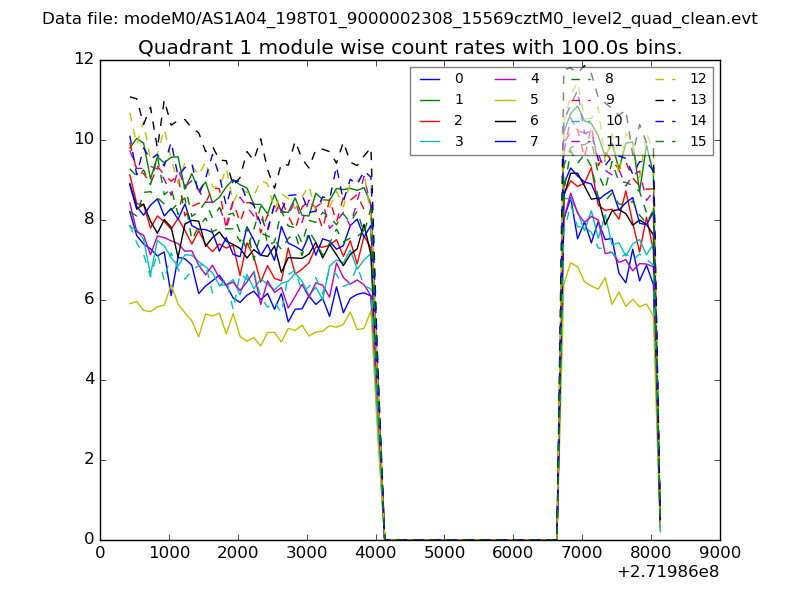
| Module-wise count rates for Quadrant A Data is divided into 100 sec bins |
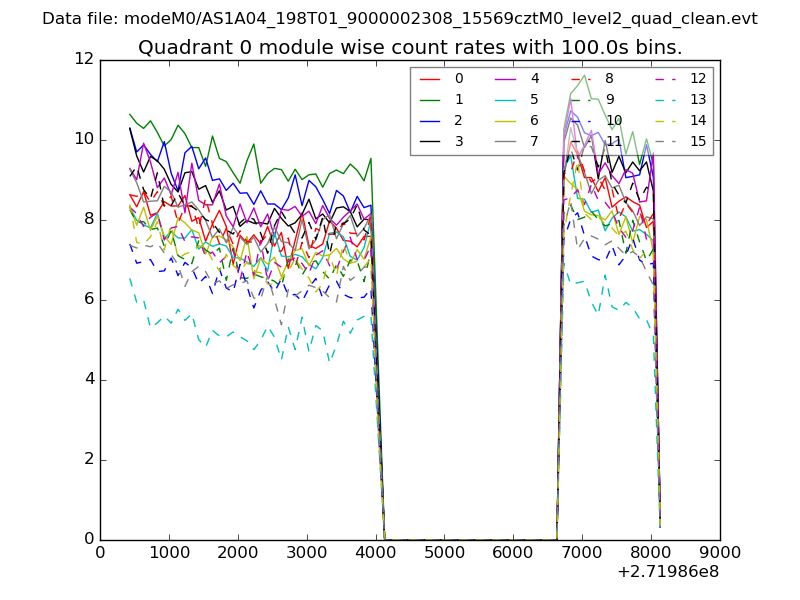 |
 |
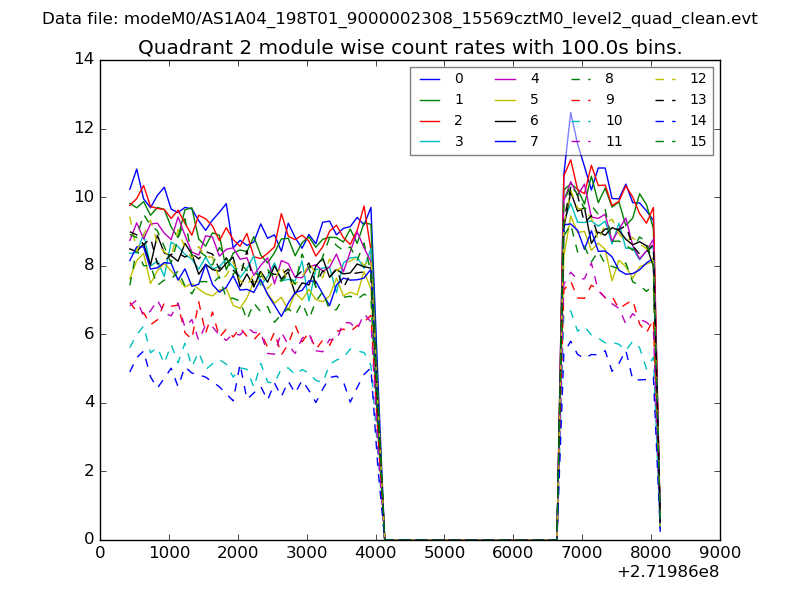
| Module-wise count rates for Quadrant B Data is divided into 100 sec bins |
 |
 |
| Module-wise count rates for Quadrant C Data is divided into 100 sec bins |
 |
 |
| Module-wise count rates for Quadrant D Data is divided into 100 sec bins |
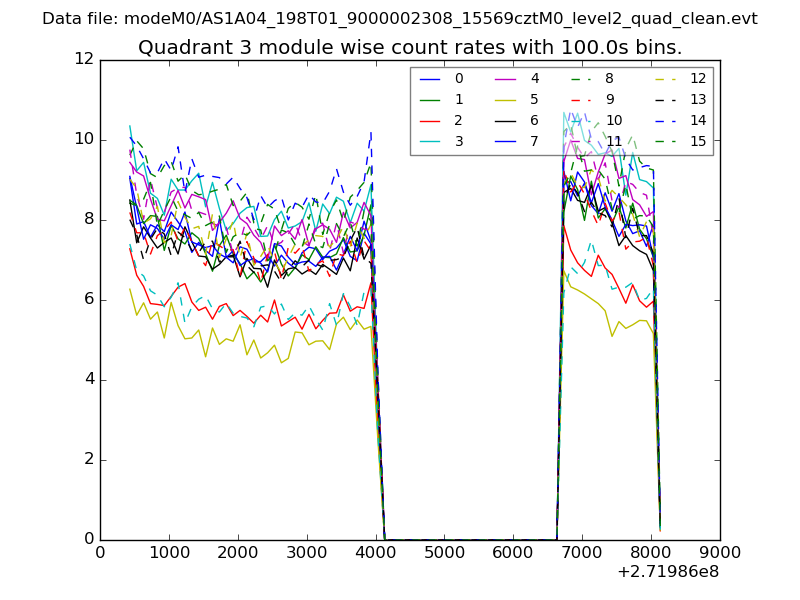 |
 |
| Parameter | Plot |
|---|---|
| CZT HV Monitor | 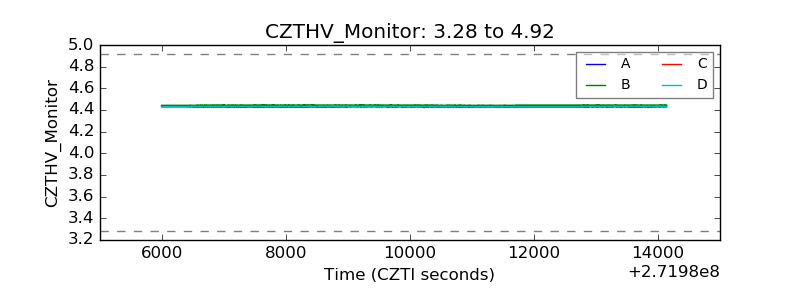 |
| D_VDD | 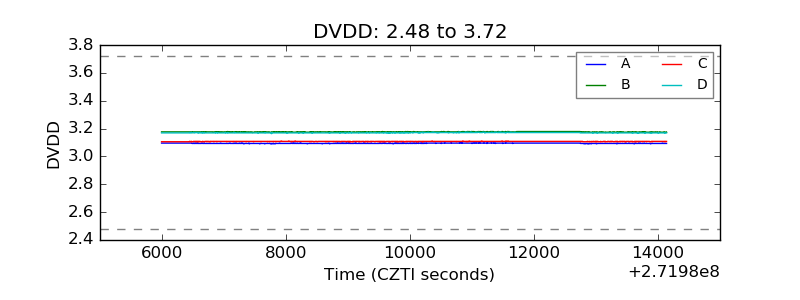 |
| Temperature 1 | 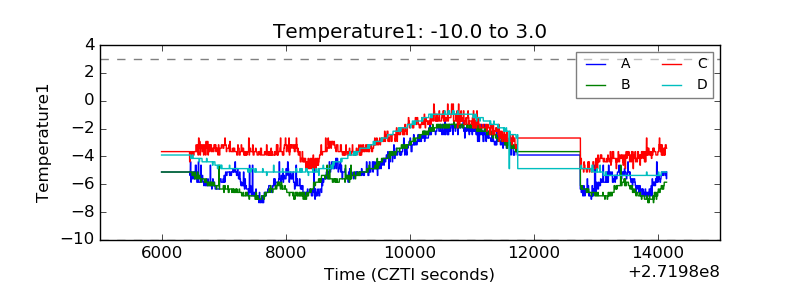 |
| Veto HV Monitor | 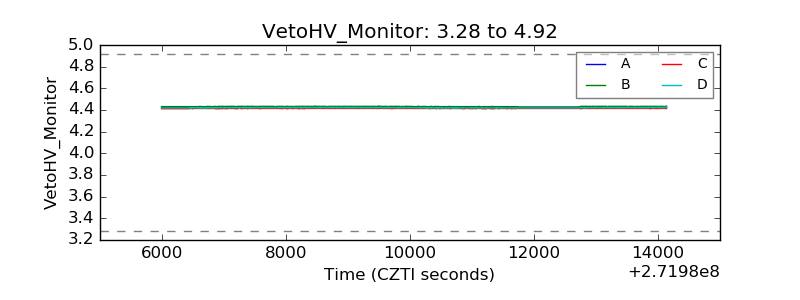 |
| Veto LLD | 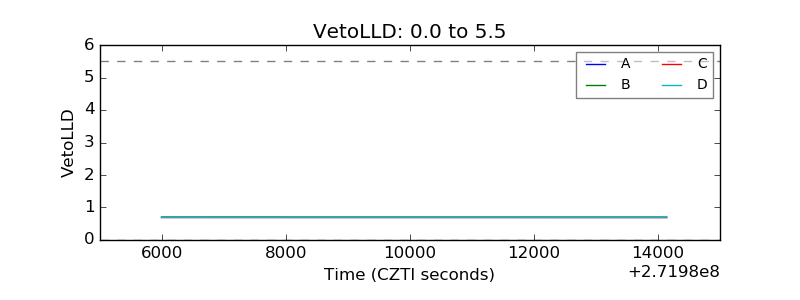 |
| Alpha Counter | 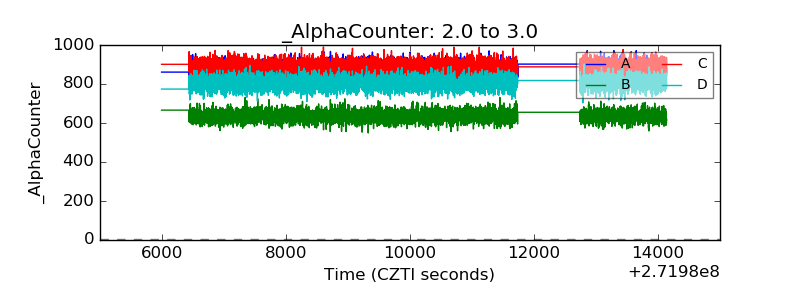 |
| _CPM_Rate | 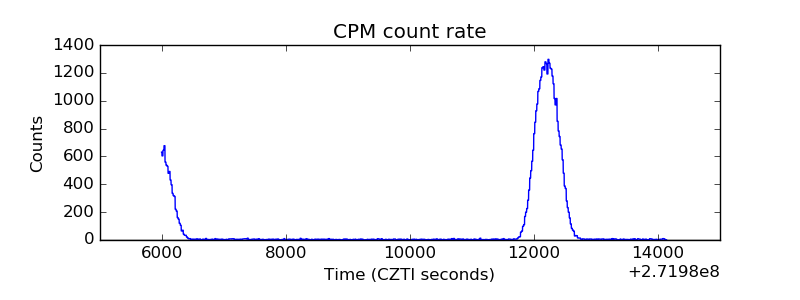 |
| CZT Counter | 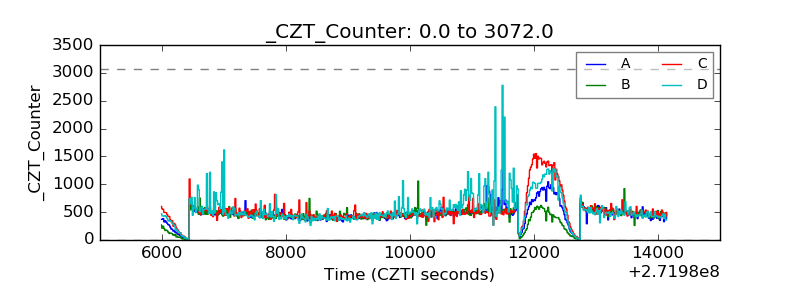 |
| +2.5 Volts monitor |  |
| +5 Volts monitor | 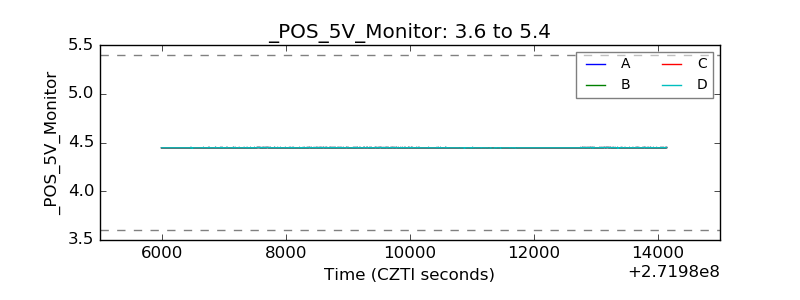 |
| _ROLL_ROT | 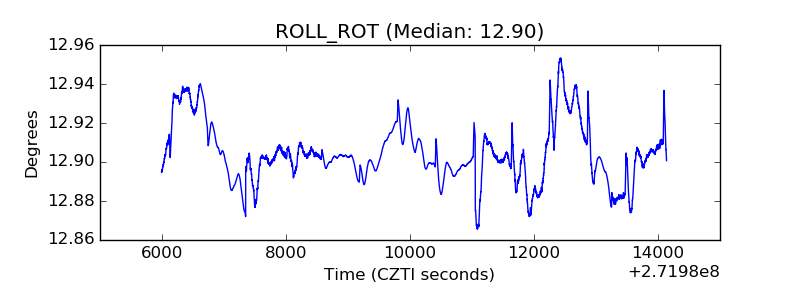 |
| _Roll_DEC | 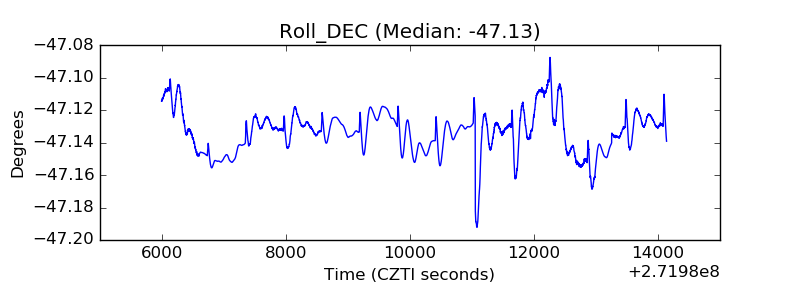 |
| _Roll_RA | 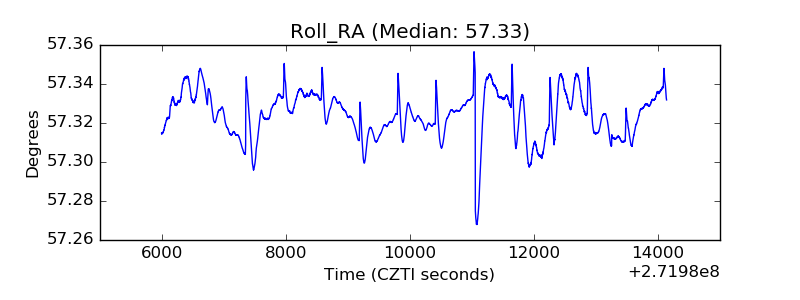 |
| Veto Counter | 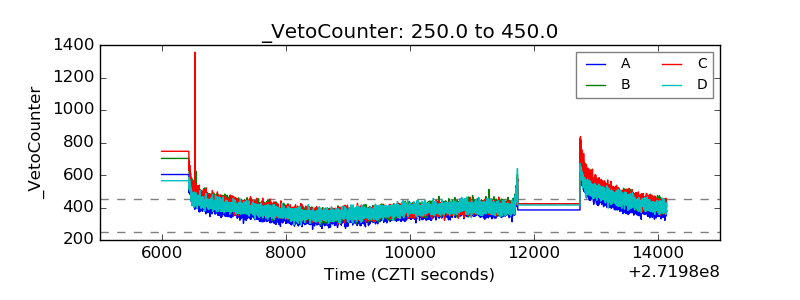 |