| Param | Original file | Final file |
|---|---|---|
| Filename | modeM0/AS1A04_198T01_9000002308_15571cztM0_level2.evt | modeM0/AS1A04_198T01_9000002308_15571cztM0_level2_quad_clean.evt |
| Size (bytes) | 458,092,800 | 94,780,800 |
| Size | 436.9 MB | 90.4 MB |
| Events in quadrant A | 3,220,989 | 600,692 |
| Events in quadrant B | 3,284,124 | 618,215 |
| Events in quadrant C | 3,439,634 | 603,566 |
| Events in quadrant D | 3,481,632 | 589,281 |
| Mode M0 | |||
|---|---|---|---|
| Quadrant | BADHDUFLAG | Total packets | Discarded packets |
| A | 0 | 13854 | 3 |
| B | 0 | 13879 | 2 |
| C | 0 | 14306 | 2 |
| D | 0 | 14630 | 2 |
| Mode SS | |||
|---|---|---|---|
| Quadrant | BADHDUFLAG | Total packets | Discarded packets |
| A | 0 | 134 | 0 |
| B | 0 | 134 | 0 |
| C | 0 | 134 | 0 |
| D | 0 | 134 | 0 |
| Mode M9 | |||
|---|---|---|---|
| Quadrant | BADHDUFLAG | Total packets | Discarded packets |
| A | 0 | 22 | 0 |
| B | 0 | 22 | 0 |
| C | 0 | 22 | 0 |
| D | 0 | 22 | 0 |
| Quadrant | Total seconds | Saturated seconds | Saturation percentage |
|---|---|---|---|
| A | 6583 | 33 | 0.501291% |
| B | 6583 | 37 | 0.562054% |
| C | 6583 | 153 | 2.324168% |
| D | 6583 | 62 | 0.941820% |
Noise dominated data is calculated using 1-second bins in cleaned event files. If a bin has >2000 counts, and if more than 50% of those come from <1% of pixels, then it is considered to be noise-dominated and hence unusable.
| Quadrant | # 1 sec bins | Bins with >0 counts | Bins with >2000 counts | High rate bins dominated by noise | Noise dominated (total time) | Noise dominated (detector-on time) | Marked lightcurve |
|---|---|---|---|---|---|---|---|
| A | 8724 | 6586 | 11 | 11 | 0.13% | 0.17% | 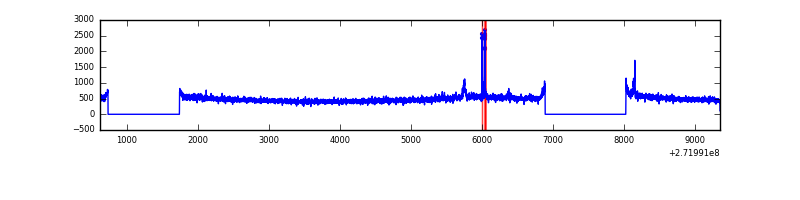 |
| B | 8724 | 6585 | 5 | 5 | 0.06% | 0.08% |  |
| C | 8724 | 6586 | 38 | 38 | 0.44% | 0.58% |  |
| D | 8724 | 6586 | 44 | 44 | 0.50% | 0.67% | 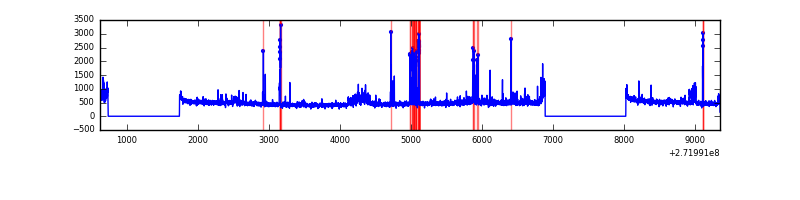 |
Top three noisy pixels from each quadrant. If the there are fewer than three noisy pixels in the level2.evt file, extra rows are filled as -1
| Pixel properties | Quadrant properties | ||||||
|---|---|---|---|---|---|---|---|
| Quadrant | DetID | PixID | Counts | Sigma | Mean | Median | Sigma |
| A | 14 | 238 | 86416 | 531.1 | 805 | 790 | 161.2 |
| A | 13 | 248 | 32161 | 194.58 | 805 | 790 | 161.2 |
| A | 0 | 226 | 7056 | 38.87 | 805 | 790 | 161.2 |
| B | 5 | 65 | 55807 | 355.3 | 812 | 791 | 154.8 |
| B | 12 | 111 | 17704 | 109.23 | 812 | 791 | 154.8 |
| B | 4 | 173 | 15328 | 93.88 | 812 | 791 | 154.8 |
| C | 3 | 233 | 225928 | 1222.15 | 790 | 796 | 184.2 |
| C | 14 | 238 | 121860 | 657.21 | 790 | 796 | 184.2 |
| C | 0 | 207 | 10257 | 51.36 | 790 | 796 | 184.2 |
| D | 5 | 222 | 189097 | 970.5 | 801 | 778 | 194.0 |
| D | 10 | 70 | 67621 | 344.47 | 801 | 778 | 194.0 |
| D | 13 | 249 | 64529 | 328.54 | 801 | 778 | 194.0 |
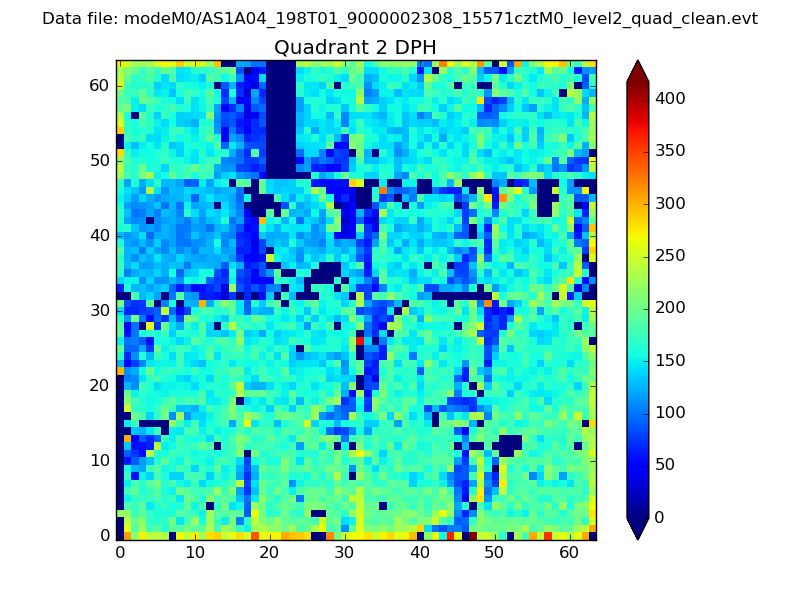
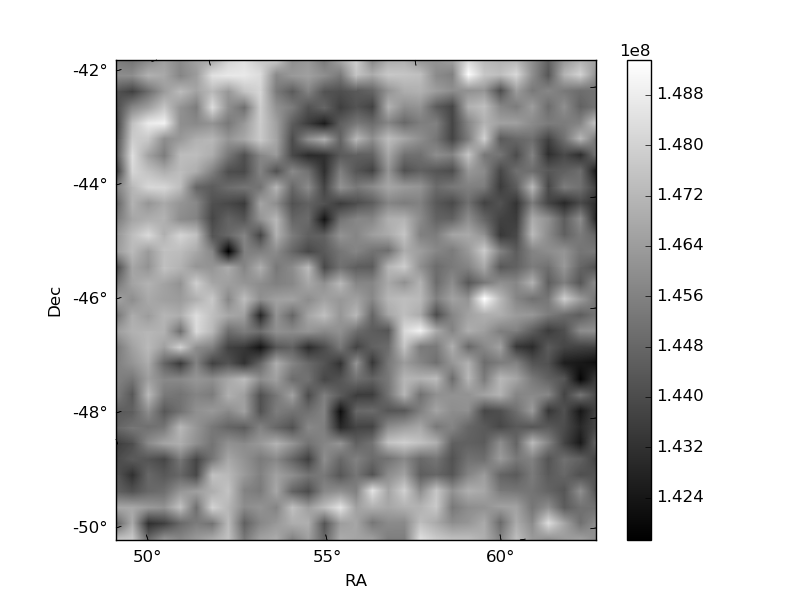
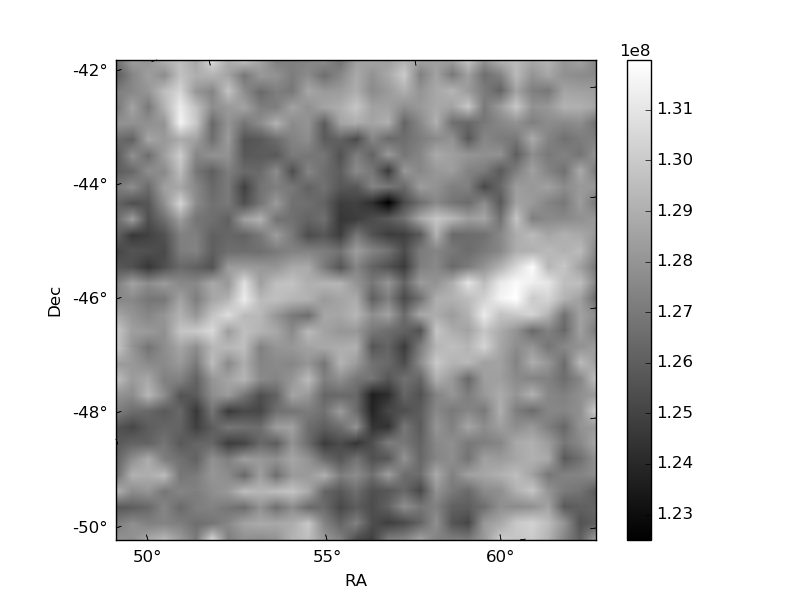
Histogram calculated using DETX and DETY for each event in the final _common_clean file
| Quadrant A | 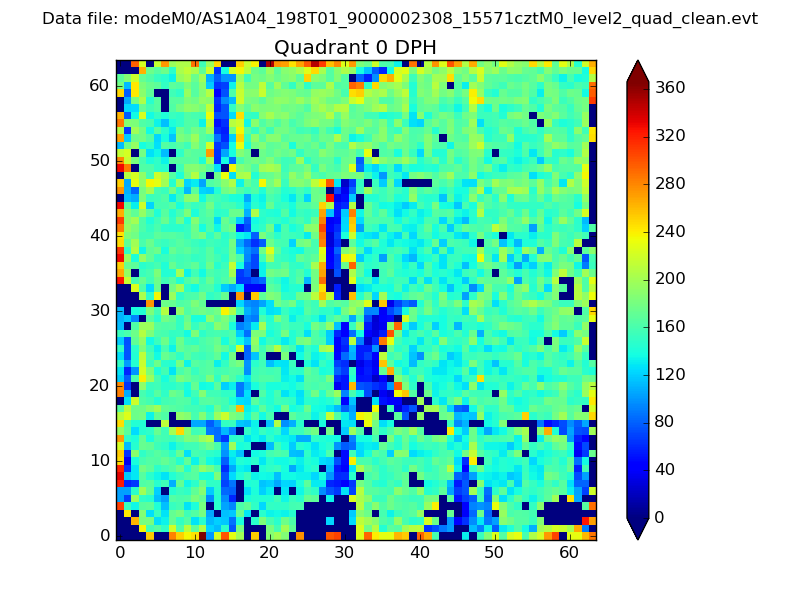 |
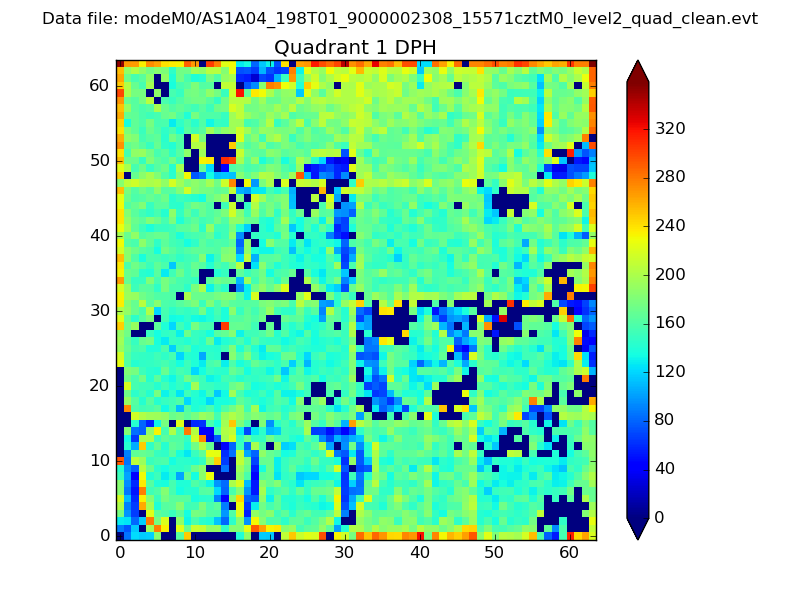 |
Quadrant B |
|---|---|---|---|
| Quadrant D | 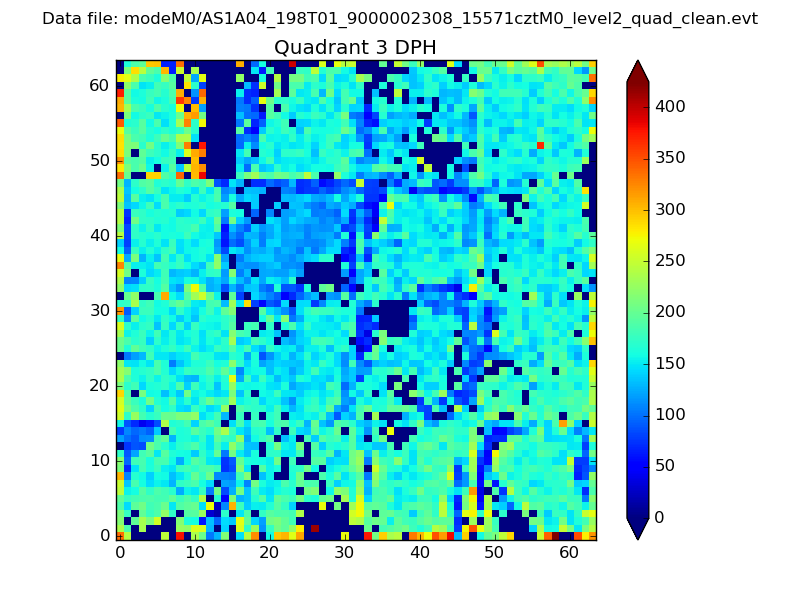 |
 |
Quadrant C |
| Plot type | Count rate plots | Images |
|---|---|---|
| Comparison with Poisson distribution Blue bars denote a histogram of data divided into 1 sec bins. Red curve is a Poisson curve with rate = median count rate of data. |
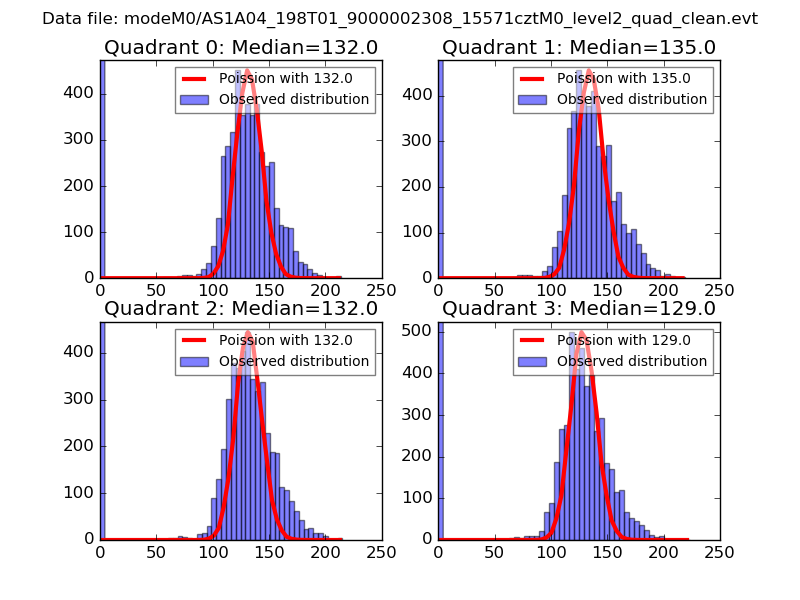 |
 |
| Quadrant-wise count rates Data is divided into 100 sec bins |
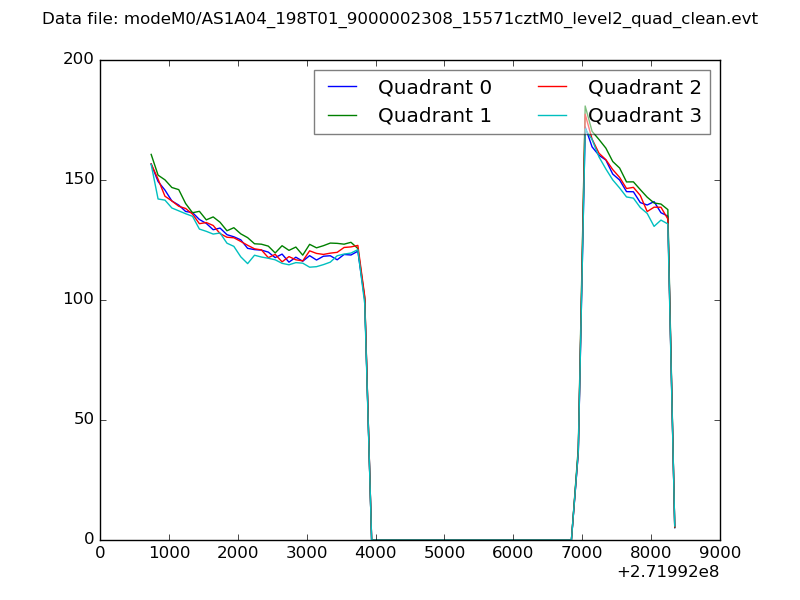 |
|
| Module-wise count rates for Quadrant A Data is divided into 100 sec bins |
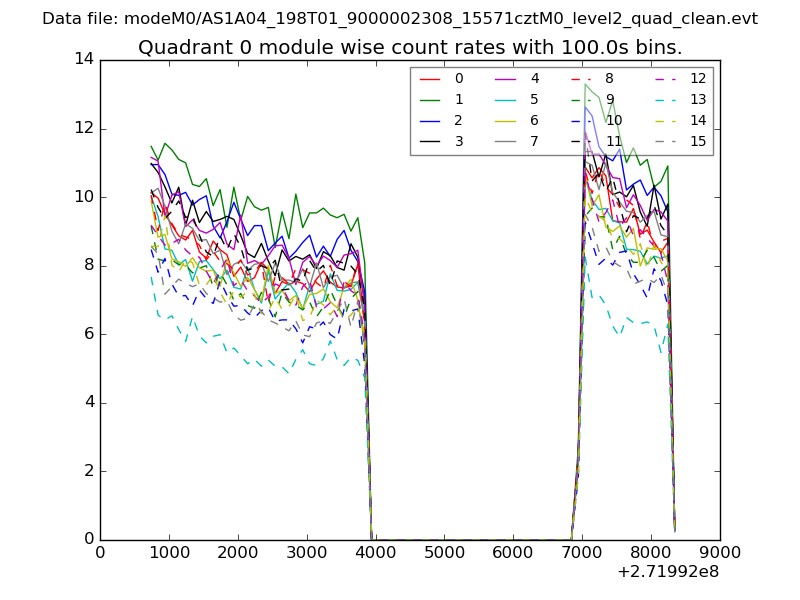 |
 |
| Module-wise count rates for Quadrant B Data is divided into 100 sec bins |
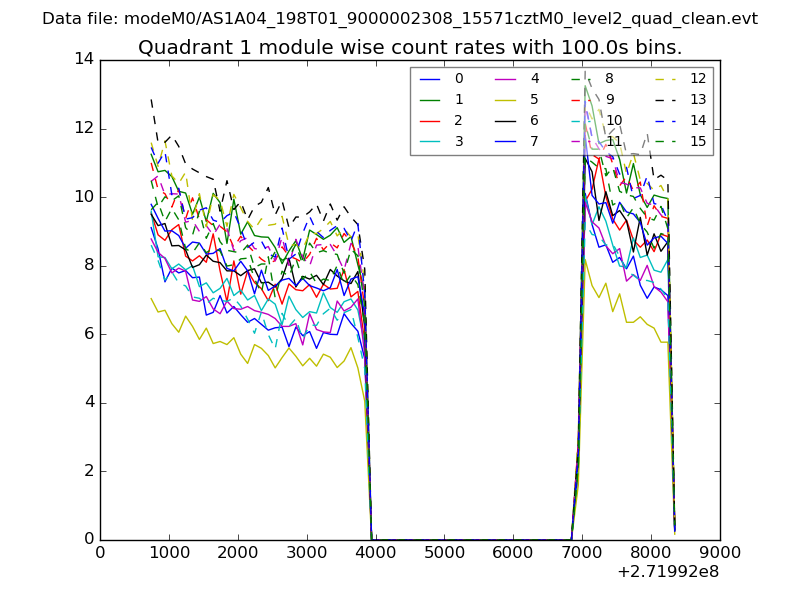 |
 |
| Module-wise count rates for Quadrant C Data is divided into 100 sec bins |
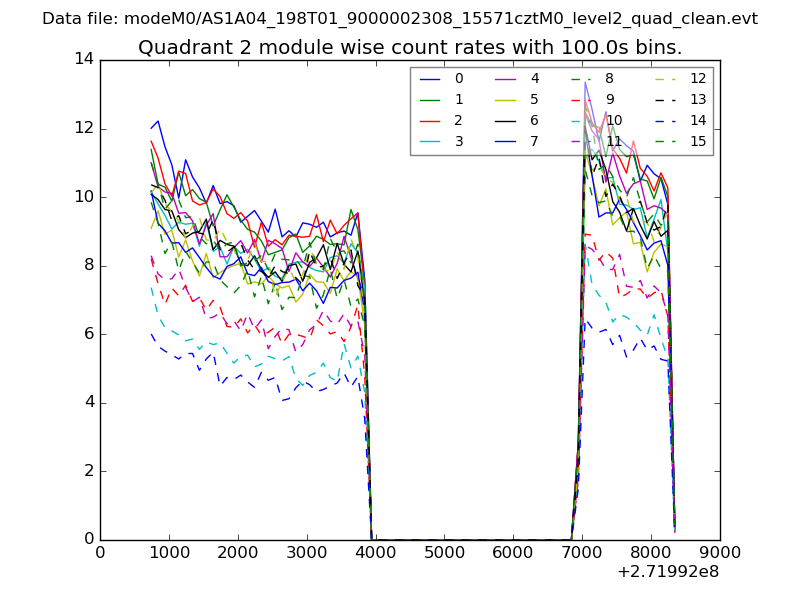 |
 |
| Module-wise count rates for Quadrant D Data is divided into 100 sec bins |
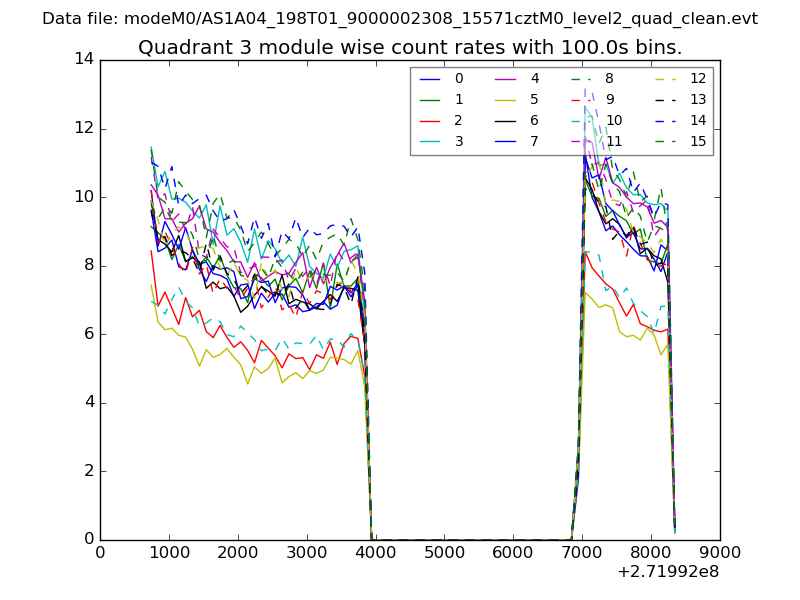 |
 |
| Parameter | Plot |
|---|---|
| CZT HV Monitor | 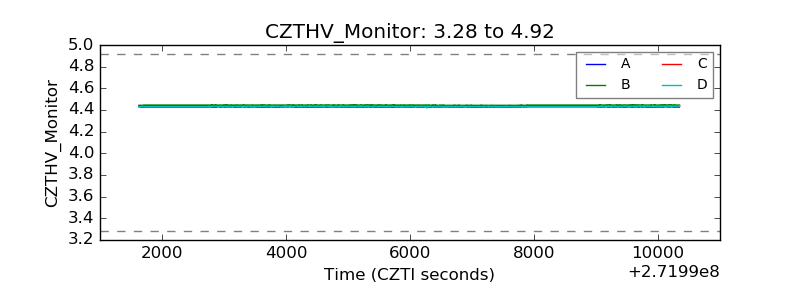 |
| D_VDD | 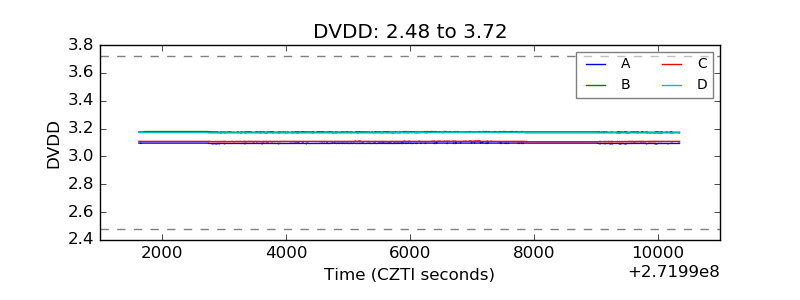 |
| Temperature 1 | 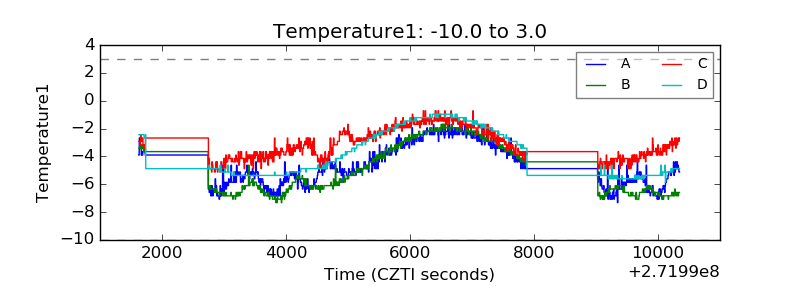 |
| Veto HV Monitor | 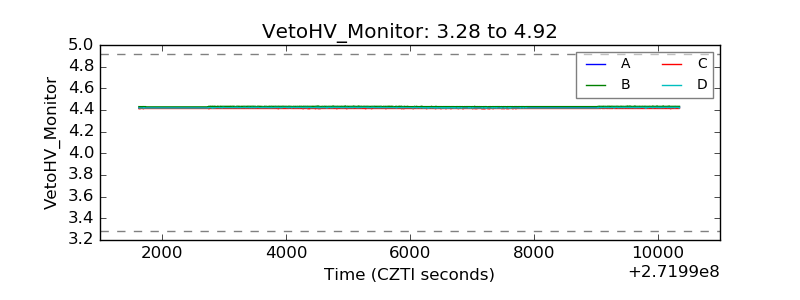 |
| Veto LLD | 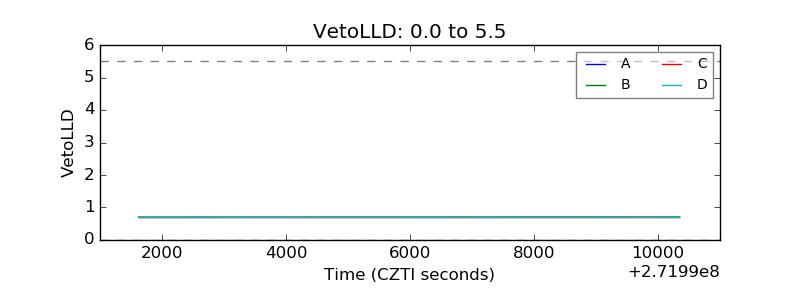 |
| Alpha Counter | 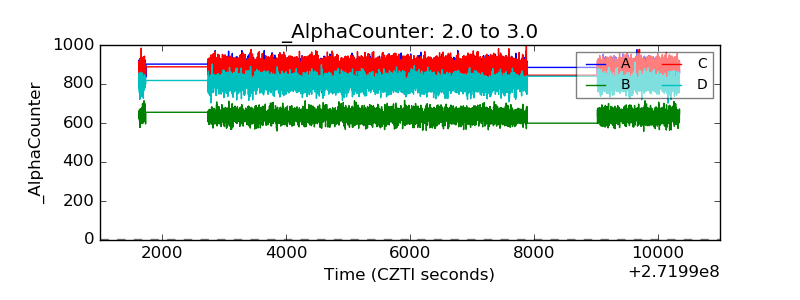 |
| _CPM_Rate | 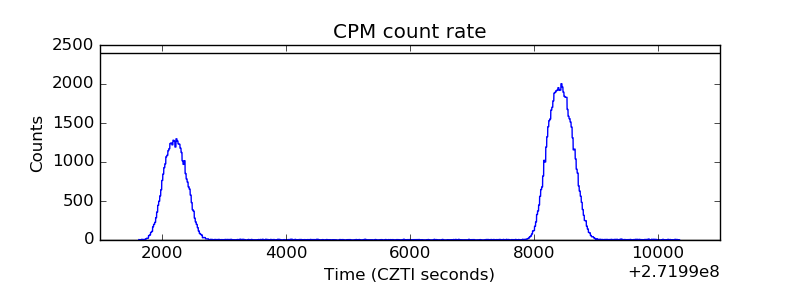 |
| CZT Counter | 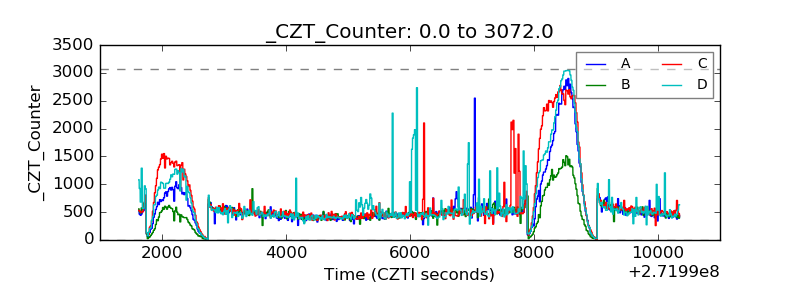 |
| +2.5 Volts monitor |  |
| +5 Volts monitor |  |
| _ROLL_ROT | 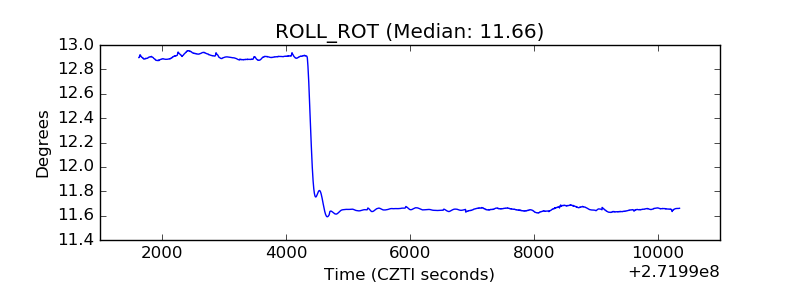 |
| _Roll_DEC | 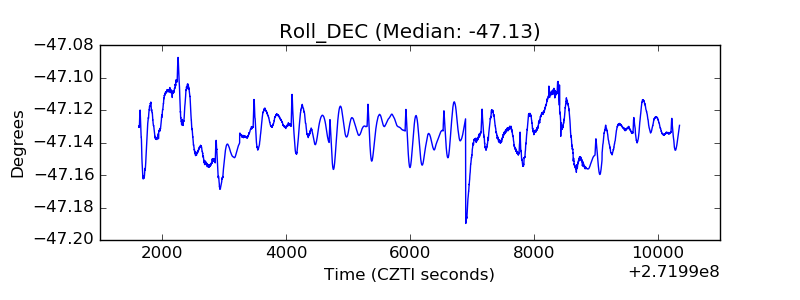 |
| _Roll_RA | 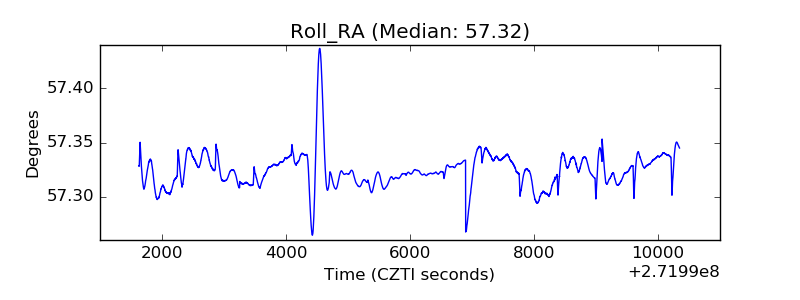 |
| Veto Counter | 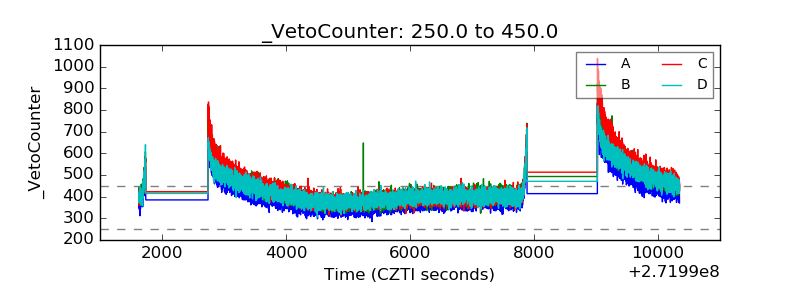 |