| Param | Original file | Final file |
|---|---|---|
| Filename | modeM0/AS1A04_198T01_9000002308_15572cztM0_level2.evt | modeM0/AS1A04_198T01_9000002308_15572cztM0_level2_quad_clean.evt |
| Size (bytes) | 499,697,280 | 96,143,040 |
| Size | 476.5 MB | 91.7 MB |
| Events in quadrant A | 3,092,639 | 619,771 |
| Events in quadrant B | 3,273,094 | 634,599 |
| Events in quadrant C | 3,215,626 | 621,008 |
| Events in quadrant D | 5,126,706 | 598,735 |
| Mode M0 | |||
|---|---|---|---|
| Quadrant | BADHDUFLAG | Total packets | Discarded packets |
| A | 0 | 13124 | 3 |
| B | 0 | 13559 | 2 |
| C | 0 | 13380 | 2 |
| D | 0 | 19357 | 2 |
| Mode SS | |||
|---|---|---|---|
| Quadrant | BADHDUFLAG | Total packets | Discarded packets |
| A | 0 | 126 | 0 |
| B | 0 | 126 | 0 |
| C | 0 | 126 | 0 |
| D | 0 | 126 | 0 |
| Mode M9 | |||
|---|---|---|---|
| Quadrant | BADHDUFLAG | Total packets | Discarded packets |
| A | 0 | 16 | 0 |
| B | 0 | 16 | 0 |
| C | 0 | 16 | 0 |
| D | 0 | 17 | 0 |
| Quadrant | Total seconds | Saturated seconds | Saturation percentage |
|---|---|---|---|
| A | 6275 | 19 | 0.302789% |
| B | 6275 | 22 | 0.350598% |
| C | 6275 | 52 | 0.828685% |
| D | 6275 | 315 | 5.019920% |
Noise dominated data is calculated using 1-second bins in cleaned event files. If a bin has >2000 counts, and if more than 50% of those come from <1% of pixels, then it is considered to be noise-dominated and hence unusable.
| Quadrant | # 1 sec bins | Bins with >0 counts | Bins with >2000 counts | High rate bins dominated by noise | Noise dominated (total time) | Noise dominated (detector-on time) | Marked lightcurve |
|---|---|---|---|---|---|---|---|
| A | 7551 | 6277 | 0 | 0 | 0.00% | 0.00% | 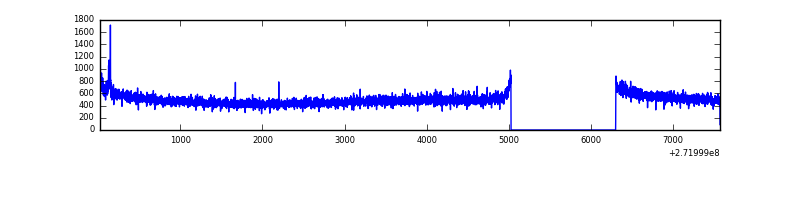 |
| B | 7551 | 6276 | 0 | 0 | 0.00% | 0.00% | 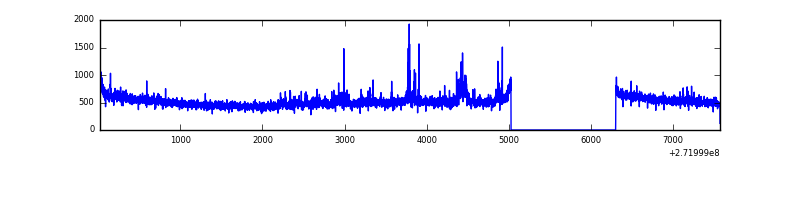 |
| C | 7551 | 6277 | 0 | 0 | 0.00% | 0.00% | 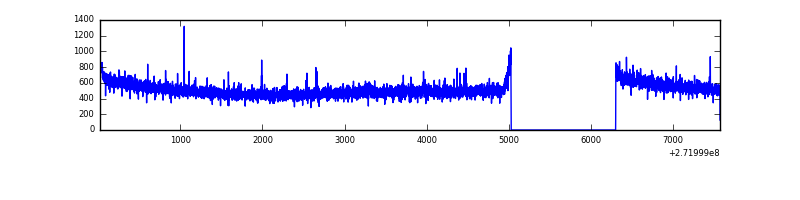 |
| D | 7551 | 6277 | 311 | 311 | 4.12% | 4.95% | 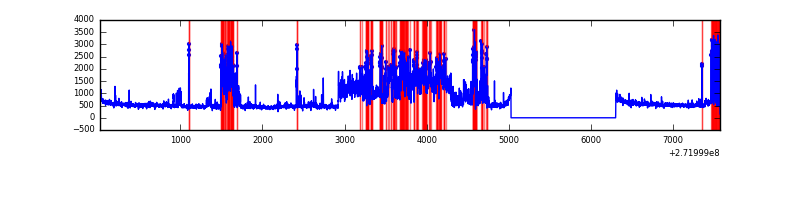 |
Top three noisy pixels from each quadrant. If the there are fewer than three noisy pixels in the level2.evt file, extra rows are filled as -1
| Pixel properties | Quadrant properties | ||||||
|---|---|---|---|---|---|---|---|
| Quadrant | DetID | PixID | Counts | Sigma | Mean | Median | Sigma |
| A | 14 | 238 | 22109 | 134.38 | 796 | 780 | 158.7 |
| A | 0 | 226 | 7068 | 39.62 | 796 | 780 | 158.7 |
| A | 12 | 194 | 6053 | 33.22 | 796 | 780 | 158.7 |
| B | 0 | 214 | 47208 | 310.01 | 797 | 779 | 149.8 |
| B | 5 | 65 | 34886 | 227.73 | 797 | 779 | 149.8 |
| B | 0 | 189 | 32781 | 213.68 | 797 | 779 | 149.8 |
| C | 14 | 238 | 122066 | 666.22 | 784 | 791 | 182.0 |
| C | 3 | 233 | 27765 | 148.18 | 784 | 791 | 182.0 |
| C | 0 | 207 | 6285 | 30.18 | 784 | 791 | 182.0 |
| D | 5 | 222 | 2041347 | 10757.2 | 782 | 760 | 189.7 |
| D | 2 | 16 | 37299 | 192.62 | 782 | 760 | 189.7 |
| D | 15 | 0 | 25825 | 132.13 | 782 | 760 | 189.7 |
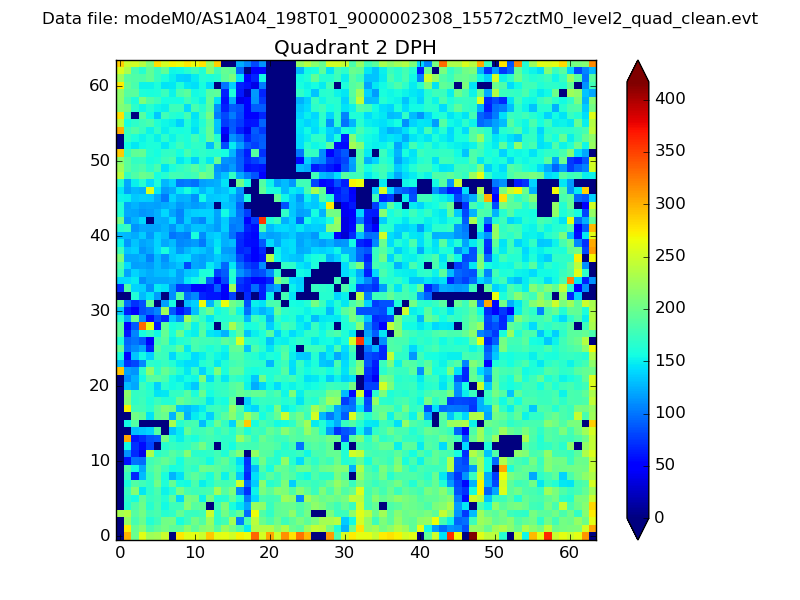
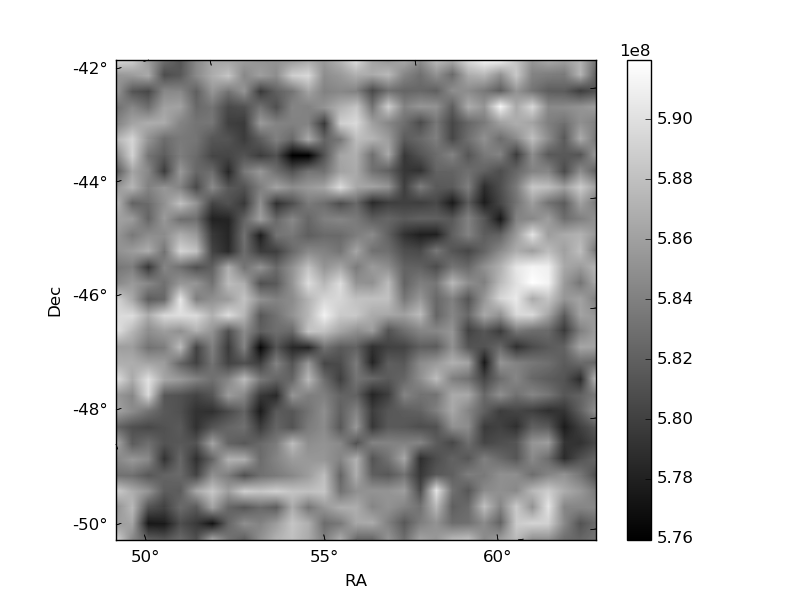
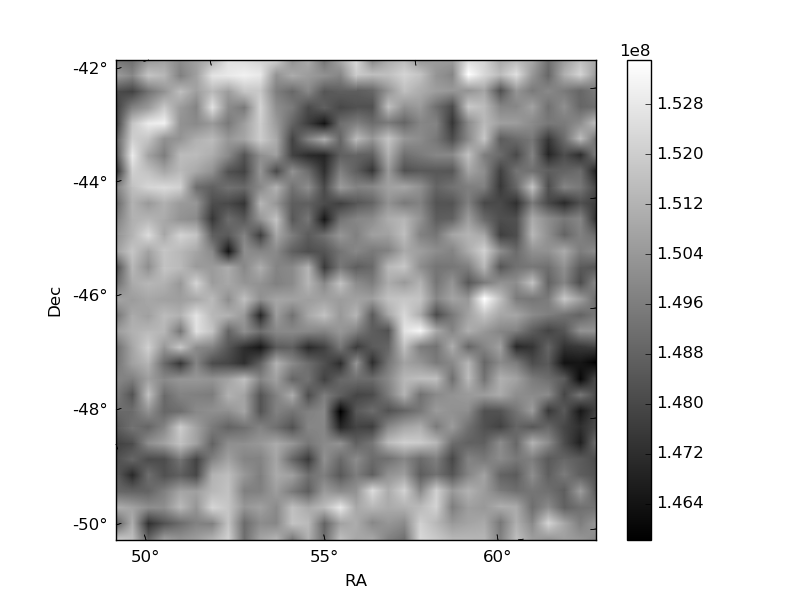
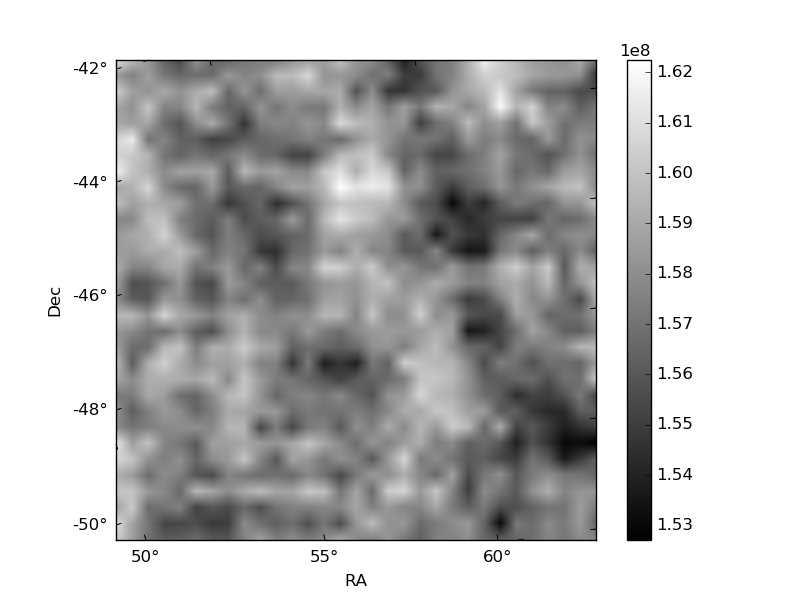
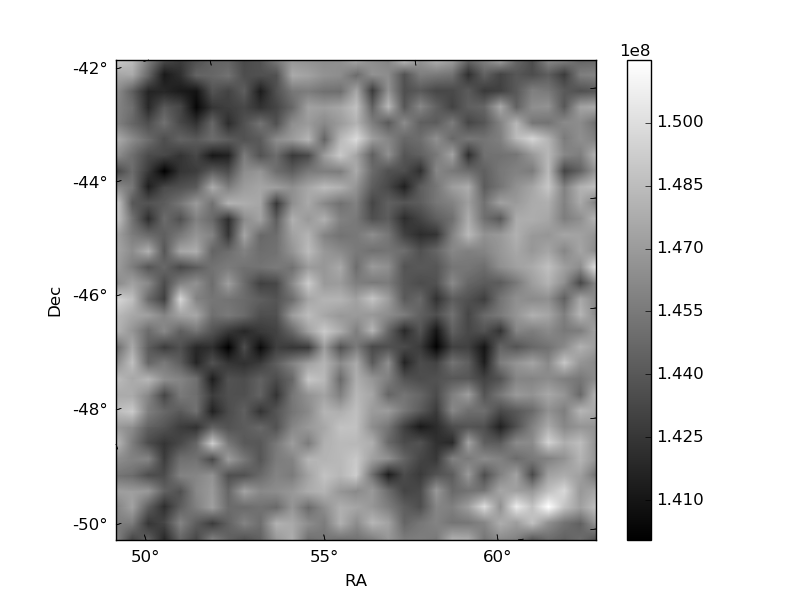
Histogram calculated using DETX and DETY for each event in the final _common_clean file
| Quadrant A | 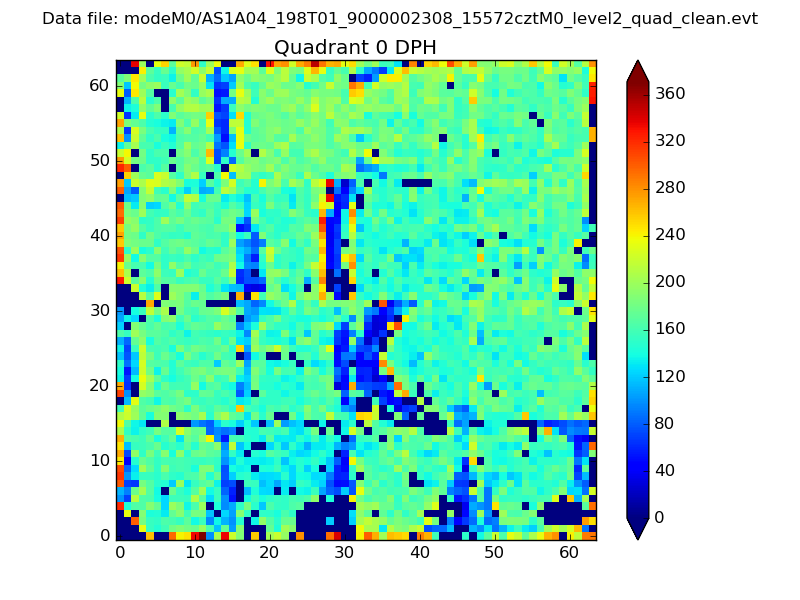 |
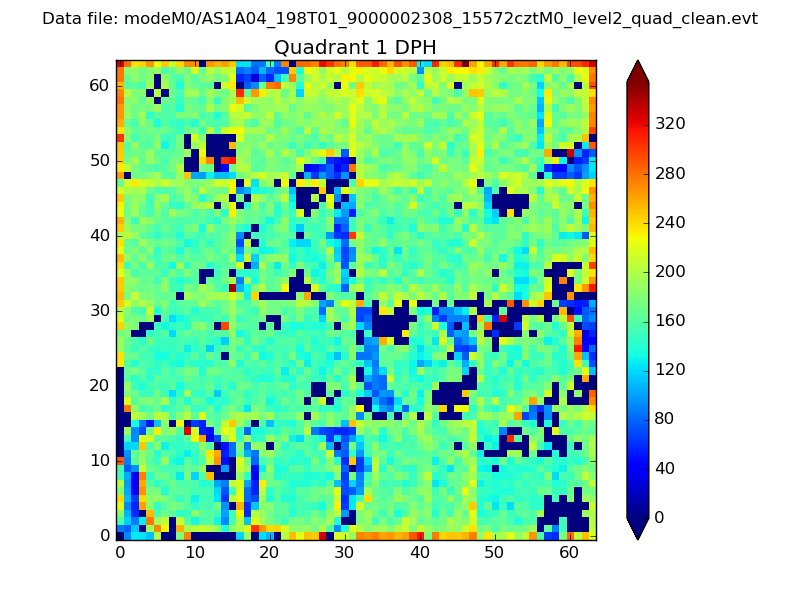 |
Quadrant B |
|---|---|---|---|
| Quadrant D | 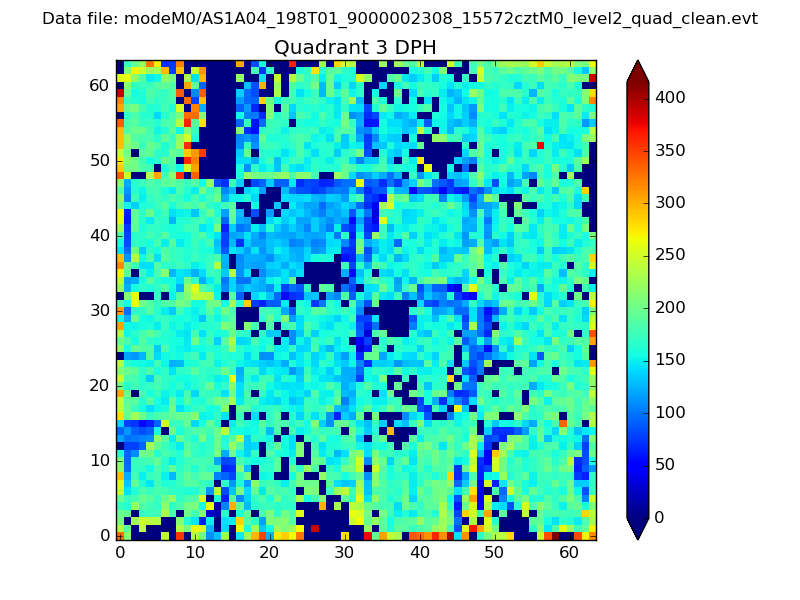 |
 |
Quadrant C |
| Plot type | Count rate plots | Images |
|---|---|---|
| Comparison with Poisson distribution Blue bars denote a histogram of data divided into 1 sec bins. Red curve is a Poisson curve with rate = median count rate of data. |
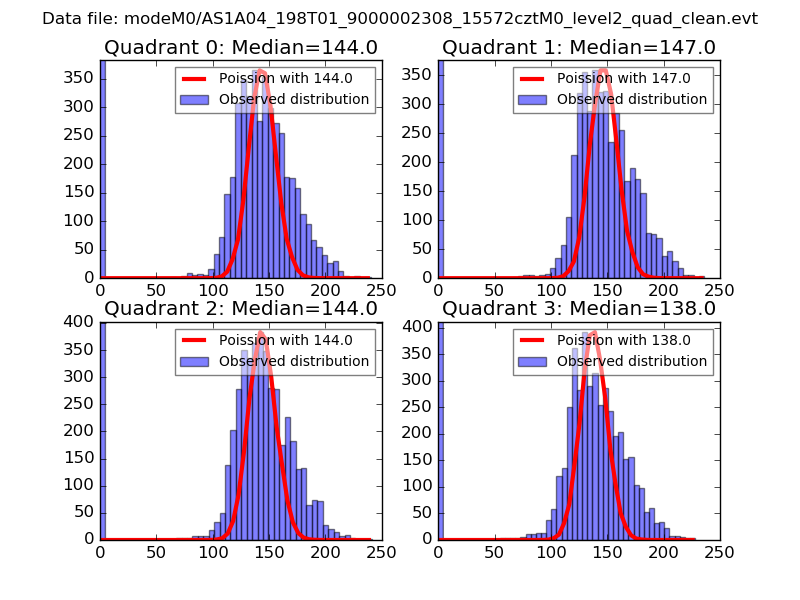 |
 |
| Quadrant-wise count rates Data is divided into 100 sec bins |
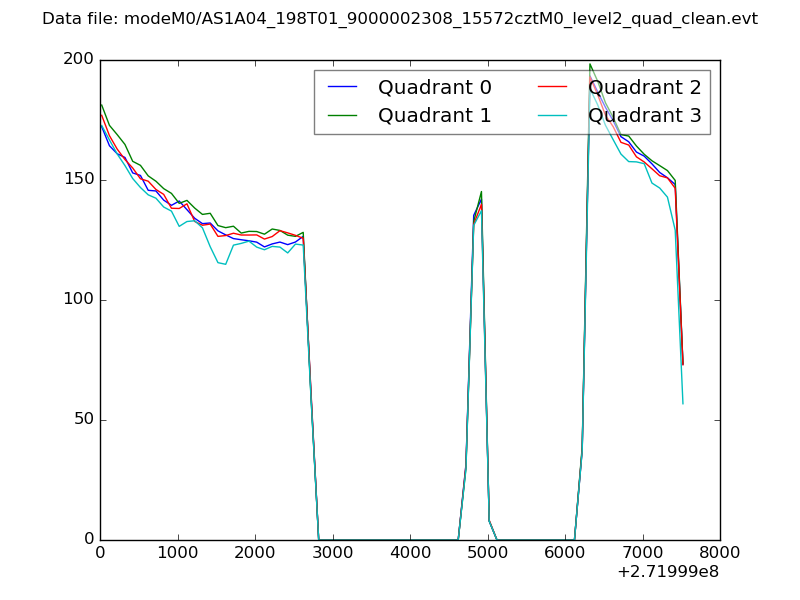 |
|
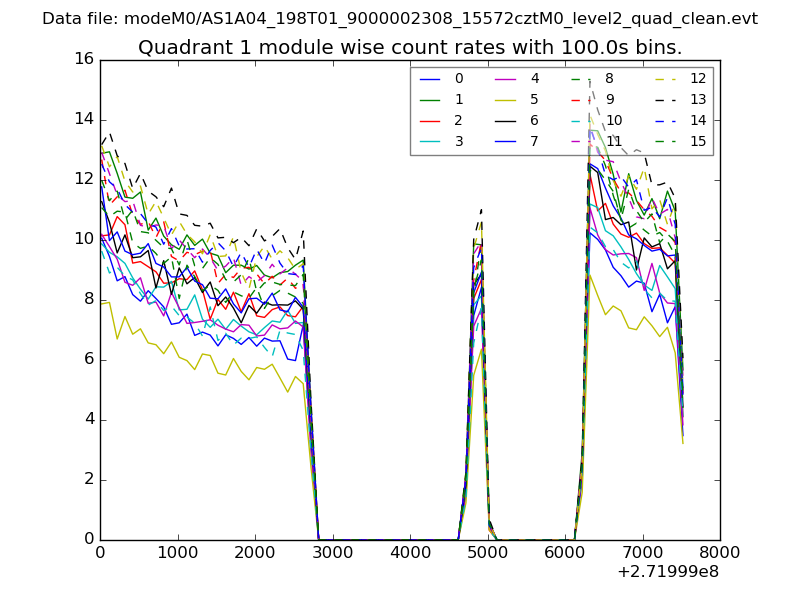
| Module-wise count rates for Quadrant A Data is divided into 100 sec bins |
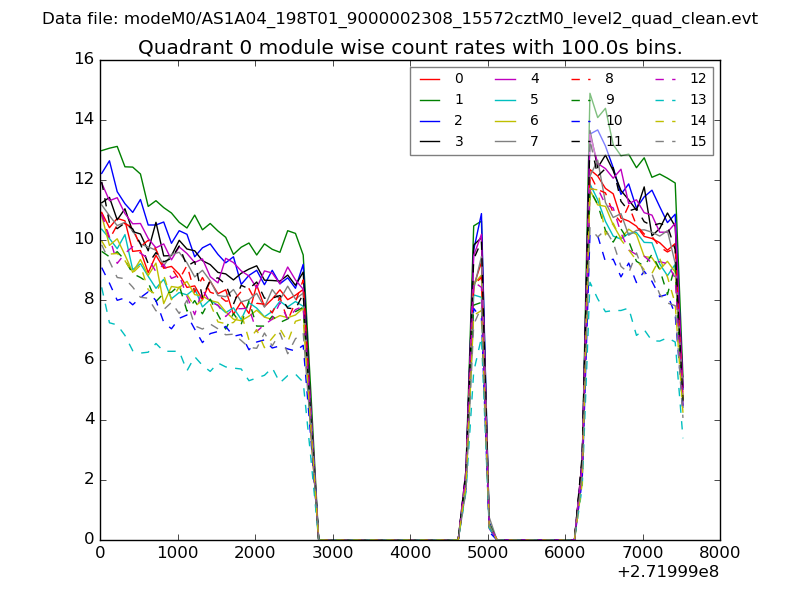 |
 |
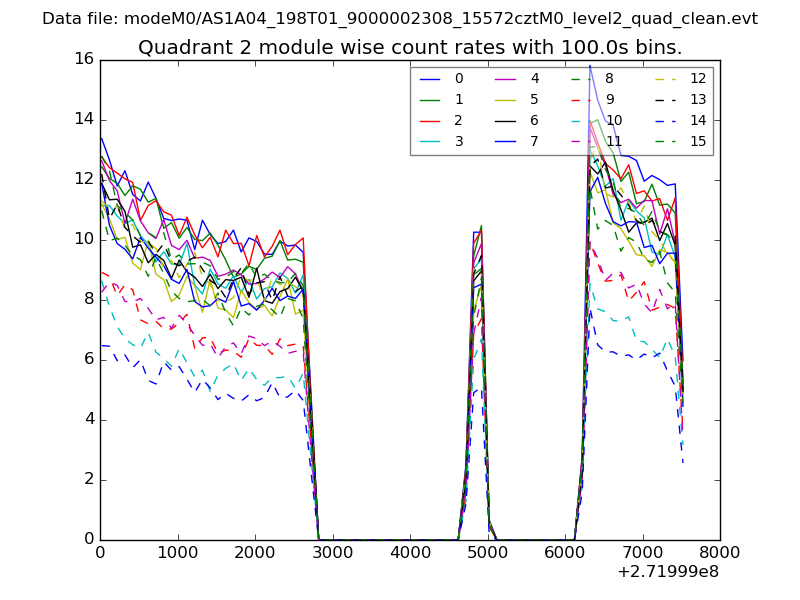
| Module-wise count rates for Quadrant B Data is divided into 100 sec bins |
 |
 |
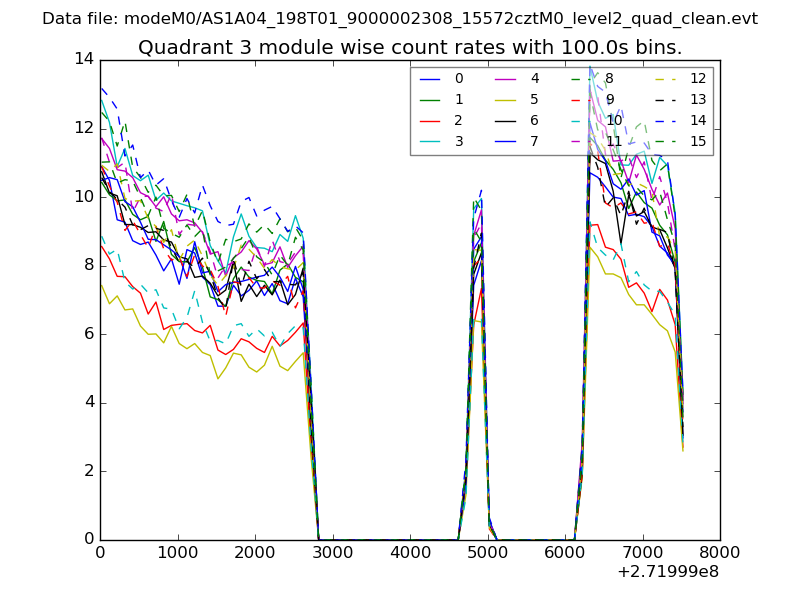
| Module-wise count rates for Quadrant C Data is divided into 100 sec bins |
 |
 |
| Module-wise count rates for Quadrant D Data is divided into 100 sec bins |
 |
 |
| Parameter | Plot |
|---|---|
| CZT HV Monitor | 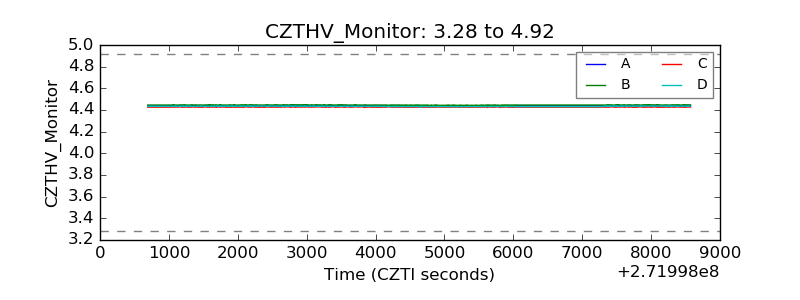 |
| D_VDD |  |
| Temperature 1 | 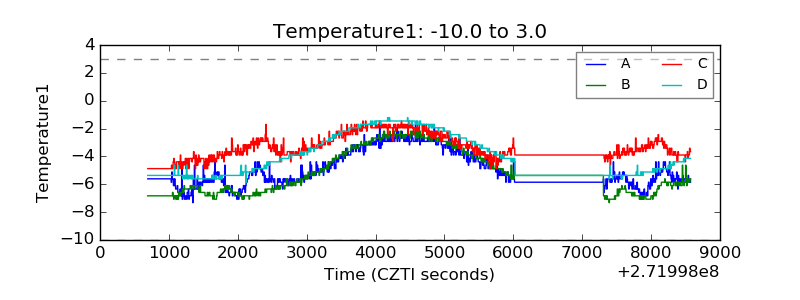 |
| Veto HV Monitor |  |
| Veto LLD | 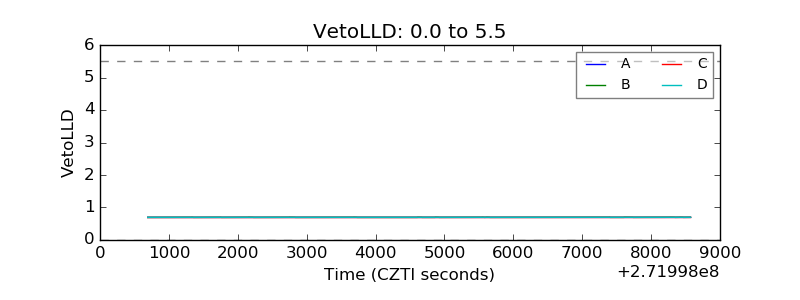 |
| Alpha Counter | 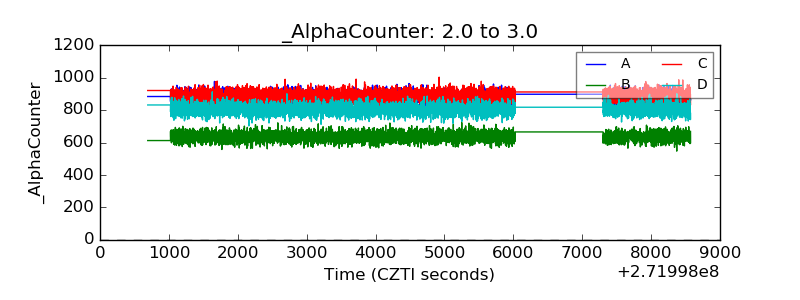 |
| _CPM_Rate | 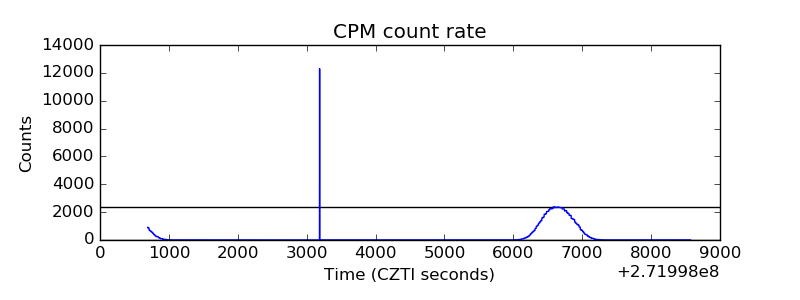 |
| CZT Counter | 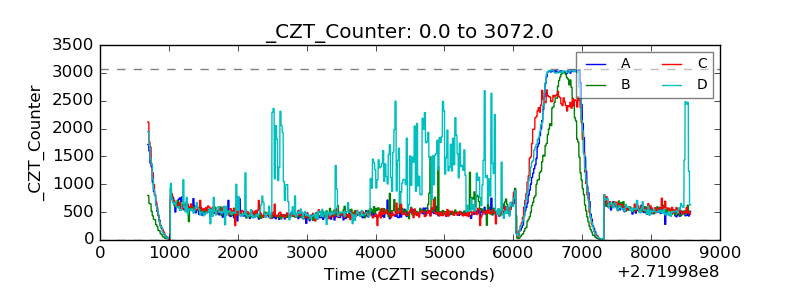 |
| +2.5 Volts monitor |  |
| +5 Volts monitor |  |
| _ROLL_ROT | 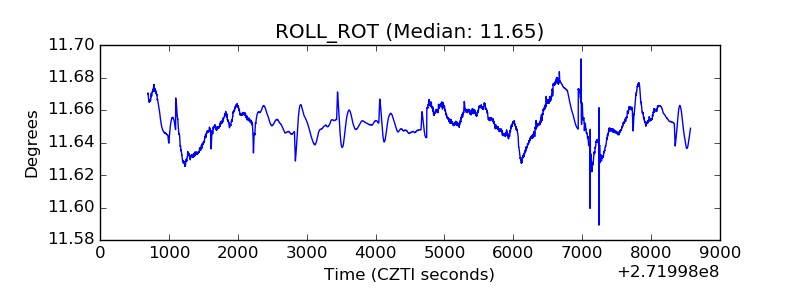 |
| _Roll_DEC | 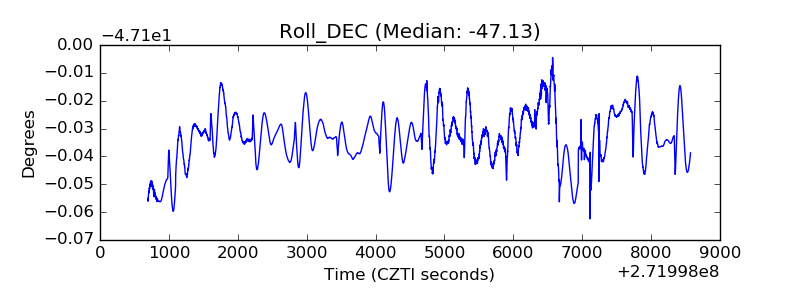 |
| _Roll_RA | 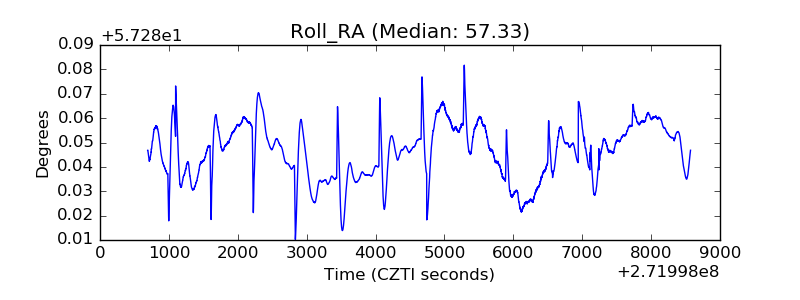 |
| Veto Counter | 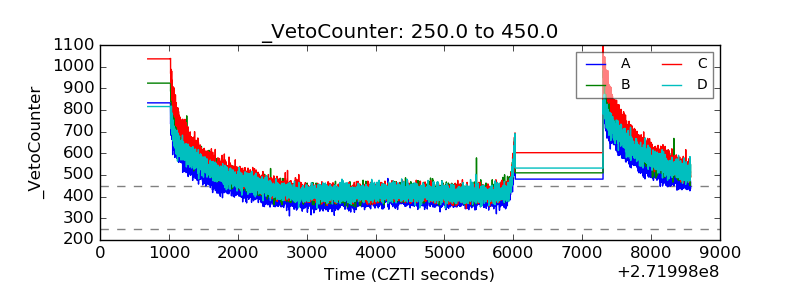 |