| Param | Original file | Final file |
|---|---|---|
| Filename | modeM0/AS1A04_198T01_9000002308_15575cztM0_level2.evt | modeM0/AS1A04_198T01_9000002308_15575cztM0_level2_quad_clean.evt |
| Size (bytes) | 444,398,400 | 86,950,080 |
| Size | 423.8 MB | 82.9 MB |
| Events in quadrant A | 3,149,942 | 559,467 |
| Events in quadrant B | 3,286,926 | 566,491 |
| Events in quadrant C | 3,179,472 | 540,229 |
| Events in quadrant D | 3,423,781 | 536,778 |
| Mode M0 | |||
|---|---|---|---|
| Quadrant | BADHDUFLAG | Total packets | Discarded packets |
| A | 0 | 12875 | 2 |
| B | 0 | 13283 | 1 |
| C | 0 | 12978 | 1 |
| D | 0 | 13824 | 1 |
| Mode SS | |||
|---|---|---|---|
| Quadrant | BADHDUFLAG | Total packets | Discarded packets |
| A | 0 | 126 | 0 |
| B | 0 | 126 | 0 |
| C | 0 | 126 | 0 |
| D | 0 | 126 | 0 |
| Mode M9 | |||
|---|---|---|---|
| Quadrant | BADHDUFLAG | Total packets | Discarded packets |
| A | 0 | 13 | 0 |
| B | 0 | 13 | 0 |
| C | 0 | 13 | 0 |
| D | 0 | 13 | 0 |
| Quadrant | Total seconds | Saturated seconds | Saturation percentage |
|---|---|---|---|
| A | 6158 | 75 | 1.217928% |
| B | 6158 | 95 | 1.542709% |
| C | 6158 | 94 | 1.526470% |
| D | 6158 | 116 | 1.883728% |
Noise dominated data is calculated using 1-second bins in cleaned event files. If a bin has >2000 counts, and if more than 50% of those come from <1% of pixels, then it is considered to be noise-dominated and hence unusable.
| Quadrant | # 1 sec bins | Bins with >0 counts | Bins with >2000 counts | High rate bins dominated by noise | Noise dominated (total time) | Noise dominated (detector-on time) | Marked lightcurve |
|---|---|---|---|---|---|---|---|
| A | 7469 | 6159 | 0 | 0 | 0.00% | 0.00% |  |
| B | 7469 | 6160 | 10 | 10 | 0.13% | 0.16% |  |
| C | 7469 | 6159 | 0 | 0 | 0.00% | 0.00% | 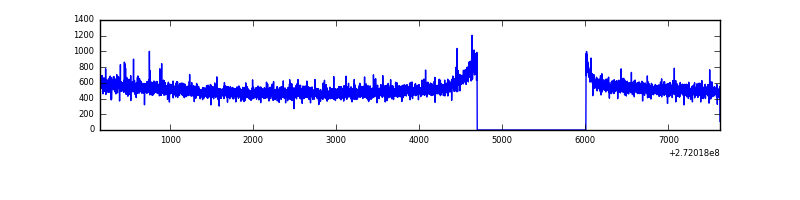 |
| D | 7469 | 6159 | 44 | 44 | 0.59% | 0.71% | 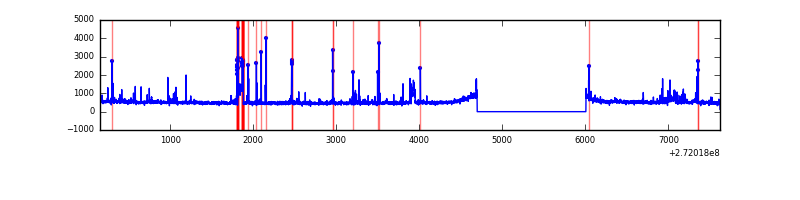 |
Top three noisy pixels from each quadrant. If the there are fewer than three noisy pixels in the level2.evt file, extra rows are filled as -1
| Pixel properties | Quadrant properties | ||||||
|---|---|---|---|---|---|---|---|
| Quadrant | DetID | PixID | Counts | Sigma | Mean | Median | Sigma |
| A | 0 | 226 | 7396 | 40.51 | 818 | 802 | 162.8 |
| A | 12 | 194 | 6211 | 33.23 | 818 | 802 | 162.8 |
| A | 3 | 137 | 5019 | 25.9 | 818 | 802 | 162.8 |
| B | 3 | 64 | 63719 | 419.55 | 803 | 784 | 150.0 |
| B | 0 | 189 | 23851 | 153.77 | 803 | 784 | 150.0 |
| B | 0 | 214 | 21965 | 141.2 | 803 | 784 | 150.0 |
| C | 14 | 238 | 120550 | 668.61 | 777 | 783 | 179.1 |
| C | 3 | 233 | 20683 | 111.09 | 777 | 783 | 179.1 |
| C | 13 | 61 | 5558 | 26.66 | 777 | 783 | 179.1 |
| D | 15 | 0 | 146719 | 695.46 | 795 | 777 | 209.8 |
| D | 7 | 223 | 85814 | 405.23 | 795 | 777 | 209.8 |
| D | 7 | 38 | 44432 | 208.03 | 795 | 777 | 209.8 |
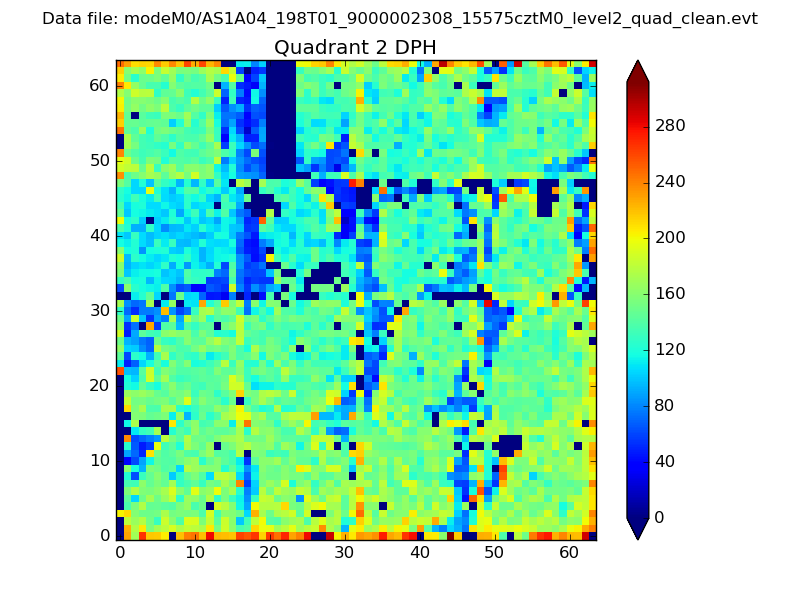
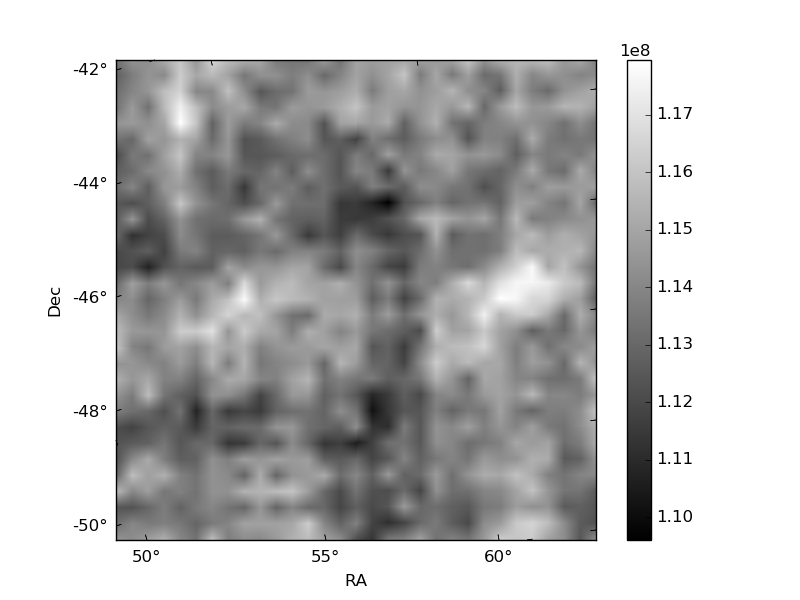
Histogram calculated using DETX and DETY for each event in the final _common_clean file
| Quadrant A | 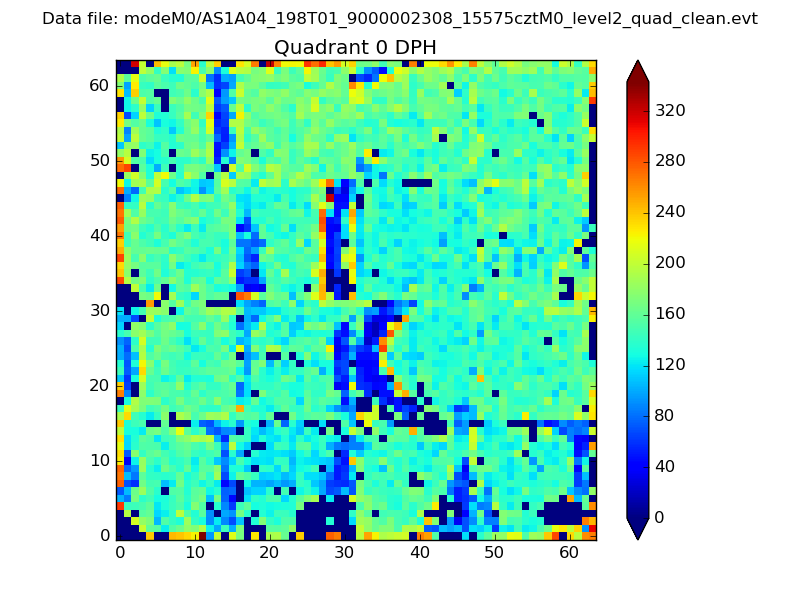 |
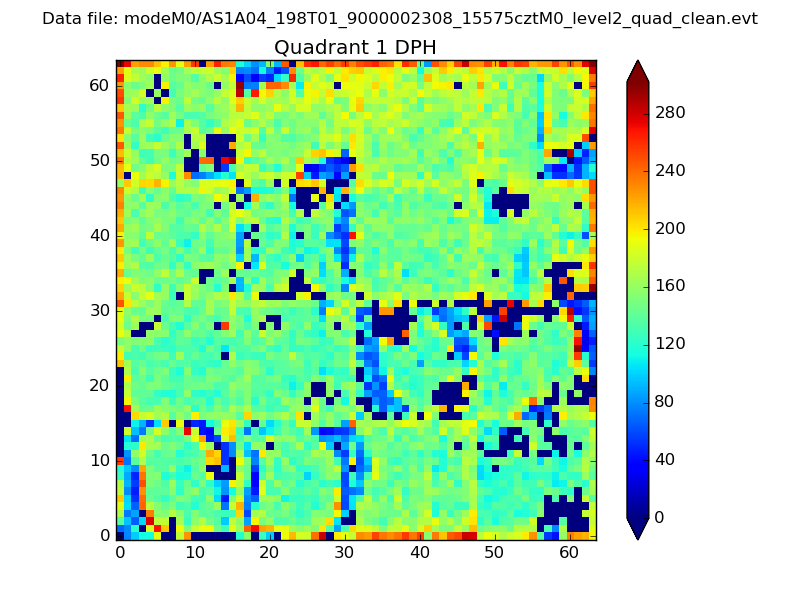 |
Quadrant B |
|---|---|---|---|
| Quadrant D | 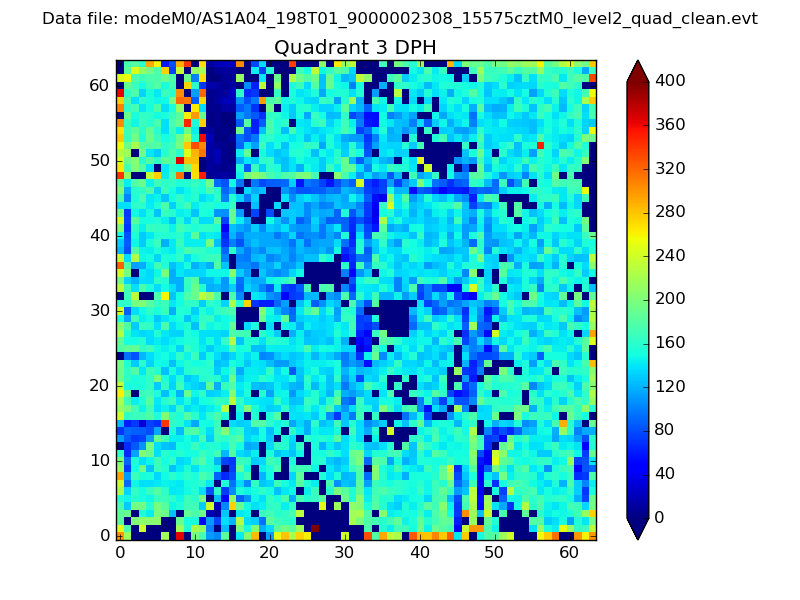 |
 |
Quadrant C |
| Plot type | Count rate plots | Images |
|---|---|---|
| Comparison with Poisson distribution Blue bars denote a histogram of data divided into 1 sec bins. Red curve is a Poisson curve with rate = median count rate of data. |
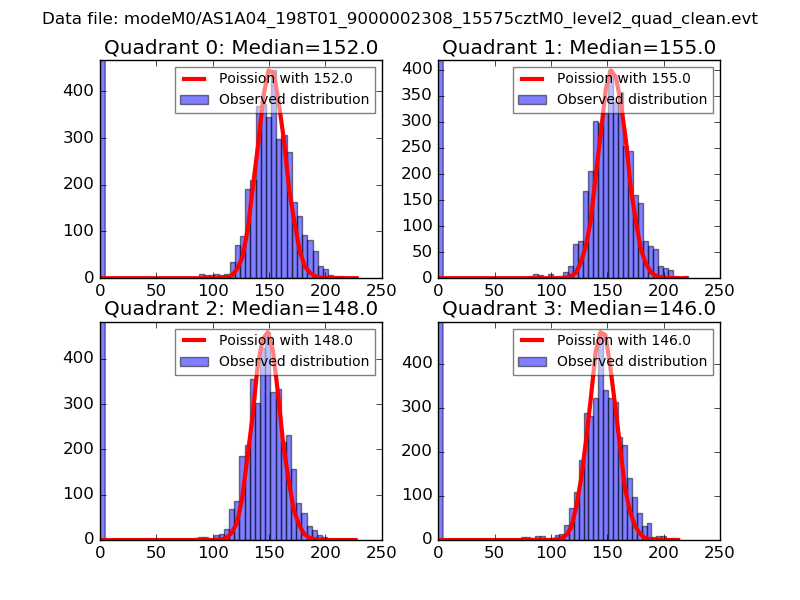 |
 |
| Quadrant-wise count rates Data is divided into 100 sec bins |
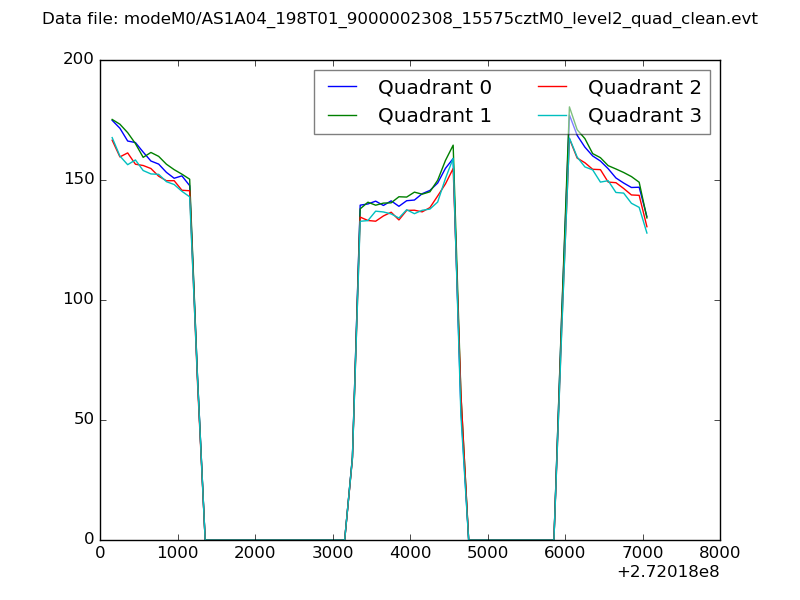 |
|
| Module-wise count rates for Quadrant A Data is divided into 100 sec bins |
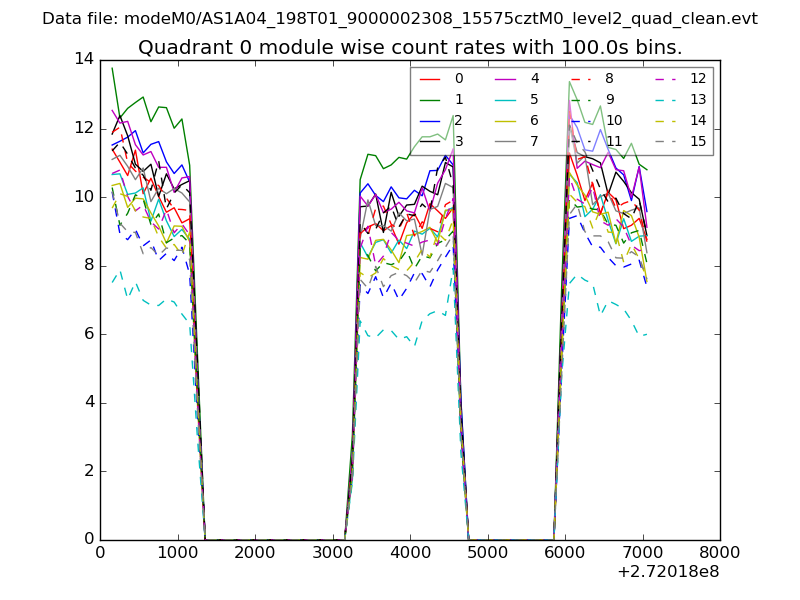 |
 |
| Module-wise count rates for Quadrant B Data is divided into 100 sec bins |
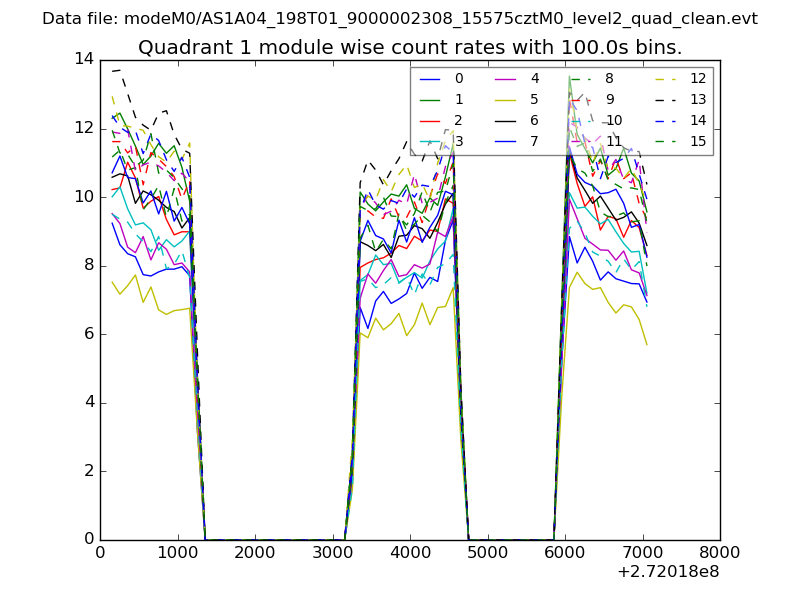 |
 |
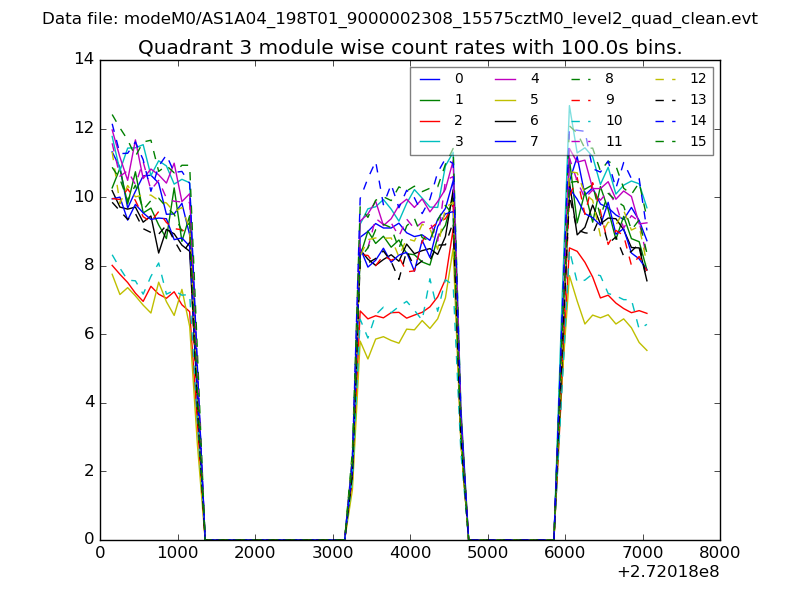
| Module-wise count rates for Quadrant C Data is divided into 100 sec bins |
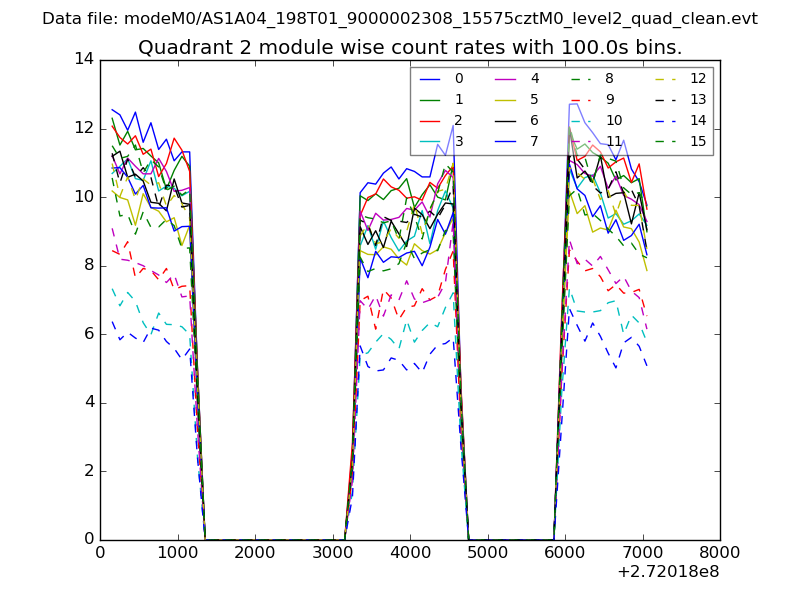 |
 |
| Module-wise count rates for Quadrant D Data is divided into 100 sec bins |
 |
 |
| Parameter | Plot |
|---|---|
| CZT HV Monitor | 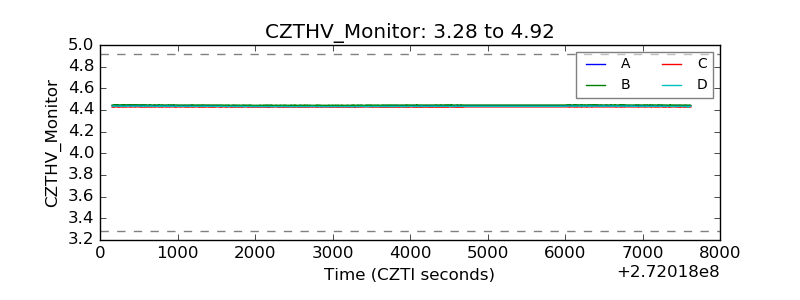 |
| D_VDD | 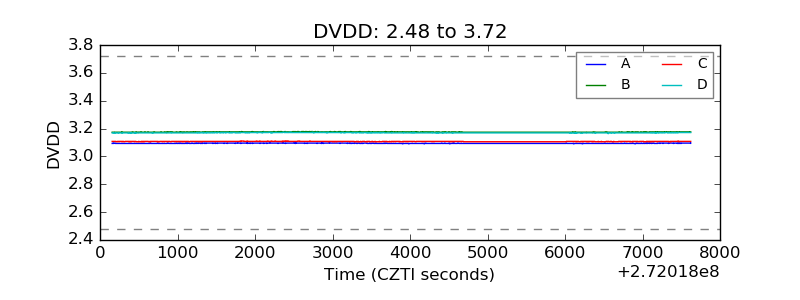 |
| Temperature 1 | 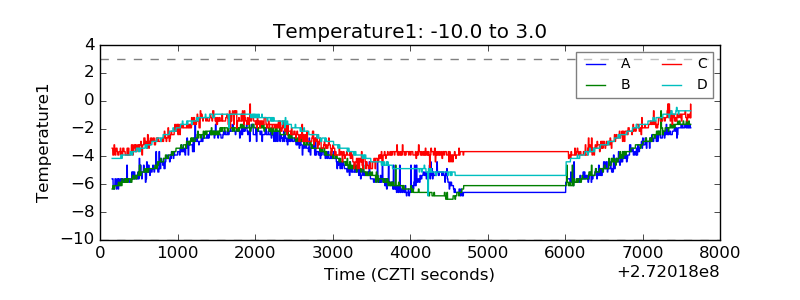 |
| Veto HV Monitor | 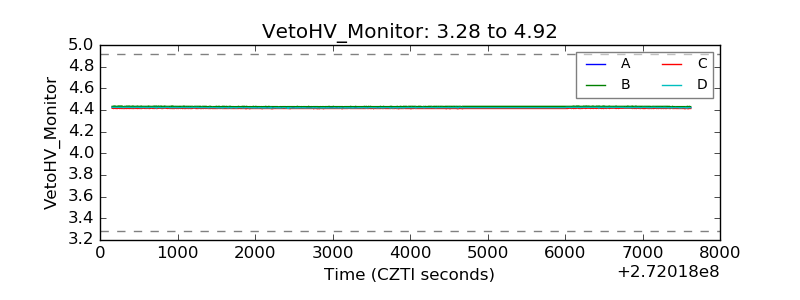 |
| Veto LLD | 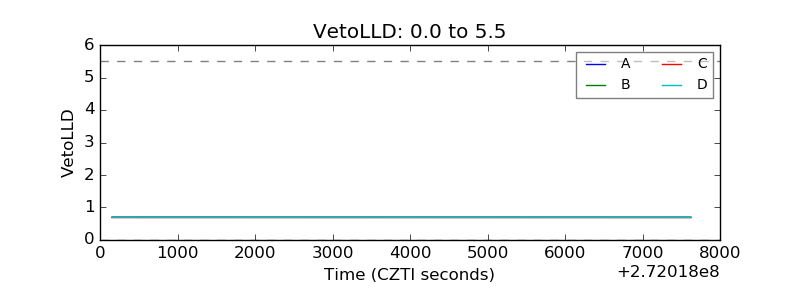 |
| Alpha Counter | 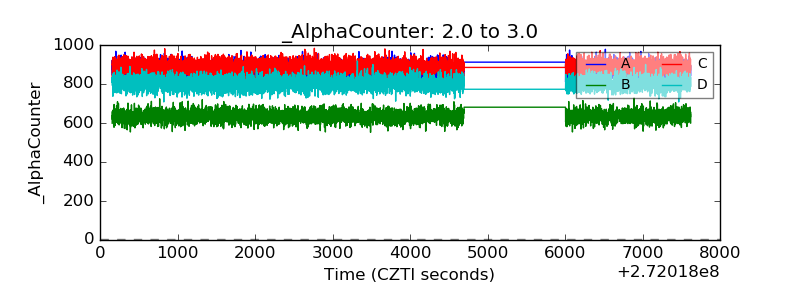 |
| _CPM_Rate | 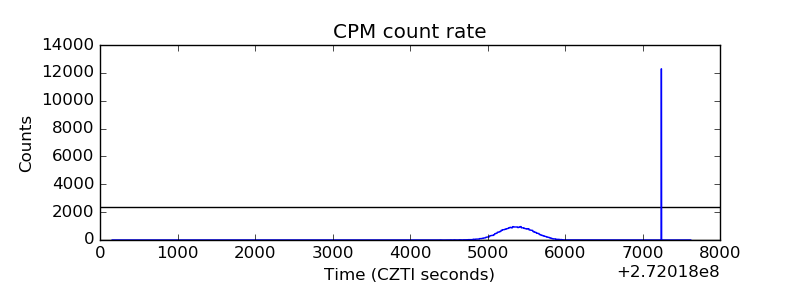 |
| CZT Counter | 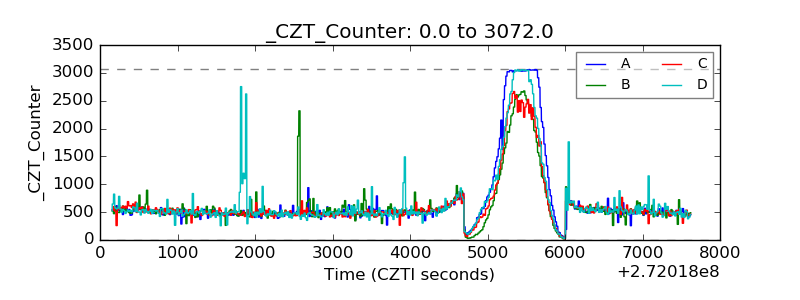 |
| +2.5 Volts monitor |  |
| +5 Volts monitor |  |
| _ROLL_ROT | 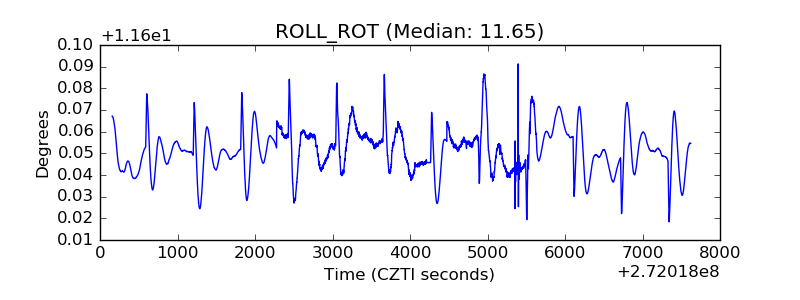 |
| _Roll_DEC | 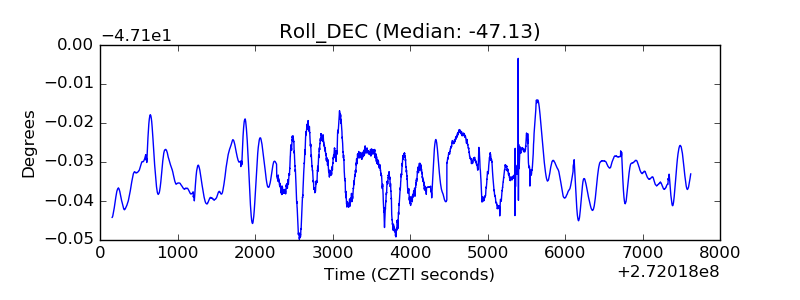 |
| _Roll_RA | 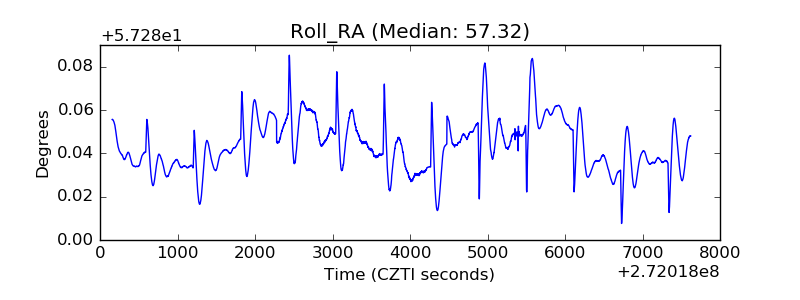 |
| Veto Counter | 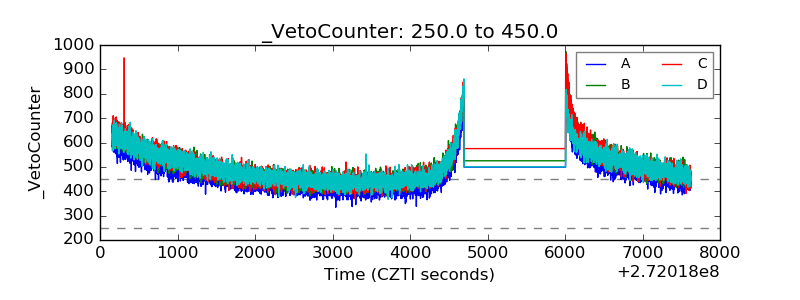 |