| Param | Original file | Final file |
|---|---|---|
| Filename | modeM0/AS1A04_198T01_9000002308_15576cztM0_level2.evt | modeM0/AS1A04_198T01_9000002308_15576cztM0_level2_quad_clean.evt |
| Size (bytes) | 465,448,320 | 84,147,840 |
| Size | 443.9 MB | 80.2 MB |
| Events in quadrant A | 3,218,528 | 532,912 |
| Events in quadrant B | 3,653,605 | 536,114 |
| Events in quadrant C | 3,253,933 | 515,789 |
| Events in quadrant D | 3,530,999 | 512,388 |
| Mode M0 | |||
|---|---|---|---|
| Quadrant | BADHDUFLAG | Total packets | Discarded packets |
| A | 0 | 13397 | 3 |
| B | 0 | 14712 | 2 |
| C | 0 | 13429 | 2 |
| D | 0 | 14429 | 2 |
| Mode SS | |||
|---|---|---|---|
| Quadrant | BADHDUFLAG | Total packets | Discarded packets |
| A | 0 | 132 | 0 |
| B | 0 | 132 | 0 |
| C | 0 | 132 | 0 |
| D | 0 | 132 | 0 |
| Mode M9 | |||
|---|---|---|---|
| Quadrant | BADHDUFLAG | Total packets | Discarded packets |
| A | 0 | 11 | 0 |
| B | 0 | 11 | 0 |
| C | 0 | 11 | 0 |
| D | 0 | 11 | 0 |
| Quadrant | Total seconds | Saturated seconds | Saturation percentage |
|---|---|---|---|
| A | 6461 | 64 | 0.990559% |
| B | 6461 | 120 | 1.857298% |
| C | 6461 | 77 | 1.191766% |
| D | 6461 | 61 | 0.944126% |
Noise dominated data is calculated using 1-second bins in cleaned event files. If a bin has >2000 counts, and if more than 50% of those come from <1% of pixels, then it is considered to be noise-dominated and hence unusable.
| Quadrant | # 1 sec bins | Bins with >0 counts | Bins with >2000 counts | High rate bins dominated by noise | Noise dominated (total time) | Noise dominated (detector-on time) | Marked lightcurve |
|---|---|---|---|---|---|---|---|
| A | 7602 | 6464 | 2 | 2 | 0.03% | 0.03% | 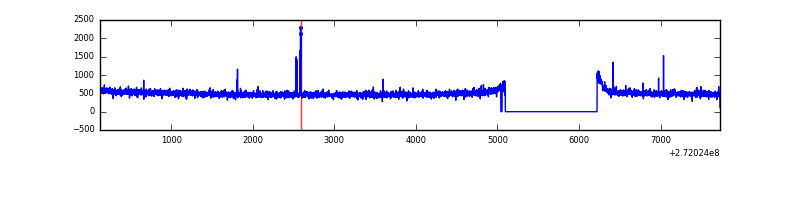 |
| B | 7602 | 6463 | 36 | 36 | 0.47% | 0.56% | 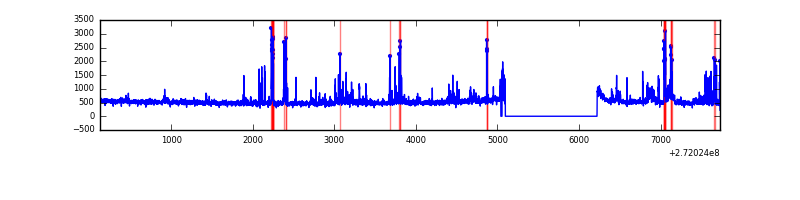 |
| C | 7602 | 6463 | 0 | 0 | 0.00% | 0.00% |  |
| D | 7602 | 6464 | 15 | 15 | 0.20% | 0.23% | 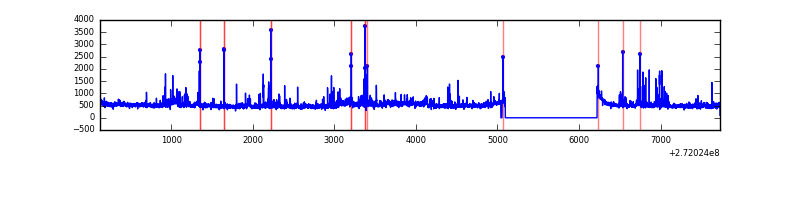 |
Top three noisy pixels from each quadrant. If the there are fewer than three noisy pixels in the level2.evt file, extra rows are filled as -1
| Pixel properties | Quadrant properties | ||||||
|---|---|---|---|---|---|---|---|
| Quadrant | DetID | PixID | Counts | Sigma | Mean | Median | Sigma |
| A | 13 | 248 | 21402 | 123.2 | 830 | 813 | 167.1 |
| A | 9 | 143 | 7973 | 42.85 | 830 | 813 | 167.1 |
| A | 0 | 226 | 7408 | 39.46 | 830 | 813 | 167.1 |
| B | 5 | 65 | 178147 | 1148.48 | 818 | 798 | 154.4 |
| B | 3 | 64 | 86246 | 553.34 | 818 | 798 | 154.4 |
| B | 4 | 173 | 58603 | 374.33 | 818 | 798 | 154.4 |
| C | 14 | 238 | 123252 | 675.7 | 790 | 796 | 181.2 |
| C | 3 | 233 | 39772 | 215.07 | 790 | 796 | 181.2 |
| C | 0 | 207 | 5878 | 28.04 | 790 | 796 | 181.2 |
| D | 1 | 52 | 220927 | 1064.87 | 807 | 786 | 206.7 |
| D | 2 | 16 | 51404 | 244.85 | 807 | 786 | 206.7 |
| D | 15 | 0 | 41983 | 199.28 | 807 | 786 | 206.7 |
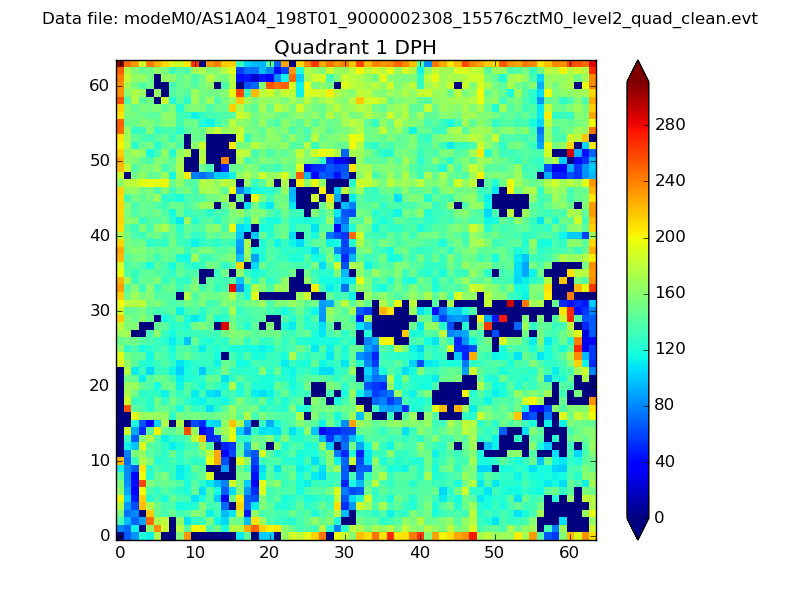
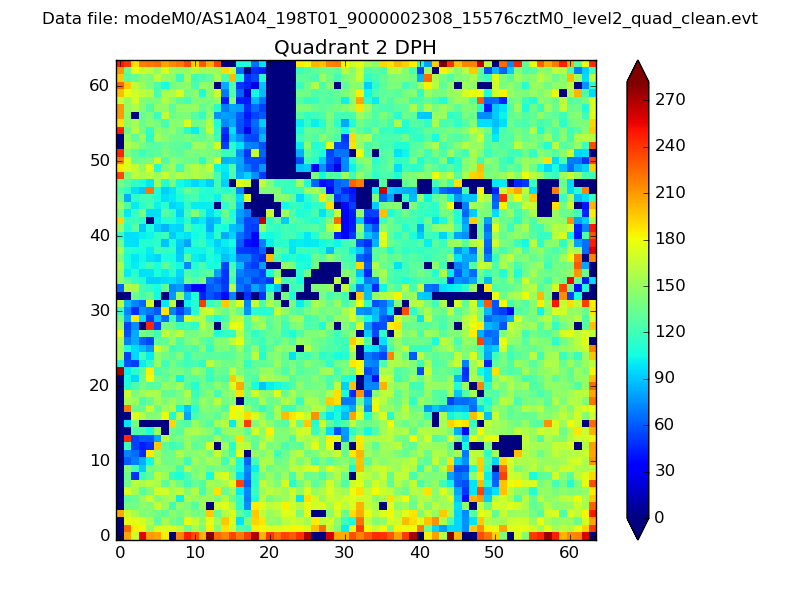
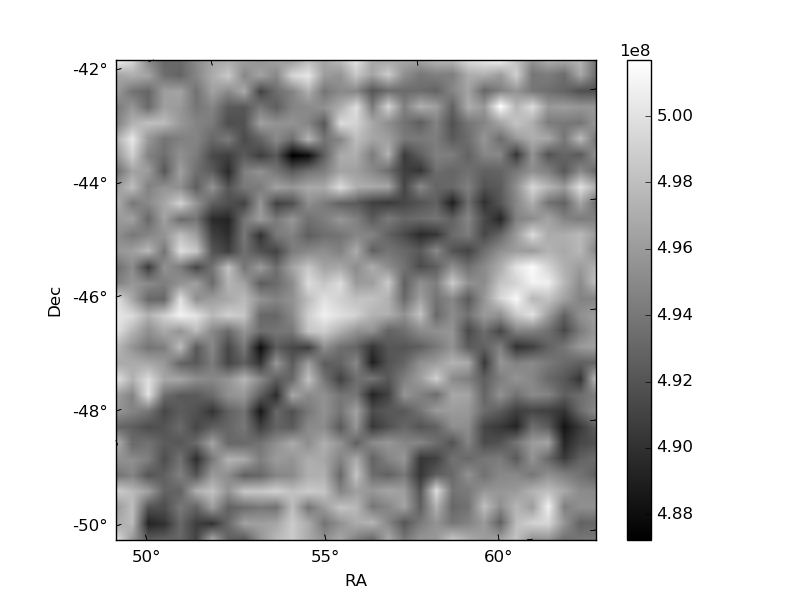
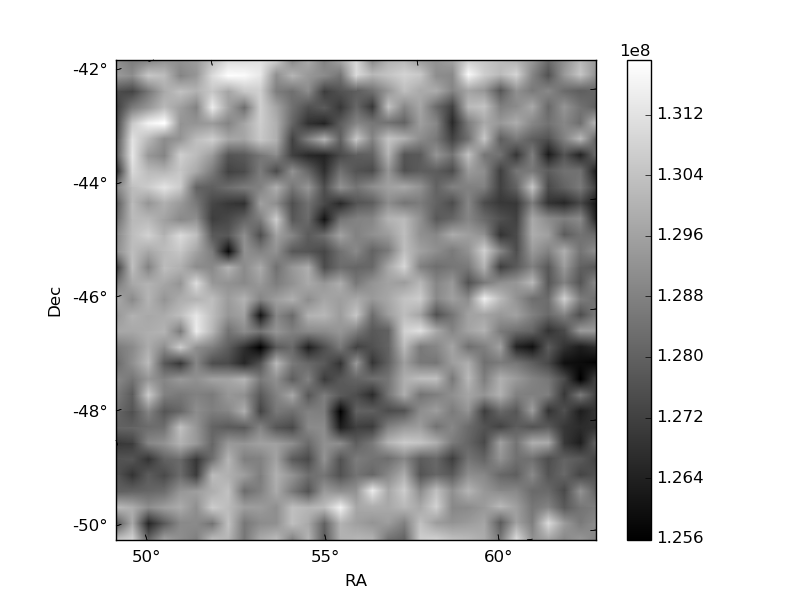
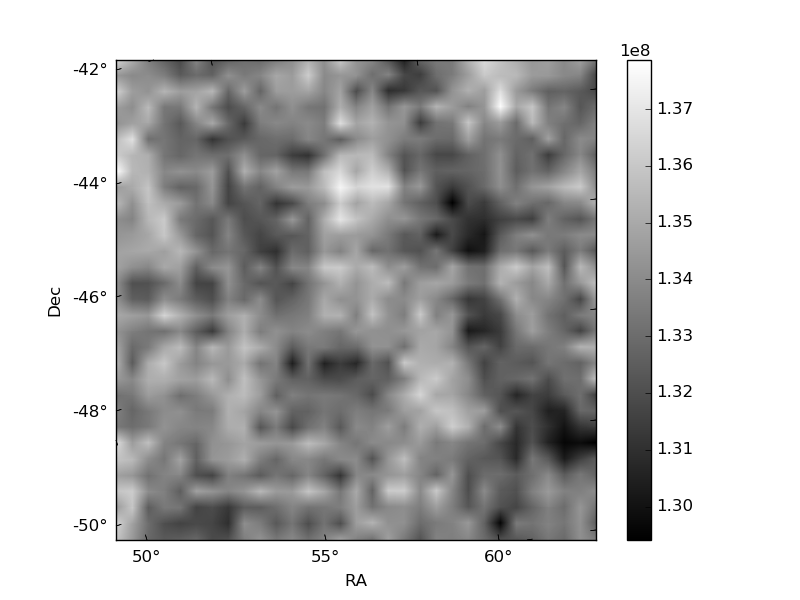
Histogram calculated using DETX and DETY for each event in the final _common_clean file
| Quadrant A | 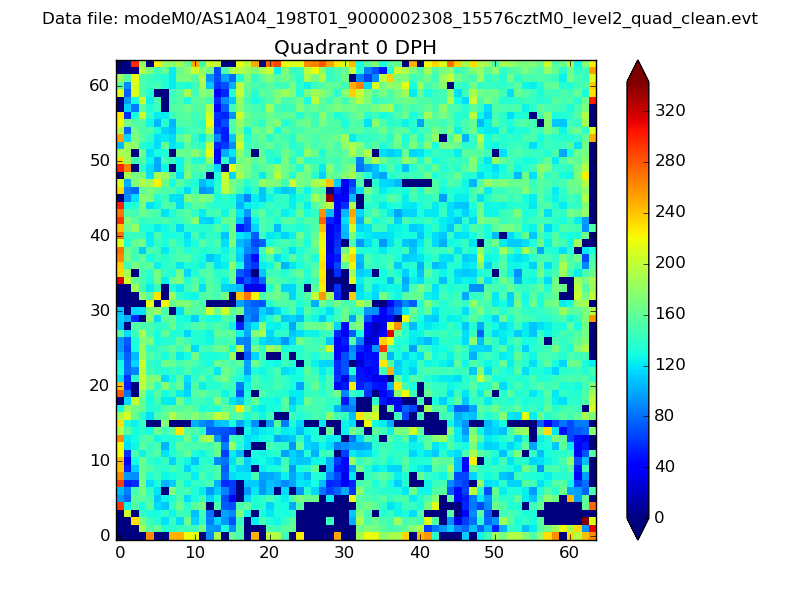 |
 |
Quadrant B |
|---|---|---|---|
| Quadrant D | 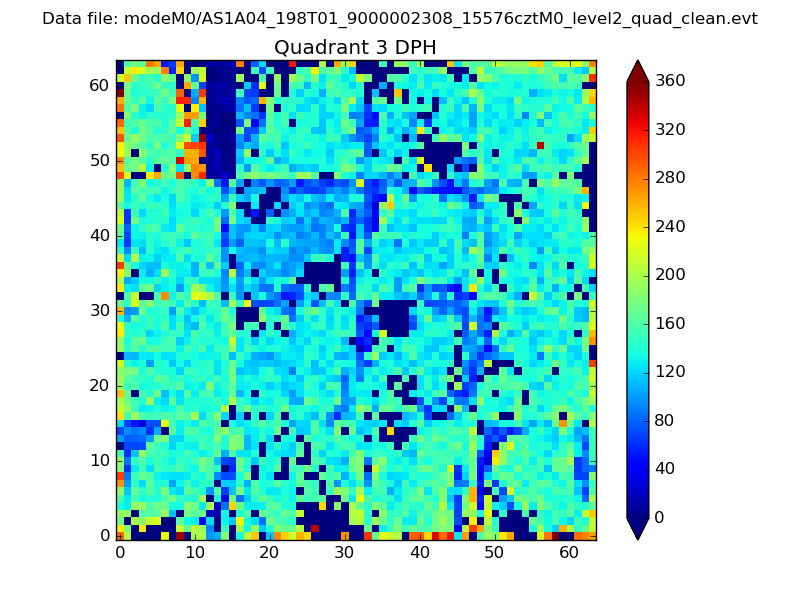 |
 |
Quadrant C |
| Plot type | Count rate plots | Images |
|---|---|---|
| Comparison with Poisson distribution Blue bars denote a histogram of data divided into 1 sec bins. Red curve is a Poisson curve with rate = median count rate of data. |
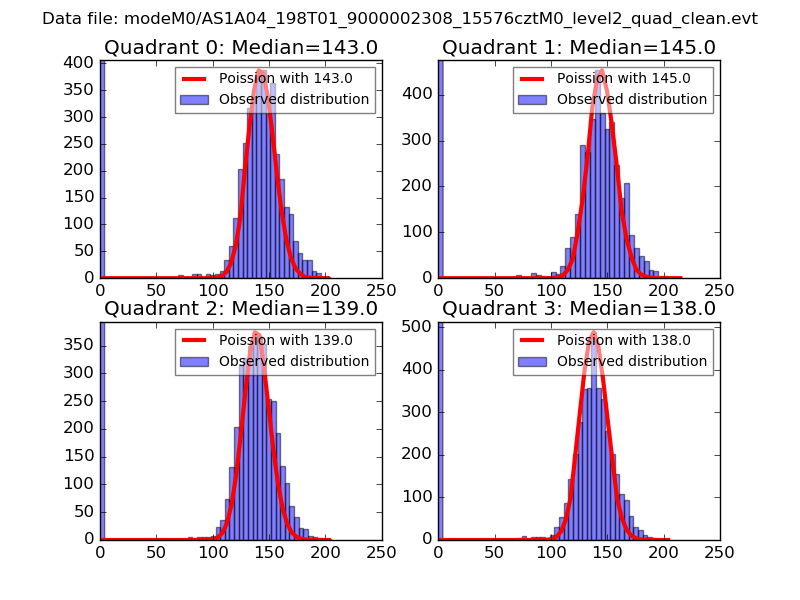 |
 |
| Quadrant-wise count rates Data is divided into 100 sec bins |
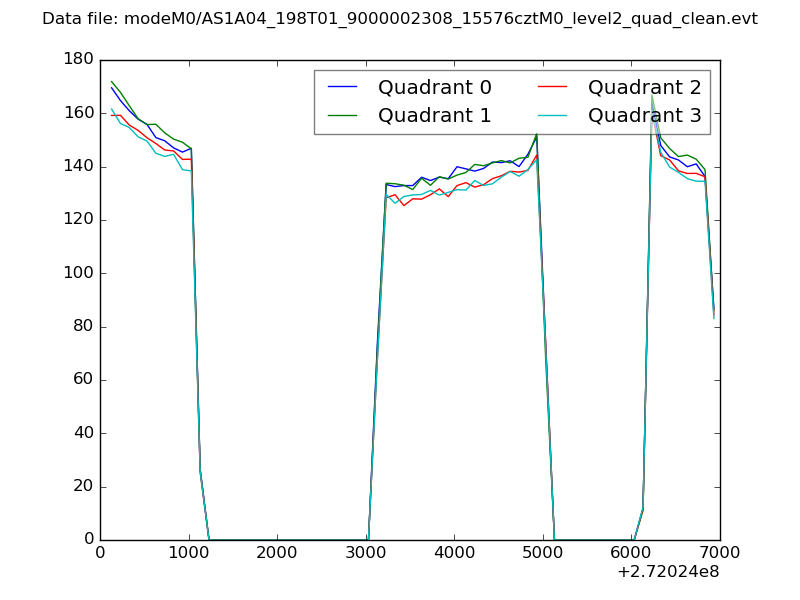 |
|
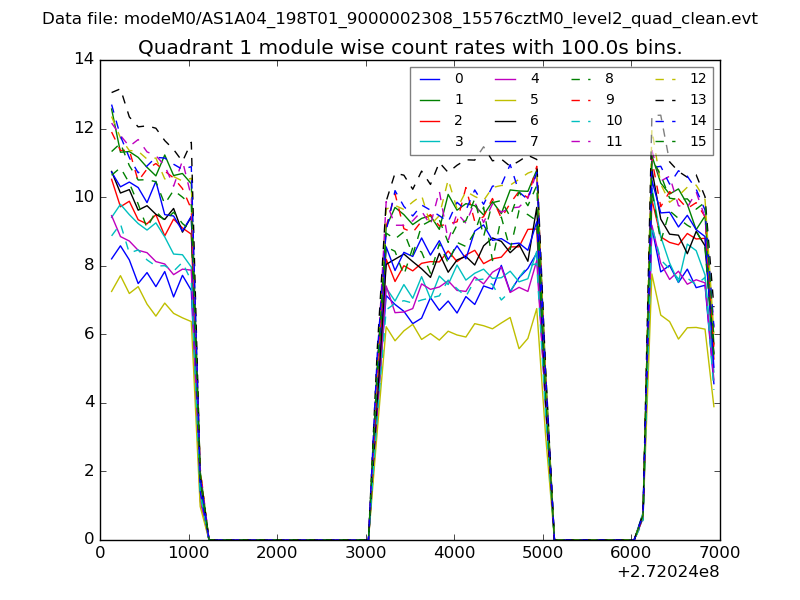
| Module-wise count rates for Quadrant A Data is divided into 100 sec bins |
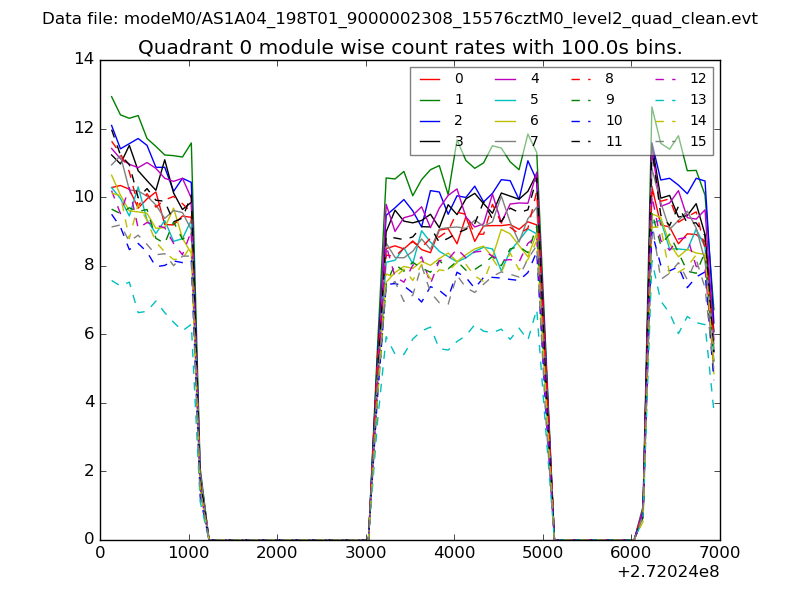 |
 |
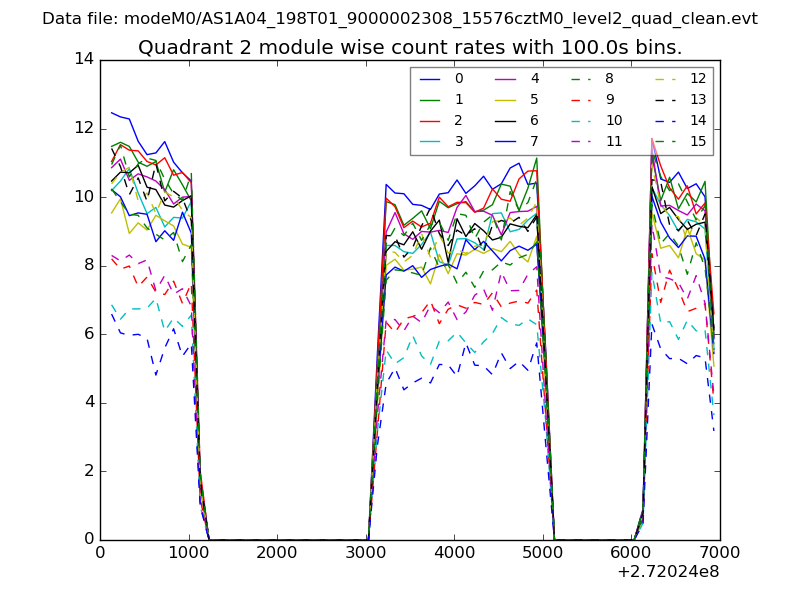
| Module-wise count rates for Quadrant B Data is divided into 100 sec bins |
 |
 |
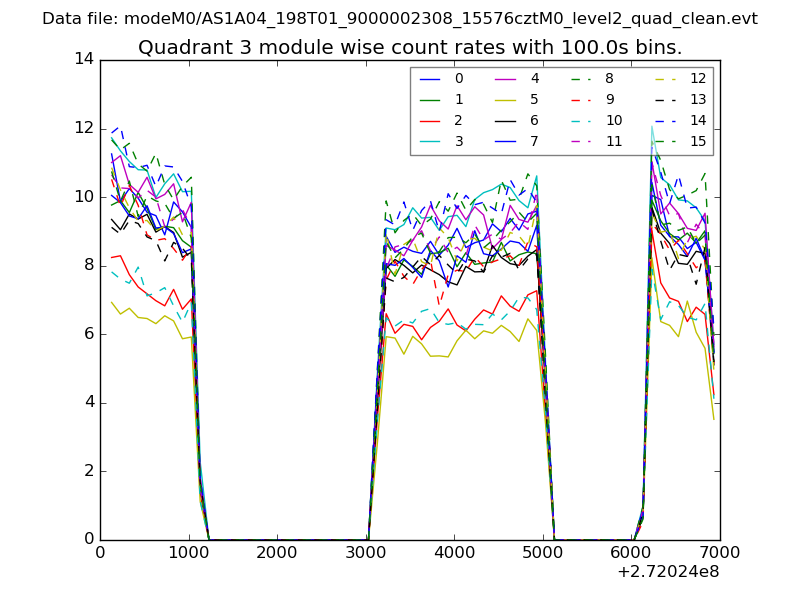
| Module-wise count rates for Quadrant C Data is divided into 100 sec bins |
 |
 |
| Module-wise count rates for Quadrant D Data is divided into 100 sec bins |
 |
 |
| Parameter | Plot |
|---|---|
| CZT HV Monitor | 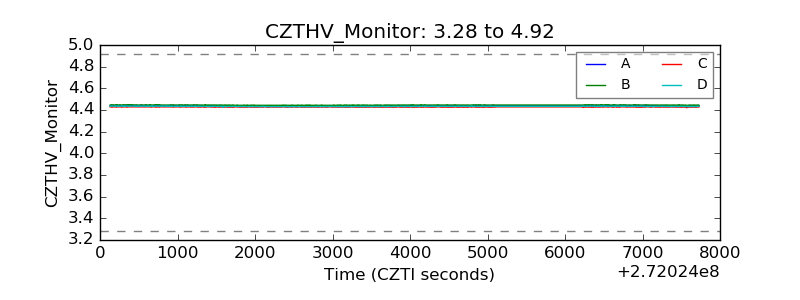 |
| D_VDD | 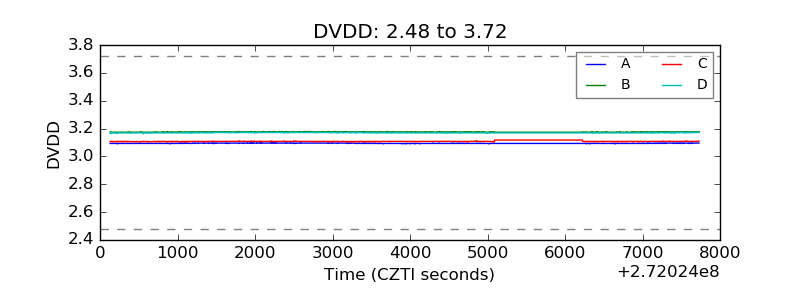 |
| Temperature 1 | 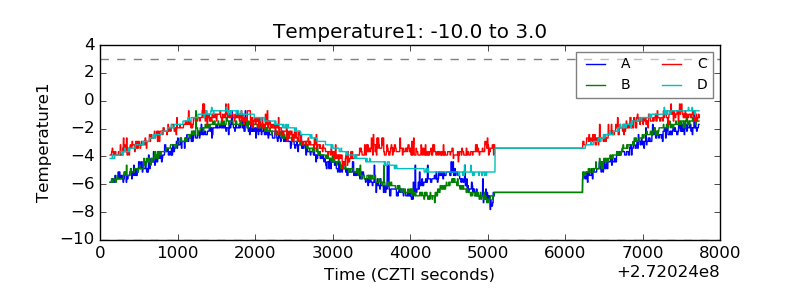 |
| Veto HV Monitor | 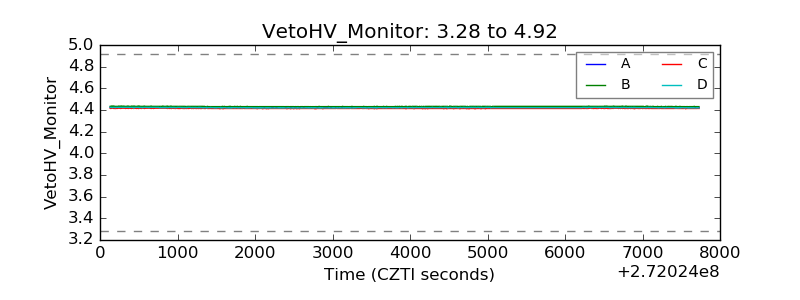 |
| Veto LLD | 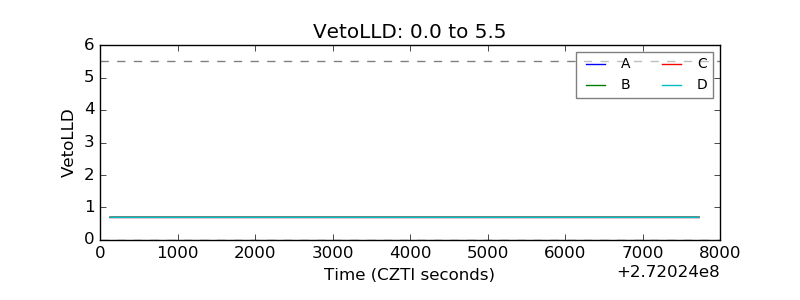 |
| Alpha Counter | 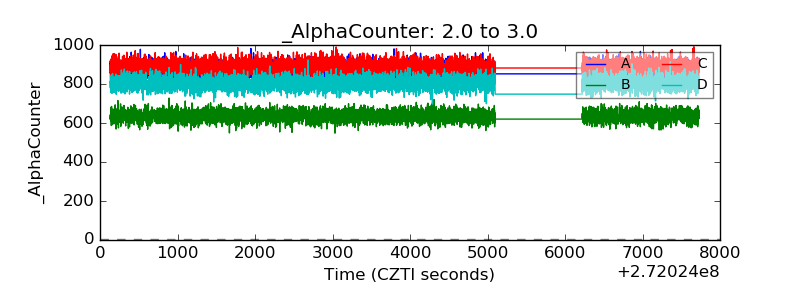 |
| _CPM_Rate | 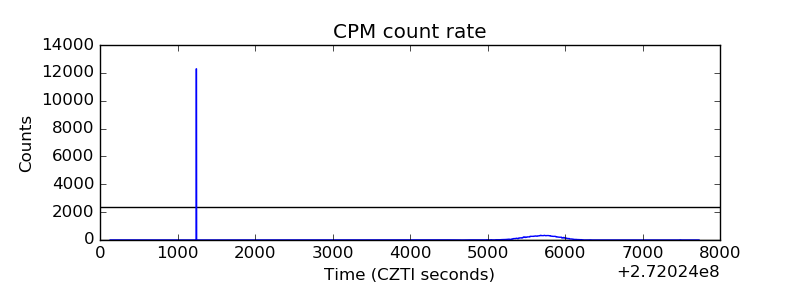 |
| CZT Counter | 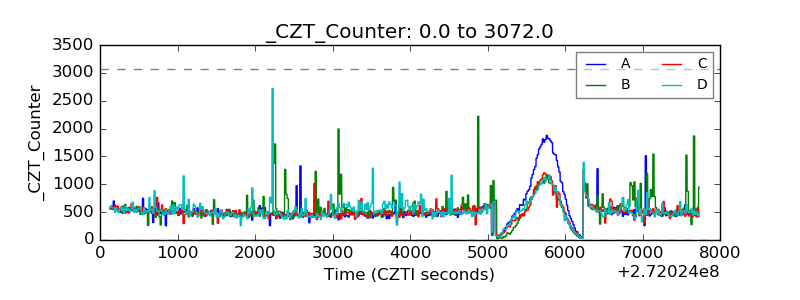 |
| +2.5 Volts monitor |  |
| +5 Volts monitor |  |
| _ROLL_ROT | 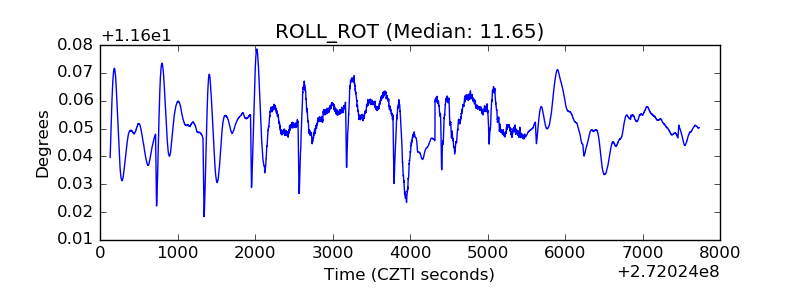 |
| _Roll_DEC | 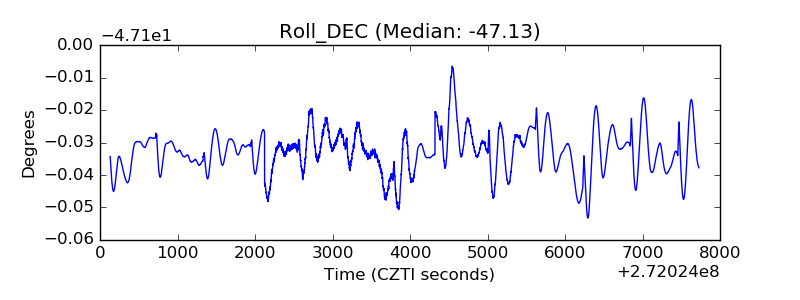 |
| _Roll_RA | 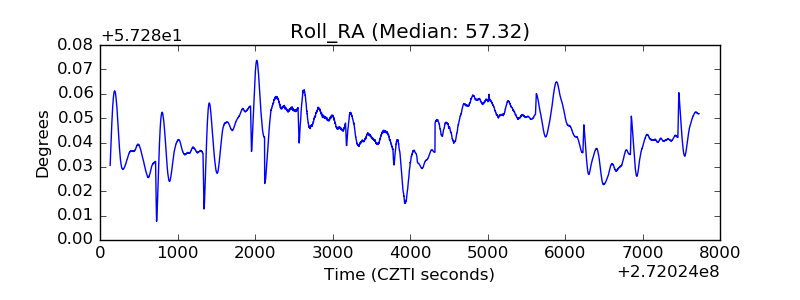 |
| Veto Counter | 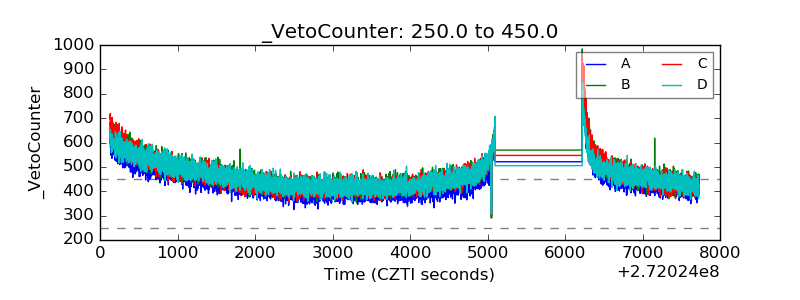 |