| Param | Original file | Final file |
|---|---|---|
| Filename | modeM0/AS1A04_198T01_9000002308_15577cztM0_level2.evt | modeM0/AS1A04_198T01_9000002308_15577cztM0_level2_quad_clean.evt |
| Size (bytes) | 523,990,080 | 84,507,840 |
| Size | 499.7 MB | 80.6 MB |
| Events in quadrant A | 3,464,655 | 524,738 |
| Events in quadrant B | 4,060,566 | 525,159 |
| Events in quadrant C | 3,562,347 | 506,819 |
| Events in quadrant D | 4,297,469 | 505,829 |
| Mode M0 | |||
|---|---|---|---|
| Quadrant | BADHDUFLAG | Total packets | Discarded packets |
| A | 0 | 14769 | 3 |
| B | 0 | 16514 | 2 |
| C | 0 | 14855 | 2 |
| D | 0 | 17408 | 2 |
| Mode SS | |||
|---|---|---|---|
| Quadrant | BADHDUFLAG | Total packets | Discarded packets |
| A | 0 | 144 | 0 |
| B | 0 | 144 | 0 |
| C | 0 | 144 | 0 |
| D | 0 | 144 | 0 |
| Mode M9 | |||
|---|---|---|---|
| Quadrant | BADHDUFLAG | Total packets | Discarded packets |
| A | 0 | 7 | 0 |
| B | 0 | 7 | 0 |
| C | 0 | 7 | 0 |
| D | 0 | 8 | 0 |
| Quadrant | Total seconds | Saturated seconds | Saturation percentage |
|---|---|---|---|
| A | 7130 | 140 | 1.963534% |
| B | 7130 | 219 | 3.071529% |
| C | 7130 | 151 | 2.117812% |
| D | 7130 | 385 | 5.399719% |
Noise dominated data is calculated using 1-second bins in cleaned event files. If a bin has >2000 counts, and if more than 50% of those come from <1% of pixels, then it is considered to be noise-dominated and hence unusable.
| Quadrant | # 1 sec bins | Bins with >0 counts | Bins with >2000 counts | High rate bins dominated by noise | Noise dominated (total time) | Noise dominated (detector-on time) | Marked lightcurve |
|---|---|---|---|---|---|---|---|
| A | 7866 | 7131 | 0 | 0 | 0.00% | 0.00% | 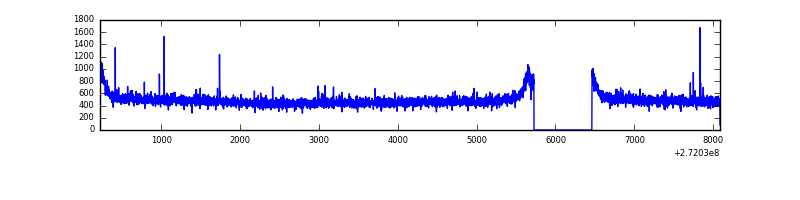 |
| B | 7865 | 7130 | 53 | 53 | 0.67% | 0.74% | 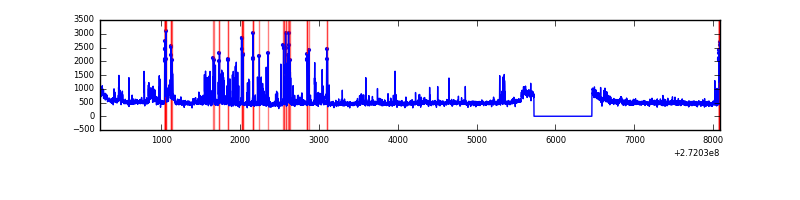 |
| C | 7866 | 7131 | 0 | 0 | 0.00% | 0.00% | 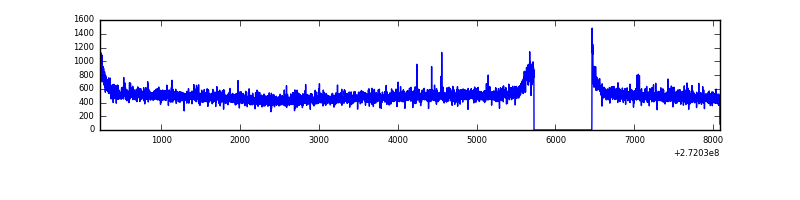 |
| D | 7865 | 7130 | 261 | 261 | 3.32% | 3.66% | 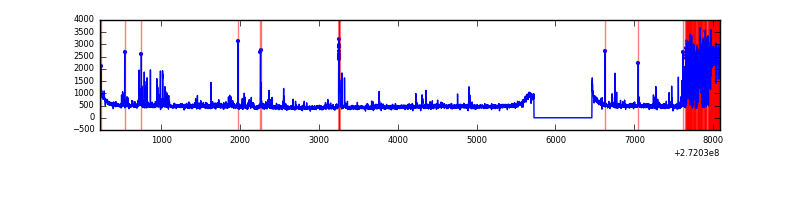 |
Top three noisy pixels from each quadrant. If the there are fewer than three noisy pixels in the level2.evt file, extra rows are filled as -1
| Pixel properties | Quadrant properties | ||||||
|---|---|---|---|---|---|---|---|
| Quadrant | DetID | PixID | Counts | Sigma | Mean | Median | Sigma |
| A | 9 | 143 | 12998 | 66.77 | 896 | 876 | 181.5 |
| A | 0 | 226 | 7993 | 39.2 | 896 | 876 | 181.5 |
| A | 12 | 194 | 6853 | 32.92 | 896 | 876 | 181.5 |
| B | 5 | 65 | 364899 | 2160.54 | 884 | 861 | 168.5 |
| B | 0 | 189 | 65881 | 385.89 | 884 | 861 | 168.5 |
| B | 4 | 173 | 63362 | 370.94 | 884 | 861 | 168.5 |
| C | 14 | 238 | 132190 | 658.69 | 855 | 858 | 199.4 |
| C | 3 | 233 | 86337 | 428.71 | 855 | 858 | 199.4 |
| C | 0 | 207 | 10671 | 49.21 | 855 | 858 | 199.4 |
| D | 12 | 110 | 755485 | 3593.2 | 866 | 841 | 210.0 |
| D | 1 | 52 | 63862 | 300.07 | 866 | 841 | 210.0 |
| D | 7 | 223 | 58605 | 275.04 | 866 | 841 | 210.0 |
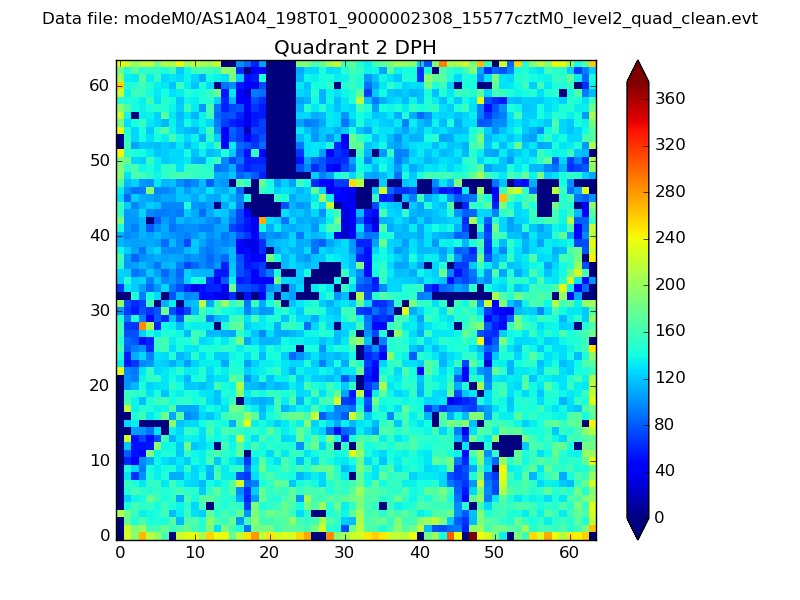
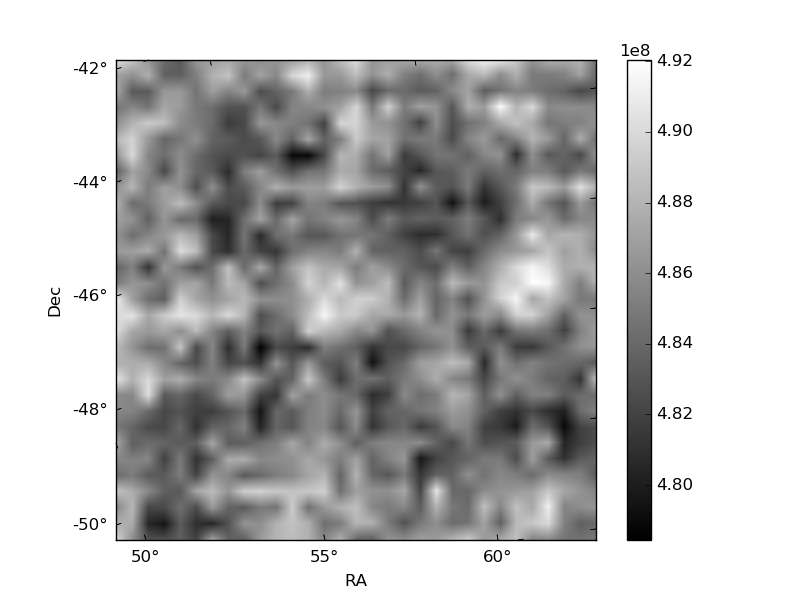
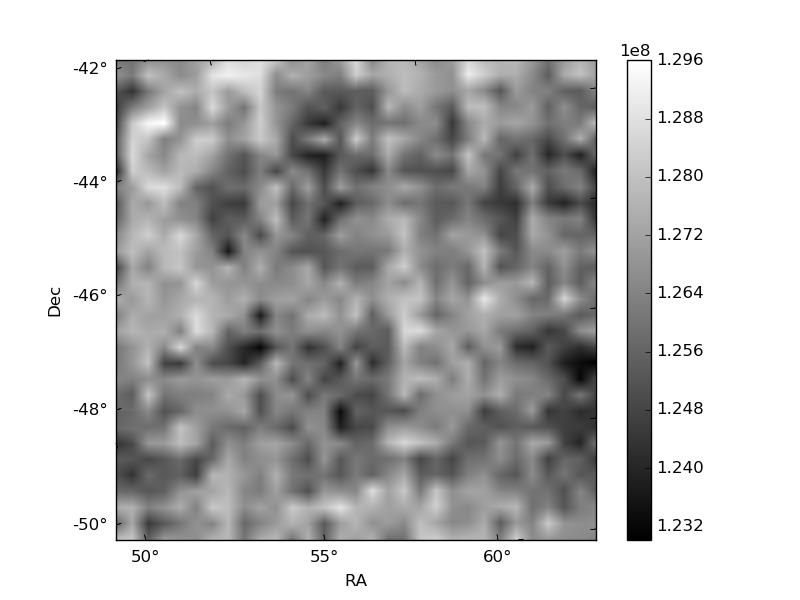
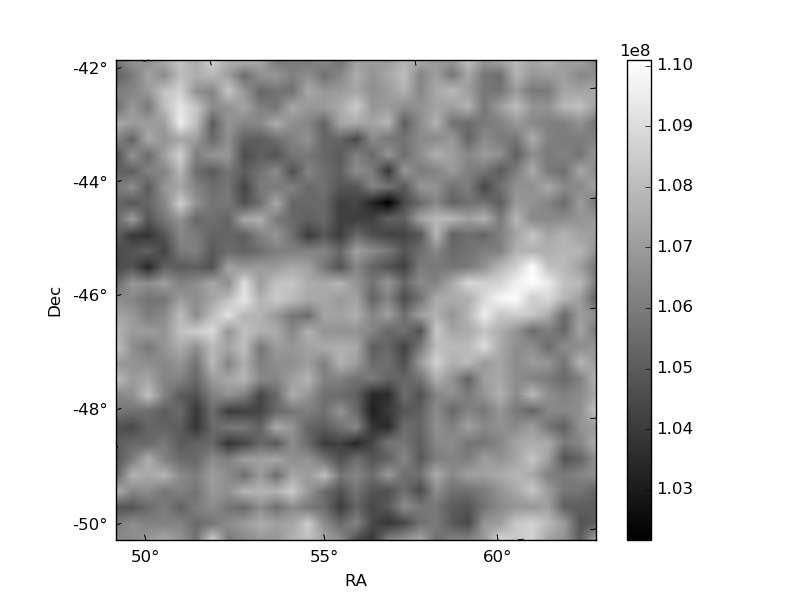
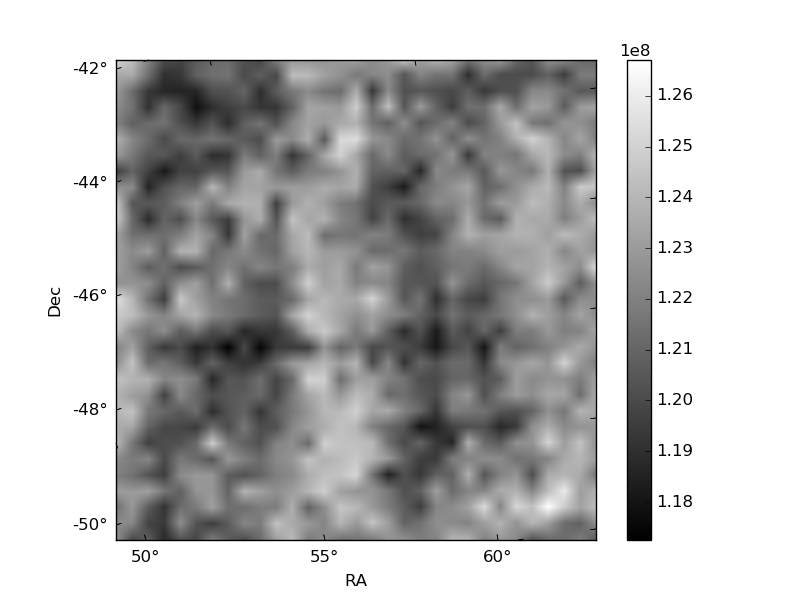
Histogram calculated using DETX and DETY for each event in the final _common_clean file
| Quadrant A | 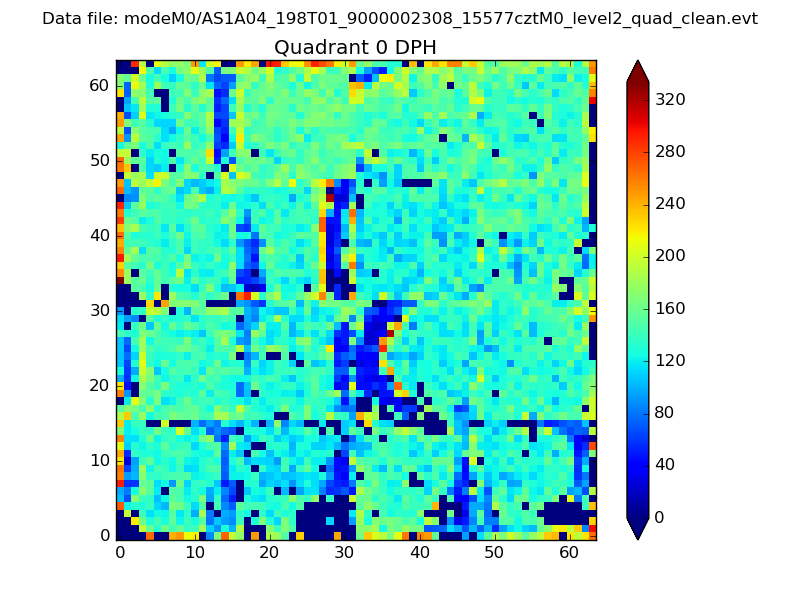 |
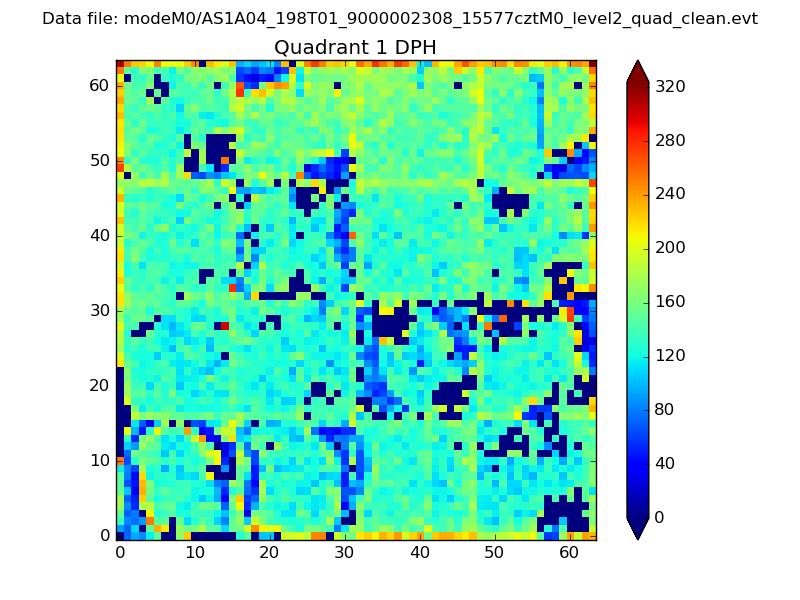 |
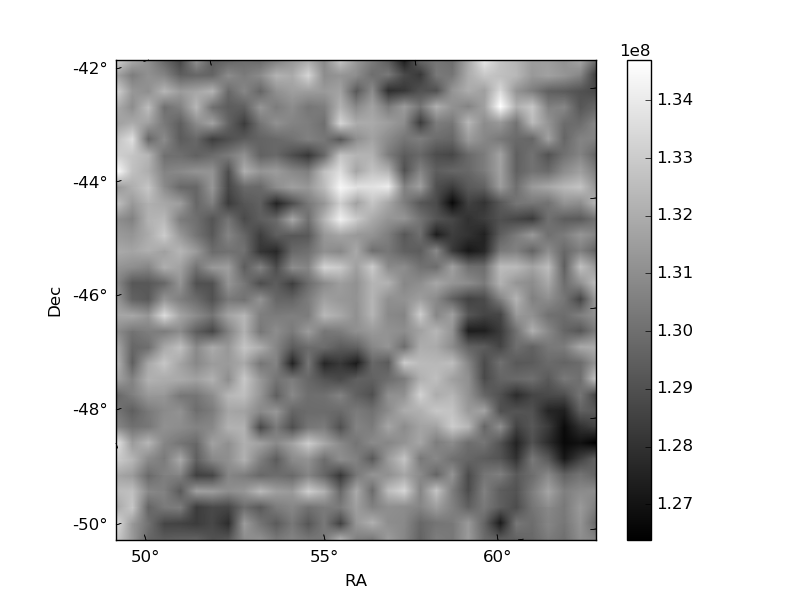
Quadrant B |
|---|---|---|---|
| Quadrant D | 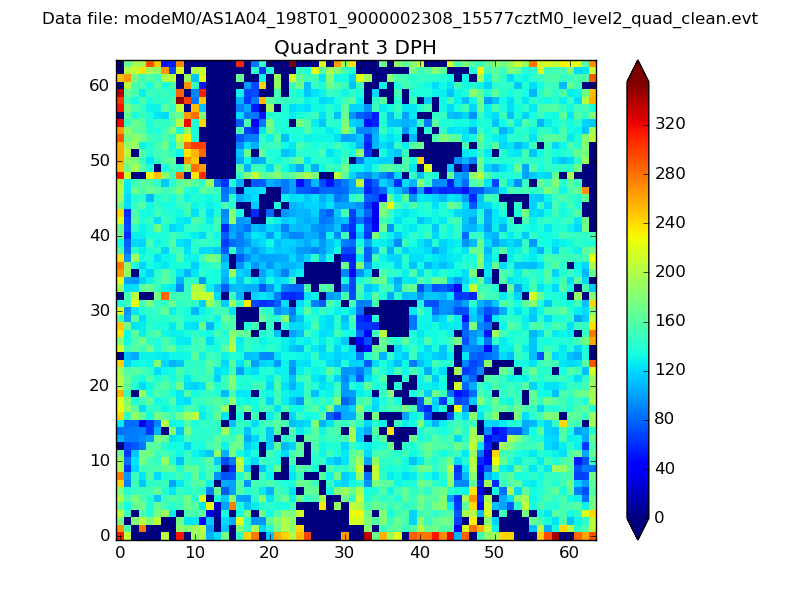 |
 |
Quadrant C |
| Plot type | Count rate plots | Images |
|---|---|---|
| Comparison with Poisson distribution Blue bars denote a histogram of data divided into 1 sec bins. Red curve is a Poisson curve with rate = median count rate of data. |
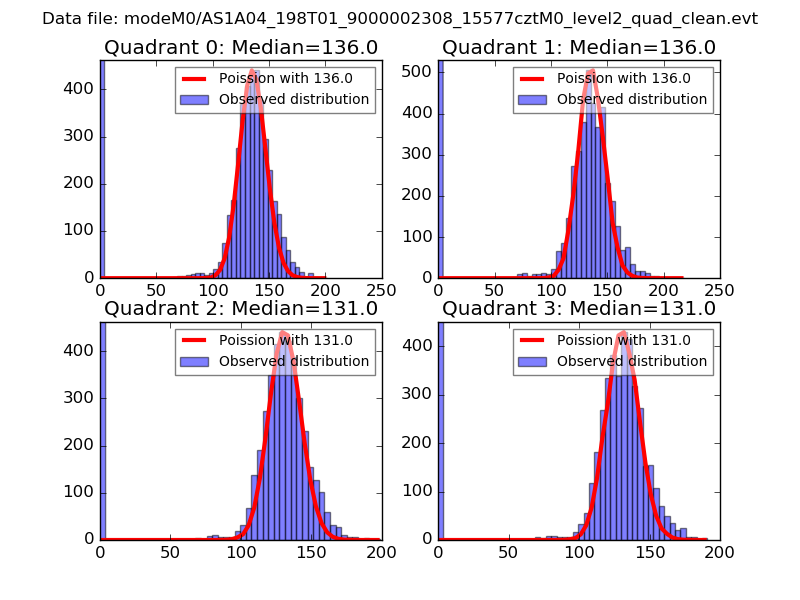 |
 |
| Quadrant-wise count rates Data is divided into 100 sec bins |
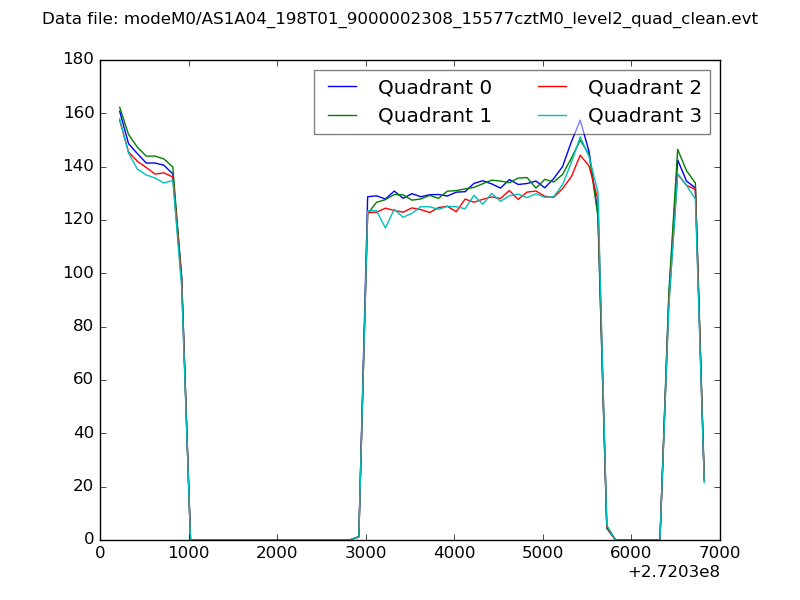 |
|
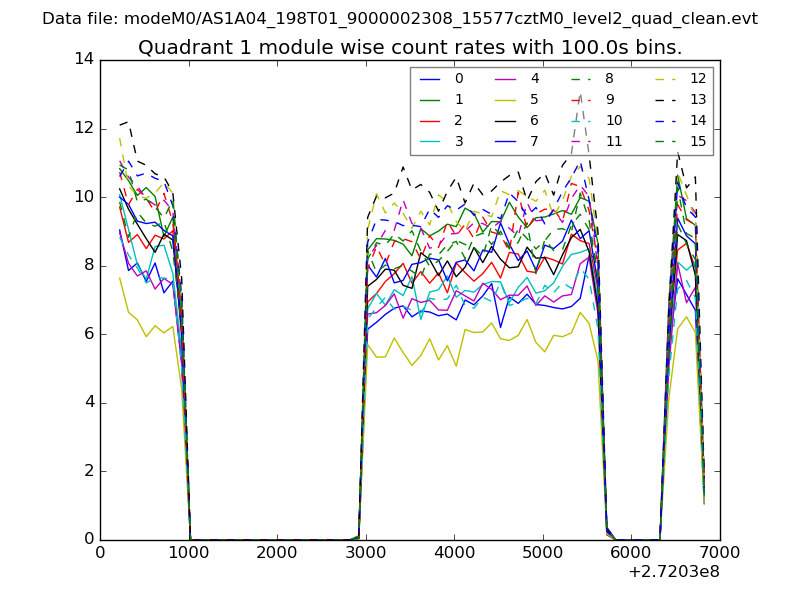
| Module-wise count rates for Quadrant A Data is divided into 100 sec bins |
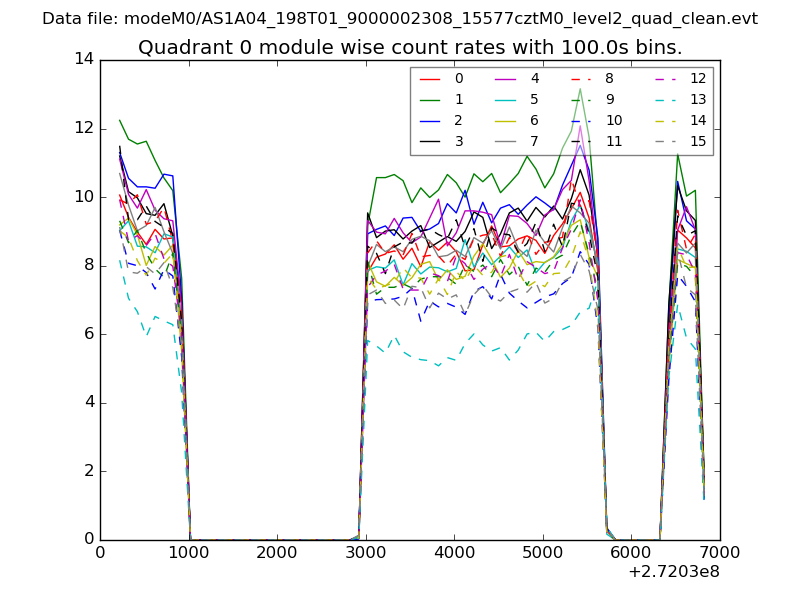 |
 |
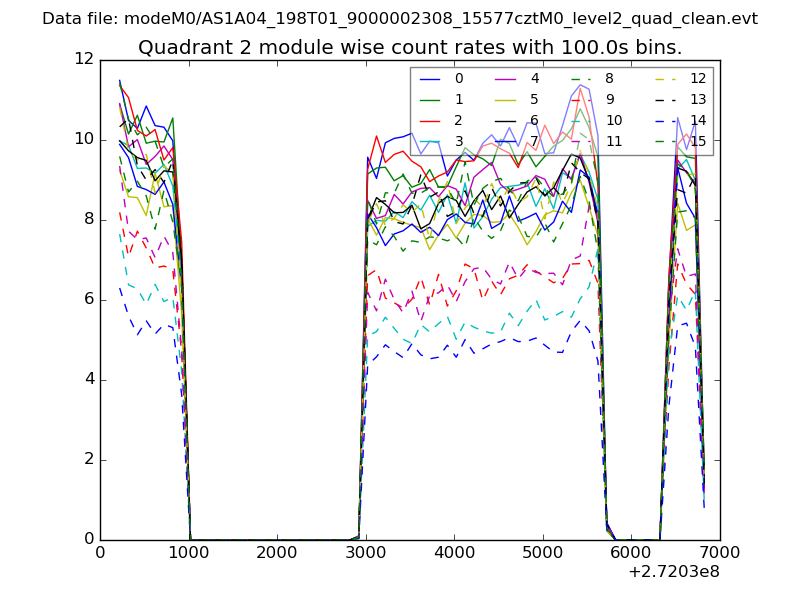
| Module-wise count rates for Quadrant B Data is divided into 100 sec bins |
 |
 |
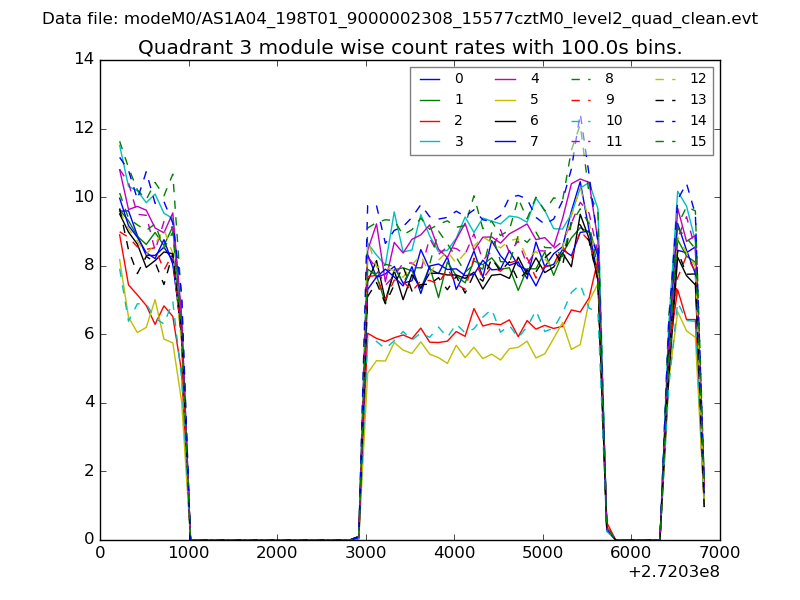
| Module-wise count rates for Quadrant C Data is divided into 100 sec bins |
 |
 |
| Module-wise count rates for Quadrant D Data is divided into 100 sec bins |
 |
 |
| Parameter | Plot |
|---|---|
| CZT HV Monitor | 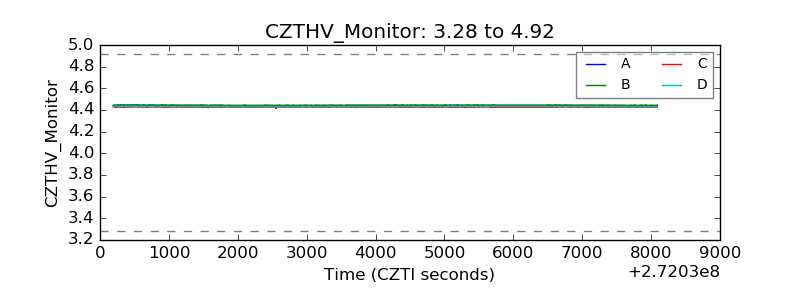 |
| D_VDD | 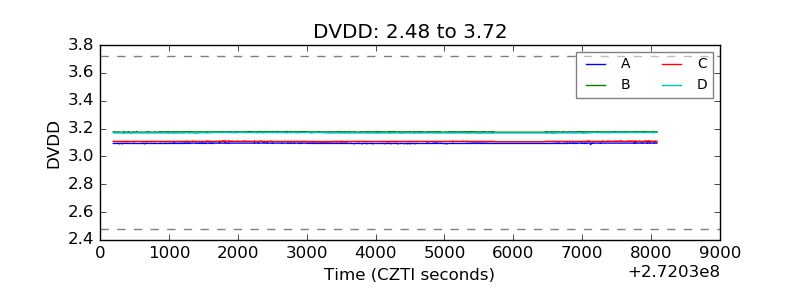 |
| Temperature 1 | 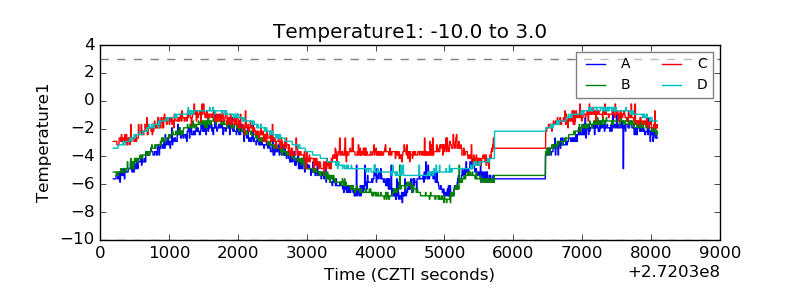 |
| Veto HV Monitor | 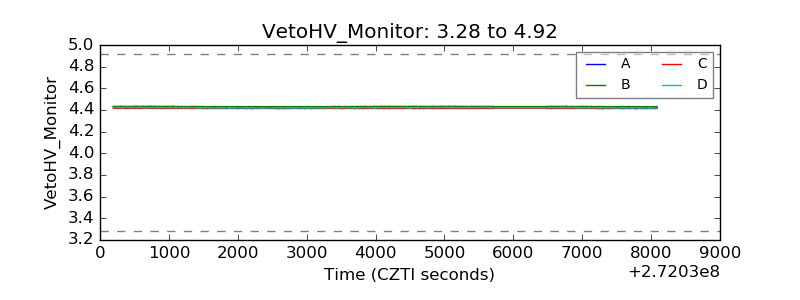 |
| Veto LLD | 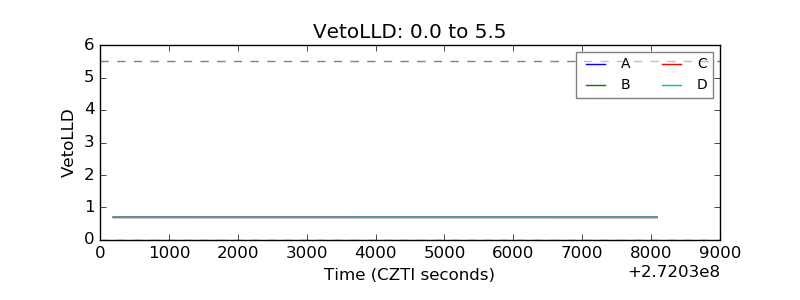 |
| Alpha Counter | 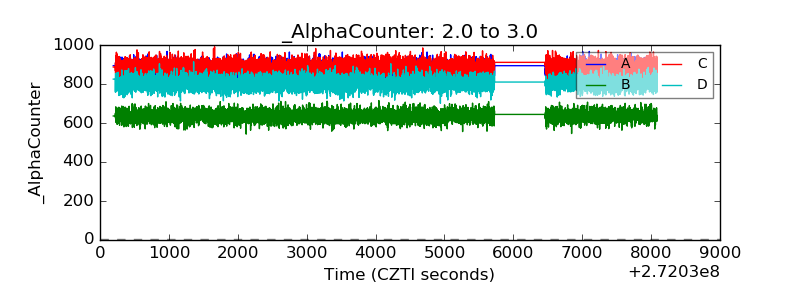 |
| _CPM_Rate | 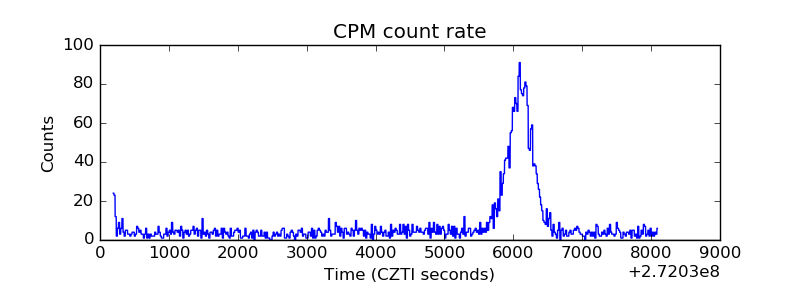 |
| CZT Counter | 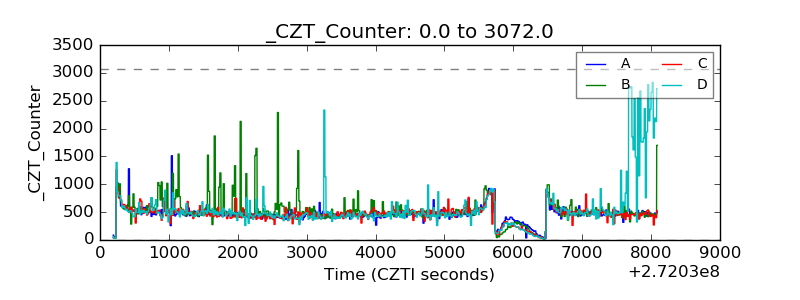 |
| +2.5 Volts monitor | 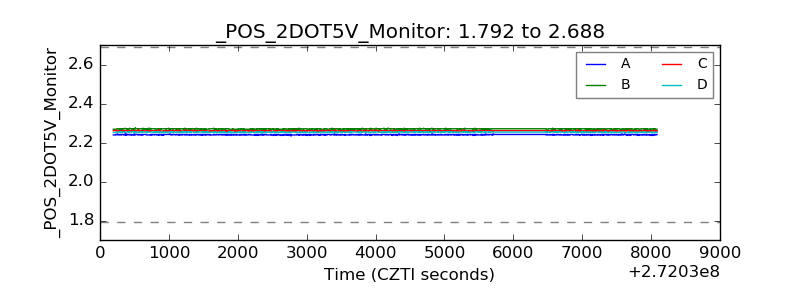 |
| +5 Volts monitor | 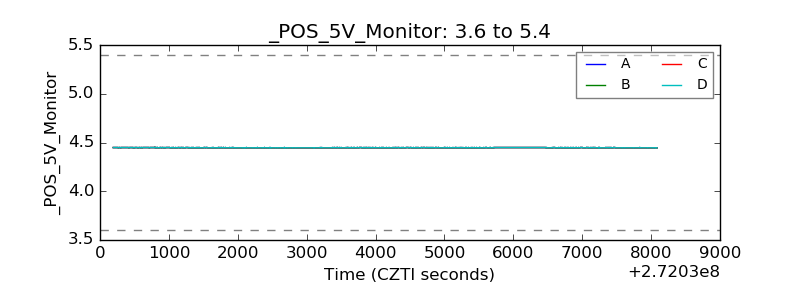 |
| _ROLL_ROT | 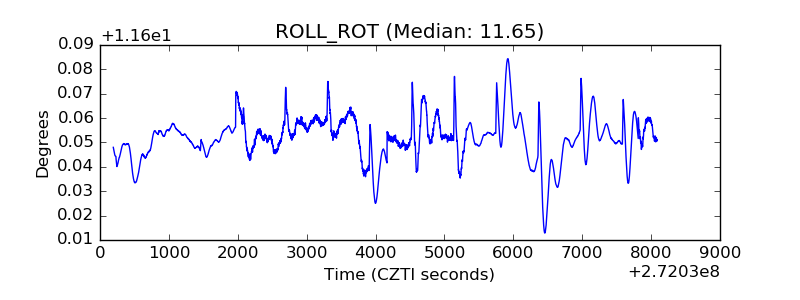 |
| _Roll_DEC | 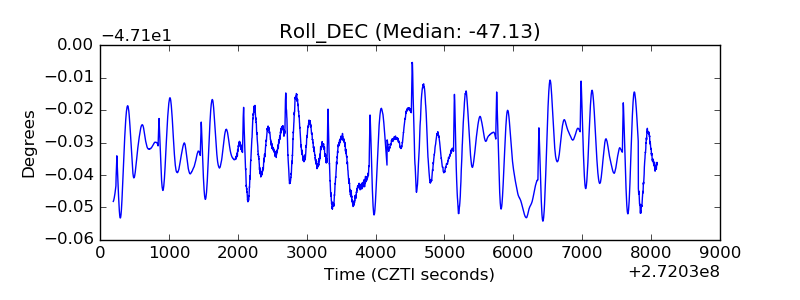 |
| _Roll_RA | 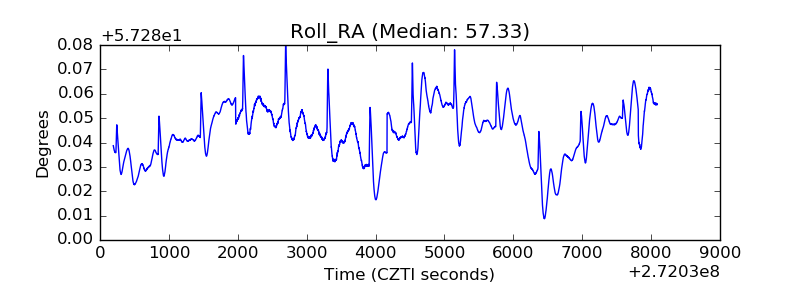 |
| Veto Counter | 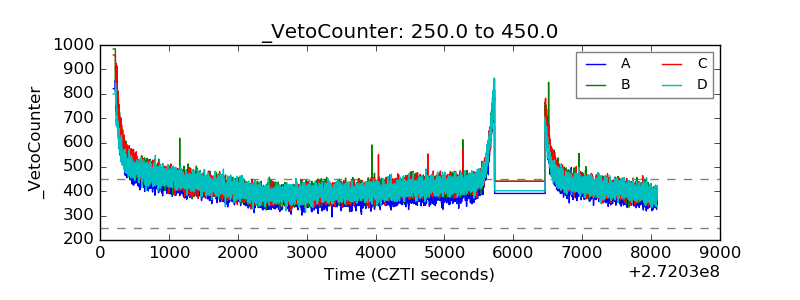 |