| Param | Original file | Final file |
|---|---|---|
| Filename | modeM0/AS1A04_198T01_9000002308_15579cztM0_level2.evt | modeM0/AS1A04_198T01_9000002308_15579cztM0_level2_quad_clean.evt |
| Size (bytes) | 522,861,120 | 79,496,640 |
| Size | 498.6 MB | 75.8 MB |
| Events in quadrant A | 3,615,962 | 477,878 |
| Events in quadrant B | 3,797,400 | 480,896 |
| Events in quadrant C | 3,755,664 | 466,162 |
| Events in quadrant D | 4,153,772 | 457,578 |
| Mode M0 | |||
|---|---|---|---|
| Quadrant | BADHDUFLAG | Total packets | Discarded packets |
| A | 0 | 15764 | 3 |
| B | 0 | 16104 | 2 |
| C | 0 | 15926 | 2 |
| D | 0 | 17303 | 2 |
| Mode SS | |||
|---|---|---|---|
| Quadrant | BADHDUFLAG | Total packets | Discarded packets |
| A | 0 | 154 | 0 |
| B | 0 | 154 | 0 |
| C | 0 | 154 | 0 |
| D | 0 | 154 | 0 |
| Mode M9 | |||
|---|---|---|---|
| Quadrant | BADHDUFLAG | Total packets | Discarded packets |
| A | 0 | 3 | 0 |
| B | 0 | 3 | 0 |
| C | 0 | 3 | 0 |
| D | 0 | 3 | 0 |
| Quadrant | Total seconds | Saturated seconds | Saturation percentage |
|---|---|---|---|
| A | 7542 | 152 | 2.015381% |
| B | 7542 | 191 | 2.532485% |
| C | 7542 | 147 | 1.949085% |
| D | 7543 | 221 | 2.929869% |
Noise dominated data is calculated using 1-second bins in cleaned event files. If a bin has >2000 counts, and if more than 50% of those come from <1% of pixels, then it is considered to be noise-dominated and hence unusable.
| Quadrant | # 1 sec bins | Bins with >0 counts | Bins with >2000 counts | High rate bins dominated by noise | Noise dominated (total time) | Noise dominated (detector-on time) | Marked lightcurve |
|---|---|---|---|---|---|---|---|
| A | 7768 | 7544 | 5 | 5 | 0.06% | 0.07% | 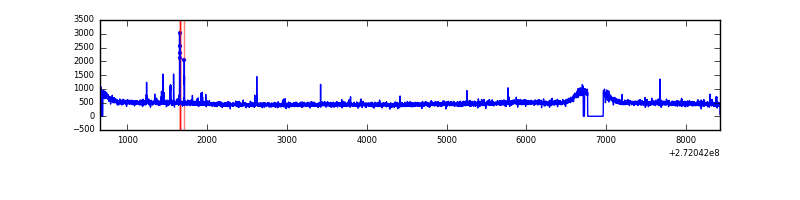 |
| B | 7768 | 7544 | 9 | 9 | 0.12% | 0.12% | 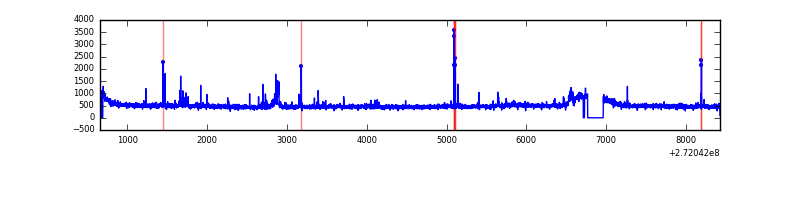 |
| C | 7768 | 7544 | 1 | 1 | 0.01% | 0.01% |  |
| D | 7769 | 7547 | 143 | 143 | 1.84% | 1.89% | 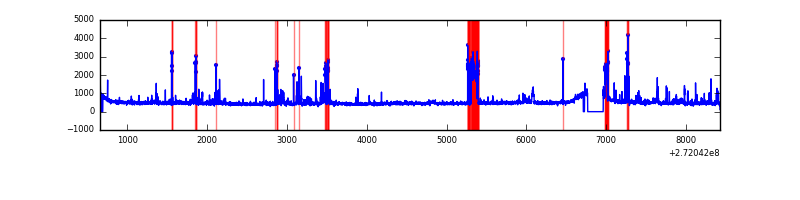 |
Top three noisy pixels from each quadrant. If the there are fewer than three noisy pixels in the level2.evt file, extra rows are filled as -1
| Pixel properties | Quadrant properties | ||||||
|---|---|---|---|---|---|---|---|
| Quadrant | DetID | PixID | Counts | Sigma | Mean | Median | Sigma |
| A | 13 | 248 | 32679 | 169.34 | 925 | 904 | 187.6 |
| A | 3 | 80 | 12081 | 59.57 | 925 | 904 | 187.6 |
| A | 9 | 143 | 10141 | 49.23 | 925 | 904 | 187.6 |
| B | 0 | 189 | 50687 | 280.51 | 921 | 896 | 177.5 |
| B | 5 | 65 | 38388 | 211.22 | 921 | 896 | 177.5 |
| B | 4 | 173 | 38081 | 209.49 | 921 | 896 | 177.5 |
| C | 3 | 233 | 162395 | 782.32 | 885 | 890 | 206.4 |
| C | 14 | 238 | 135082 | 650.01 | 885 | 890 | 206.4 |
| C | 13 | 61 | 6469 | 27.02 | 885 | 890 | 206.4 |
| D | 1 | 52 | 292376 | 1332.3 | 897 | 871 | 218.8 |
| D | 7 | 223 | 201404 | 916.52 | 897 | 871 | 218.8 |
| D | 5 | 51 | 86536 | 391.52 | 897 | 871 | 218.8 |
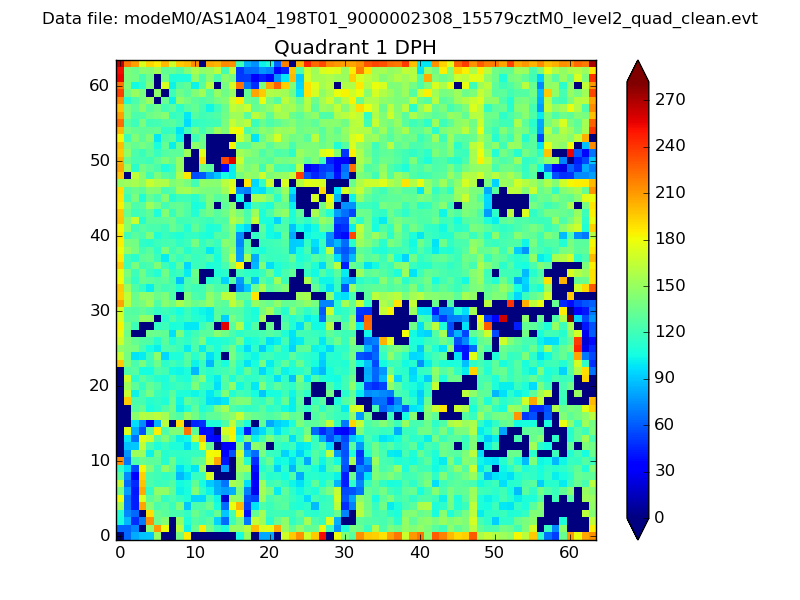
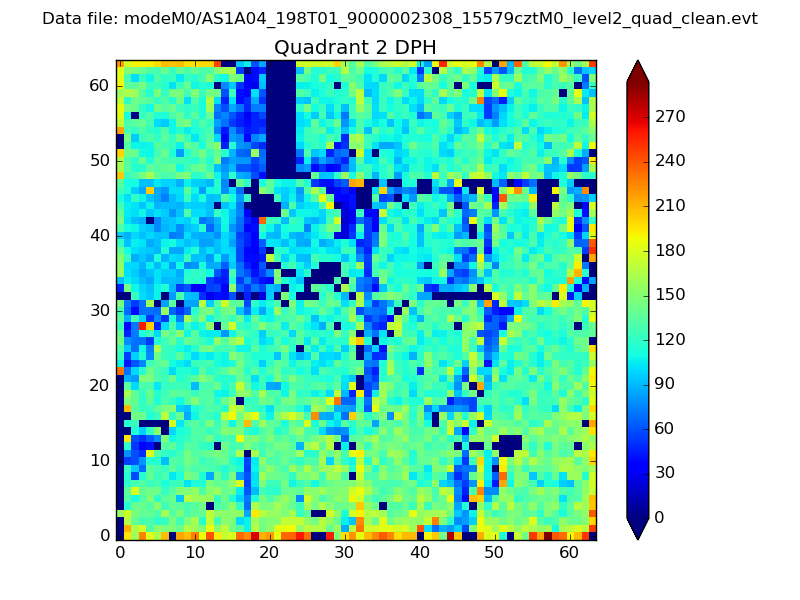
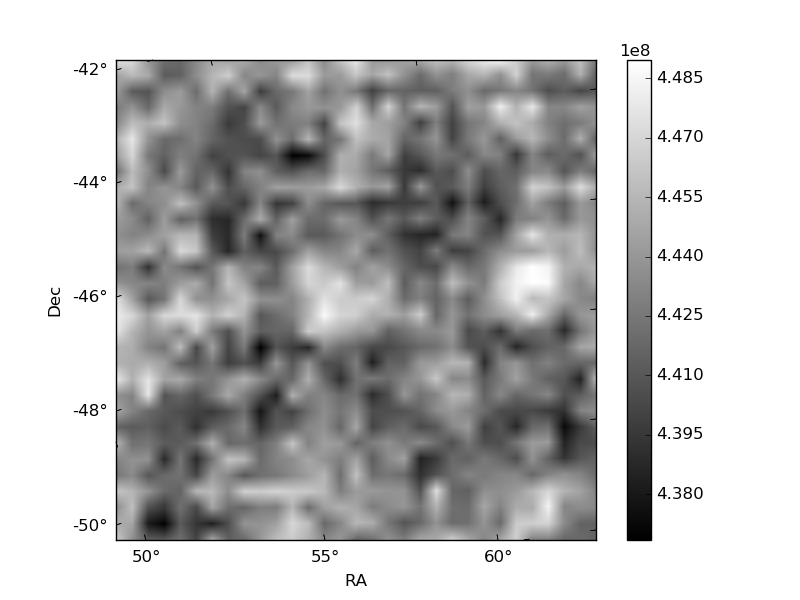
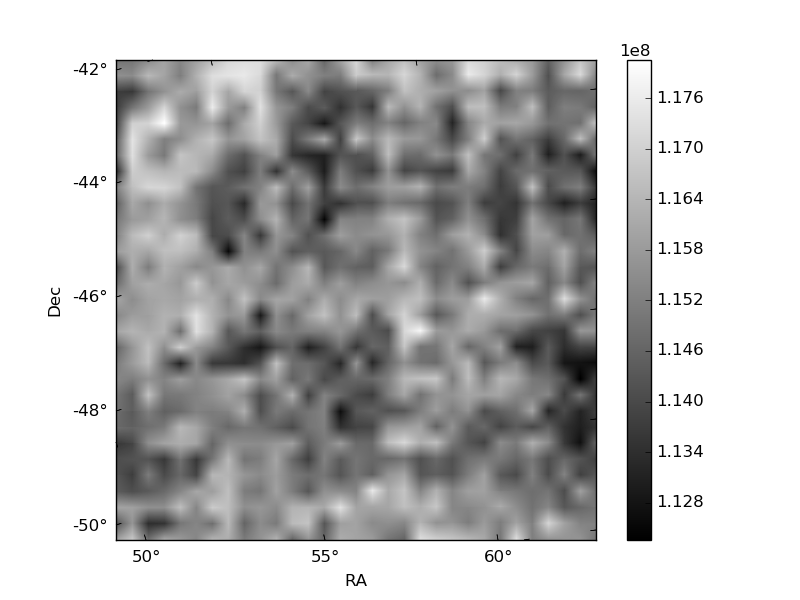
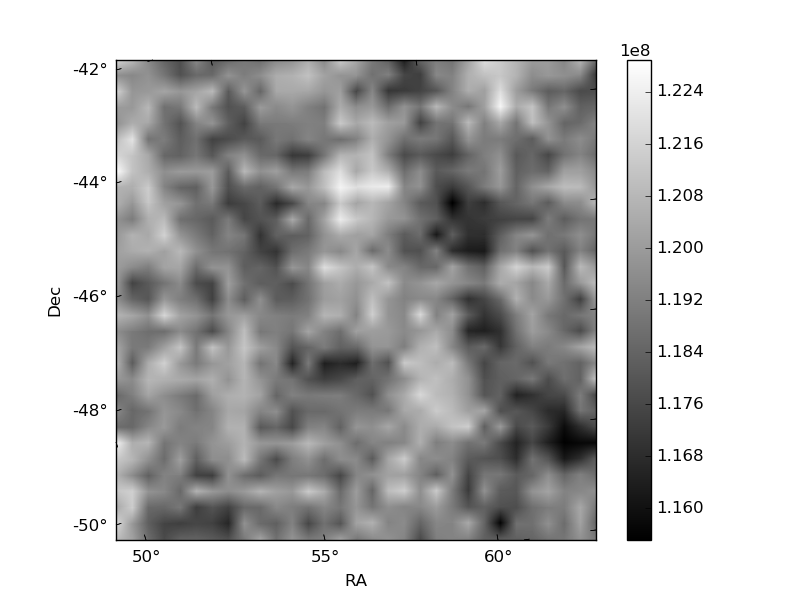
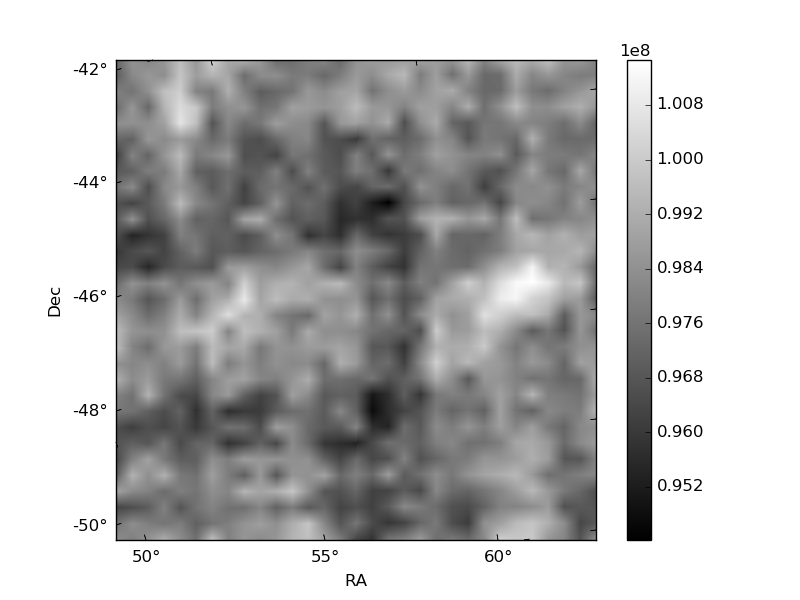
Histogram calculated using DETX and DETY for each event in the final _common_clean file
| Quadrant A | 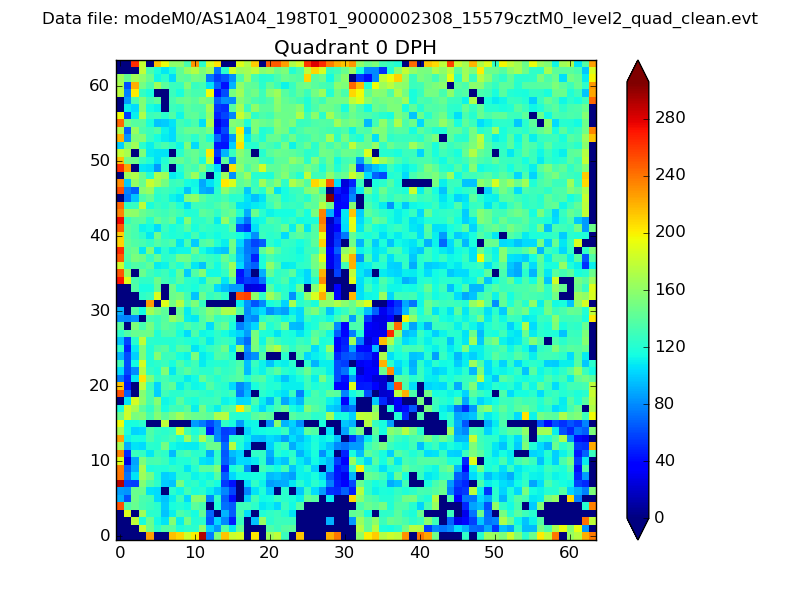 |
 |
Quadrant B |
|---|---|---|---|
| Quadrant D | 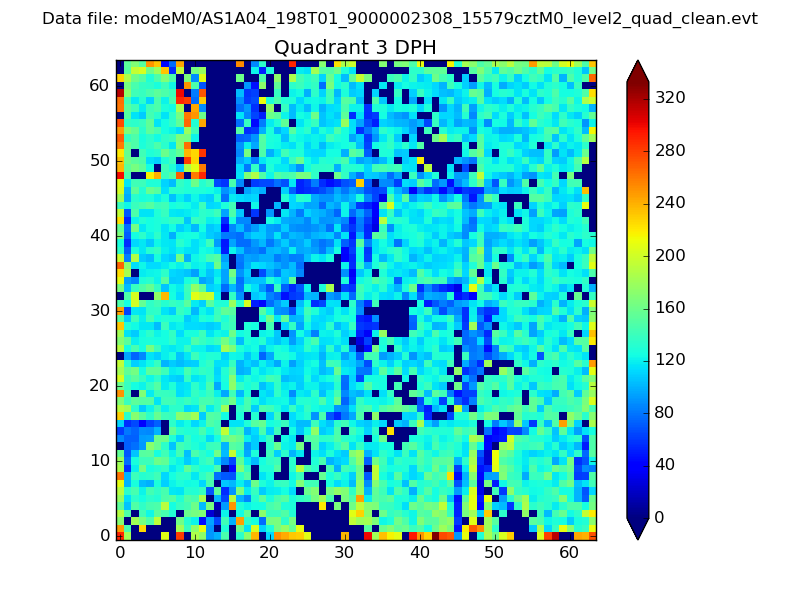 |
 |
Quadrant C |
| Plot type | Count rate plots | Images |
|---|---|---|
| Comparison with Poisson distribution Blue bars denote a histogram of data divided into 1 sec bins. Red curve is a Poisson curve with rate = median count rate of data. |
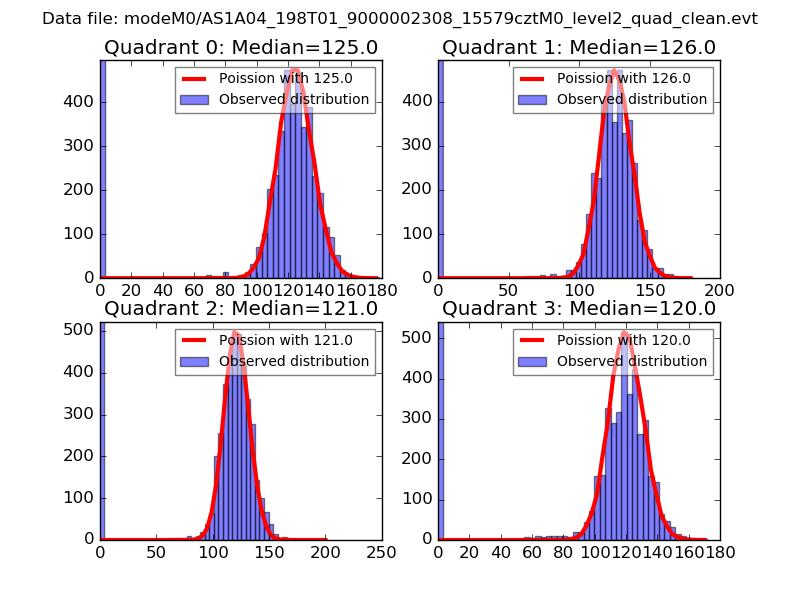 |
 |
| Quadrant-wise count rates Data is divided into 100 sec bins |
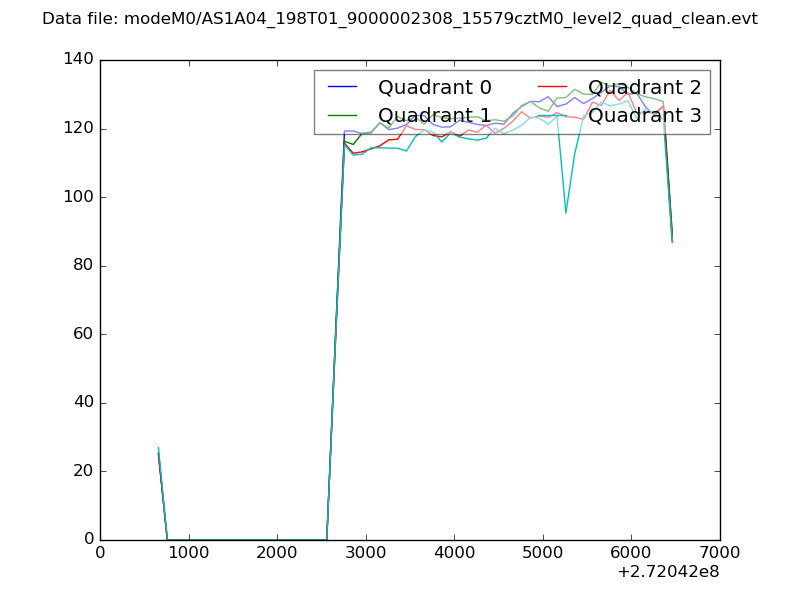 |
|
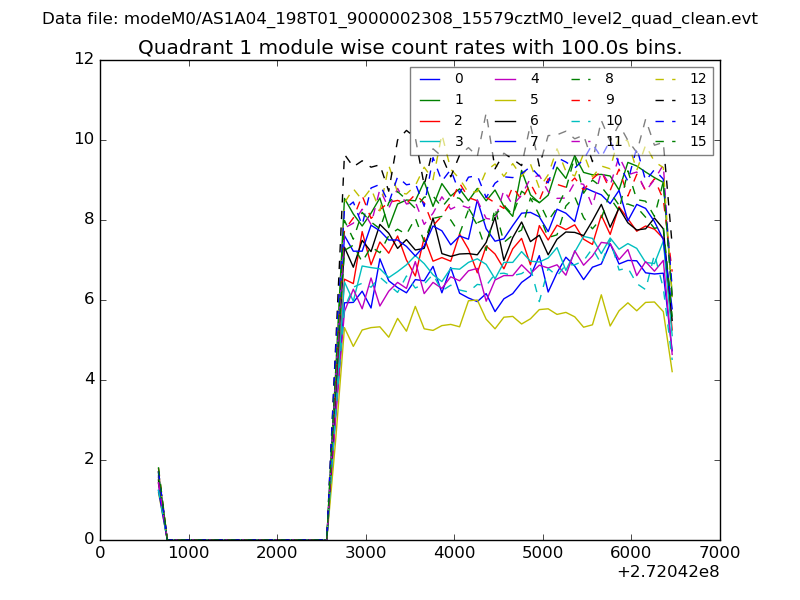
| Module-wise count rates for Quadrant A Data is divided into 100 sec bins |
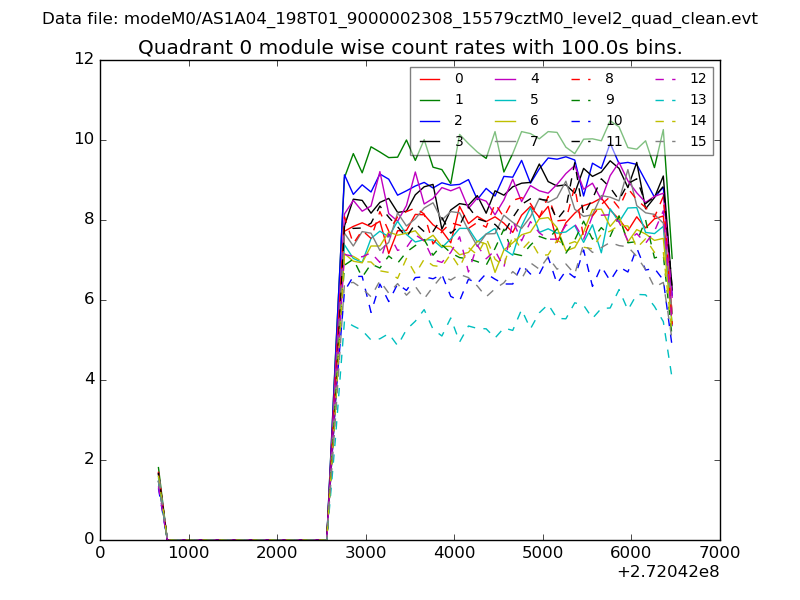 |
 |
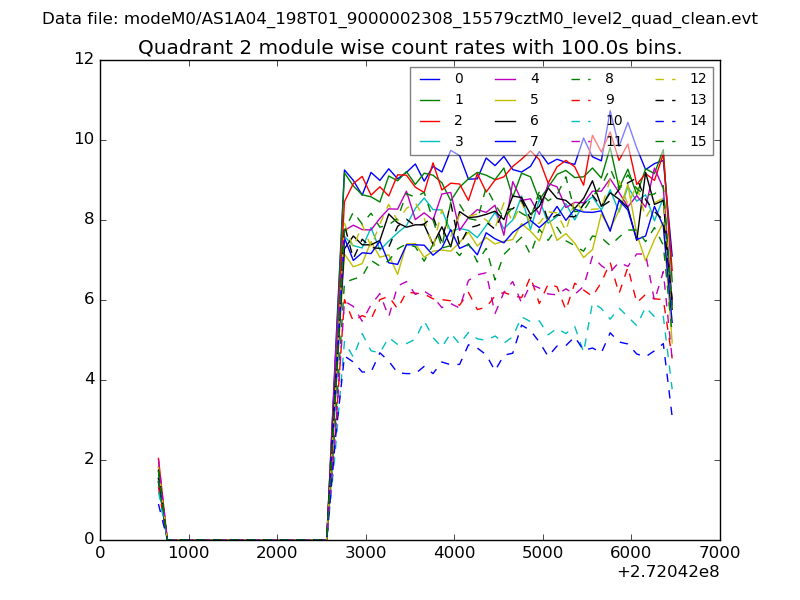
| Module-wise count rates for Quadrant B Data is divided into 100 sec bins |
 |
 |
| Module-wise count rates for Quadrant C Data is divided into 100 sec bins |
 |
 |
| Module-wise count rates for Quadrant D Data is divided into 100 sec bins |
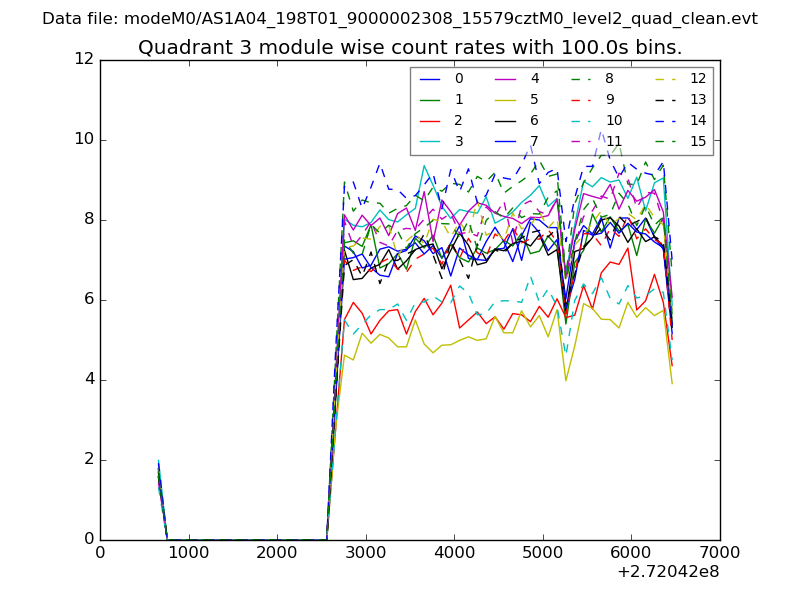 |
 |
| Parameter | Plot |
|---|---|
| CZT HV Monitor | 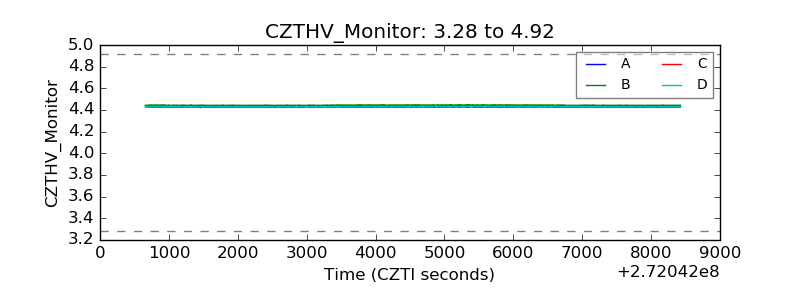 |
| D_VDD | 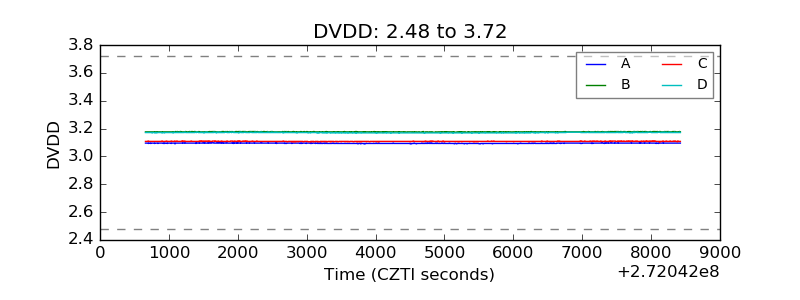 |
| Temperature 1 | 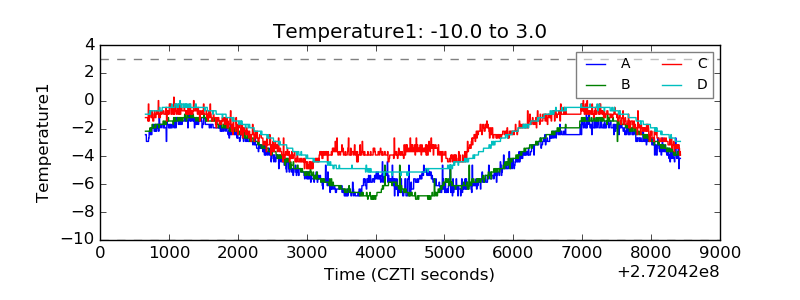 |
| Veto HV Monitor | 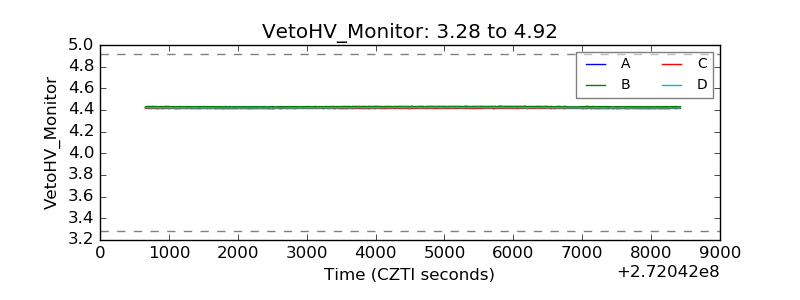 |
| Veto LLD | 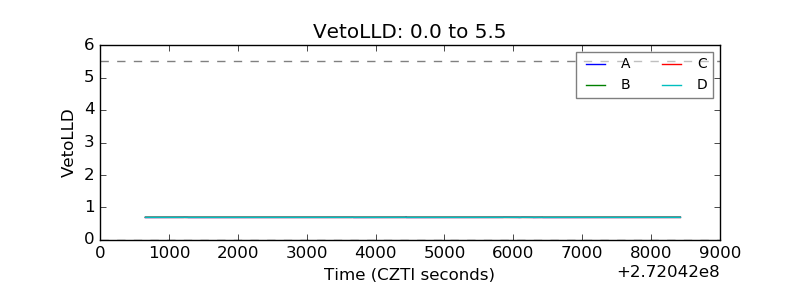 |
| Alpha Counter | 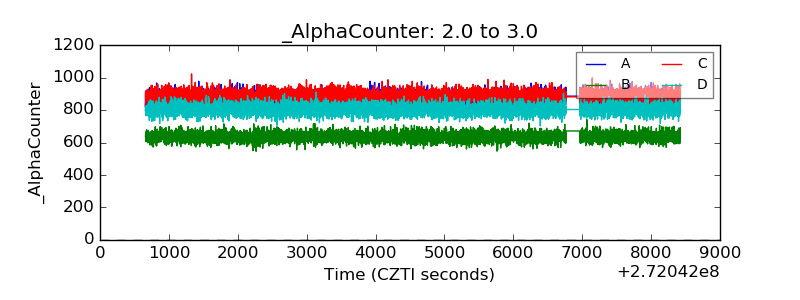 |
| _CPM_Rate | 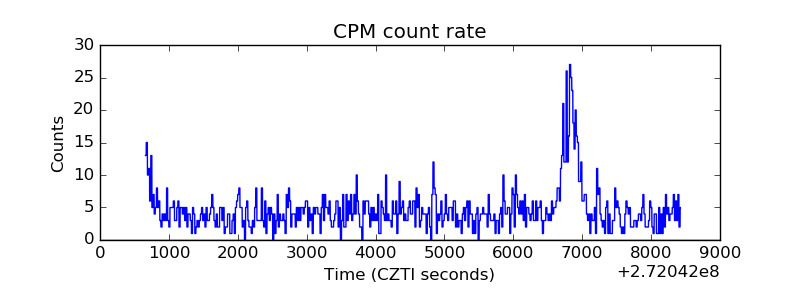 |
| CZT Counter | 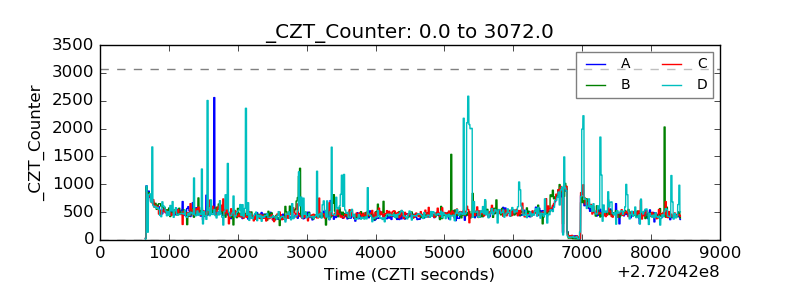 |
| +2.5 Volts monitor | 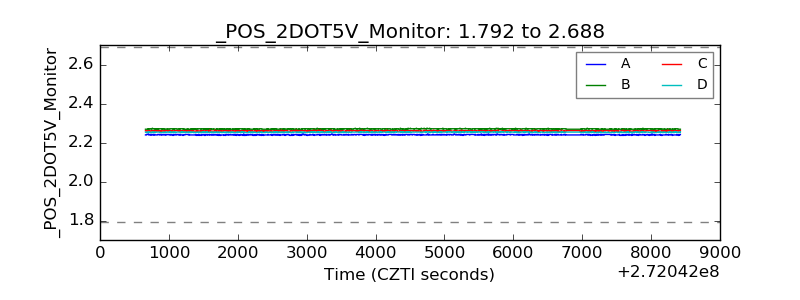 |
| +5 Volts monitor |  |
| _ROLL_ROT | 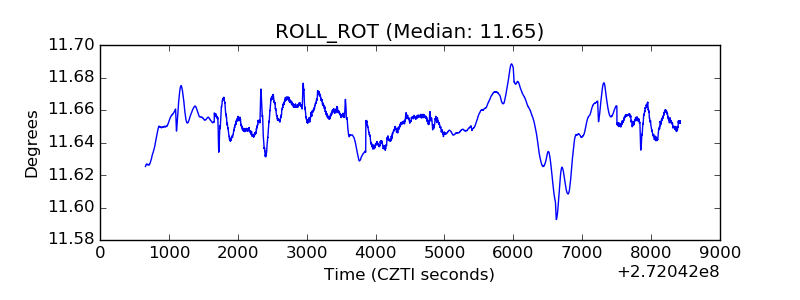 |
| _Roll_DEC | 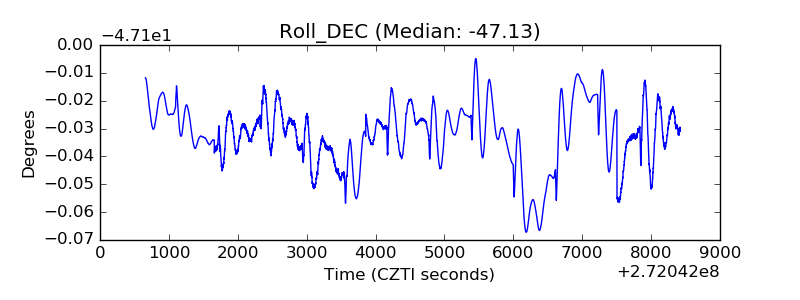 |
| _Roll_RA | 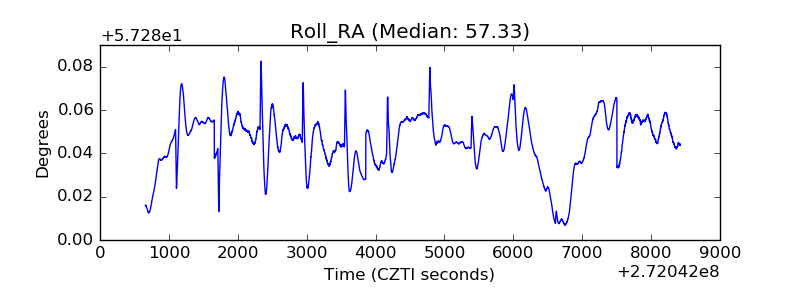 |
| Veto Counter | 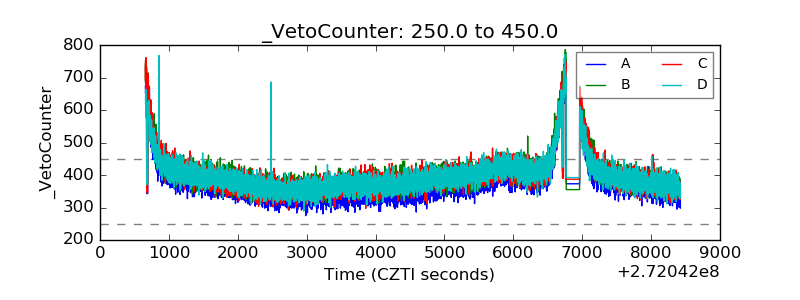 |