| Param | Original file | Final file |
|---|---|---|
| Filename | modeM0/AS1A04_198T01_9000002308_15580cztM0_level2.evt | modeM0/AS1A04_198T01_9000002308_15580cztM0_level2_quad_clean.evt |
| Size (bytes) | 590,126,400 | 87,958,080 |
| Size | 562.8 MB | 83.9 MB |
| Events in quadrant A | 3,768,077 | 541,587 |
| Events in quadrant B | 3,936,568 | 546,458 |
| Events in quadrant C | 3,835,239 | 525,172 |
| Events in quadrant D | 5,798,392 | 503,209 |
| Mode M0 | |||
|---|---|---|---|
| Quadrant | BADHDUFLAG | Total packets | Discarded packets |
| A | 0 | 16462 | 3 |
| B | 0 | 16804 | 2 |
| C | 0 | 16437 | 2 |
| D | 0 | 22473 | 2 |
| Mode SS | |||
|---|---|---|---|
| Quadrant | BADHDUFLAG | Total packets | Discarded packets |
| A | 0 | 160 | 0 |
| B | 0 | 160 | 0 |
| C | 0 | 160 | 0 |
| D | 0 | 160 | 0 |
| Mode M9 | |||
|---|---|---|---|
| Quadrant | BADHDUFLAG | Total packets | Discarded packets |
| A | 0 | 6 | 0 |
| B | 0 | 6 | 0 |
| C | 0 | 6 | 0 |
| D | 0 | 6 | 0 |
| Quadrant | Total seconds | Saturated seconds | Saturation percentage |
|---|---|---|---|
| A | 7873 | 186 | 2.362505% |
| B | 7873 | 207 | 2.629239% |
| C | 7873 | 187 | 2.375206% |
| D | 7873 | 595 | 7.557475% |
Noise dominated data is calculated using 1-second bins in cleaned event files. If a bin has >2000 counts, and if more than 50% of those come from <1% of pixels, then it is considered to be noise-dominated and hence unusable.
| Quadrant | # 1 sec bins | Bins with >0 counts | Bins with >2000 counts | High rate bins dominated by noise | Noise dominated (total time) | Noise dominated (detector-on time) | Marked lightcurve |
|---|---|---|---|---|---|---|---|
| A | 8469 | 7874 | 5 | 5 | 0.06% | 0.06% | 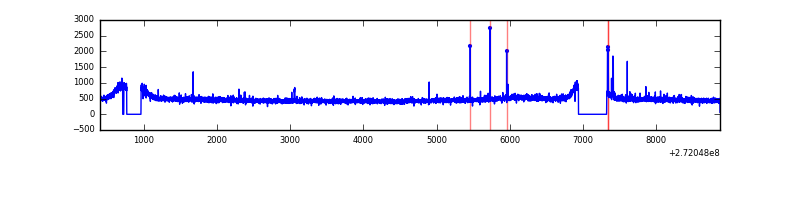 |
| B | 8469 | 7874 | 2 | 2 | 0.02% | 0.03% | 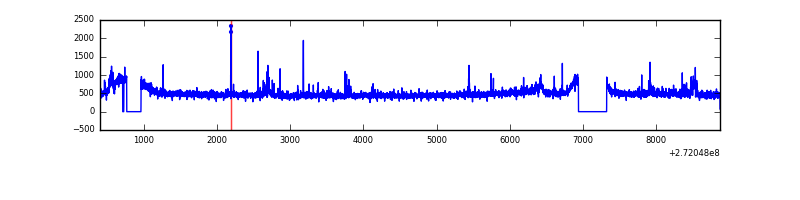 |
| C | 8469 | 7875 | 3 | 3 | 0.04% | 0.04% | 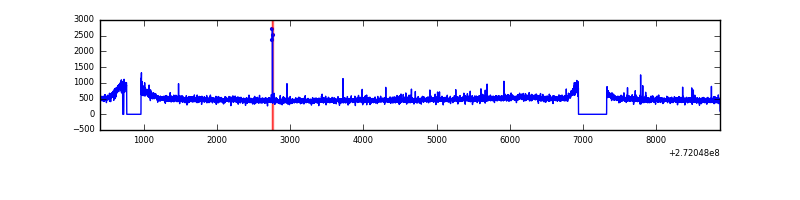 |
| D | 8469 | 7877 | 440 | 440 | 5.20% | 5.59% | 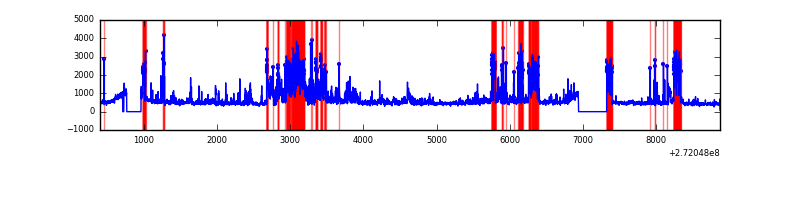 |
Top three noisy pixels from each quadrant. If the there are fewer than three noisy pixels in the level2.evt file, extra rows are filled as -1
| Pixel properties | Quadrant properties | ||||||
|---|---|---|---|---|---|---|---|
| Quadrant | DetID | PixID | Counts | Sigma | Mean | Median | Sigma |
| A | 9 | 143 | 32587 | 159.46 | 968 | 946 | 198.4 |
| A | 13 | 248 | 9124 | 41.21 | 968 | 946 | 198.4 |
| A | 0 | 226 | 8704 | 39.1 | 968 | 946 | 198.4 |
| B | 0 | 189 | 79655 | 422.04 | 962 | 934 | 186.5 |
| B | 12 | 111 | 21313 | 109.25 | 962 | 934 | 186.5 |
| B | 0 | 197 | 18898 | 96.31 | 962 | 934 | 186.5 |
| C | 14 | 238 | 140912 | 645.56 | 921 | 925 | 216.8 |
| C | 3 | 233 | 70698 | 321.77 | 921 | 925 | 216.8 |
| C | 10 | 22 | 14934 | 64.6 | 921 | 925 | 216.8 |
| D | 1 | 52 | 1975161 | 8768.16 | 919 | 890 | 225.2 |
| D | 12 | 110 | 102026 | 449.17 | 919 | 890 | 225.2 |
| D | 15 | 0 | 85280 | 374.79 | 919 | 890 | 225.2 |
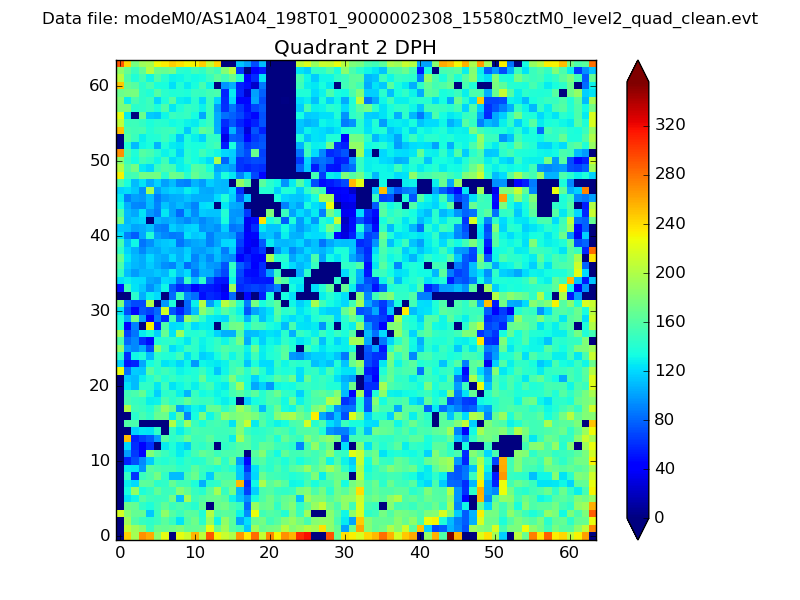
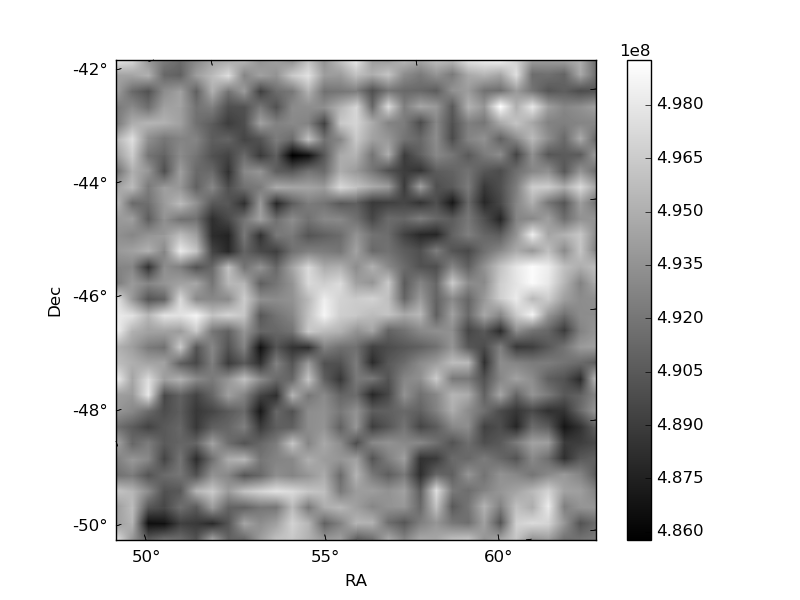
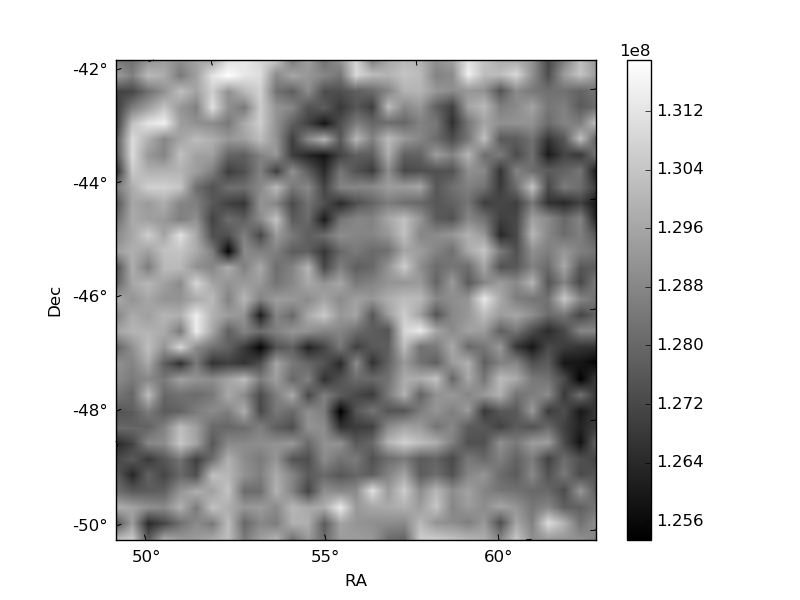
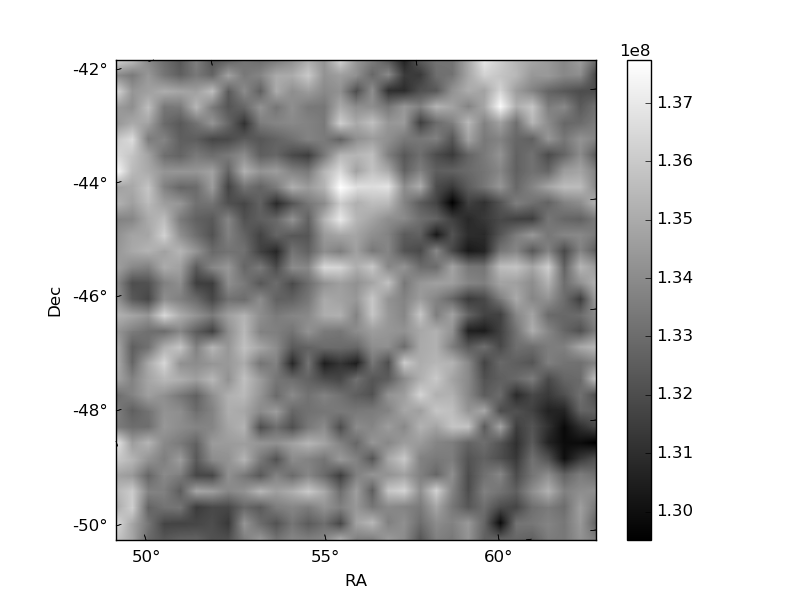
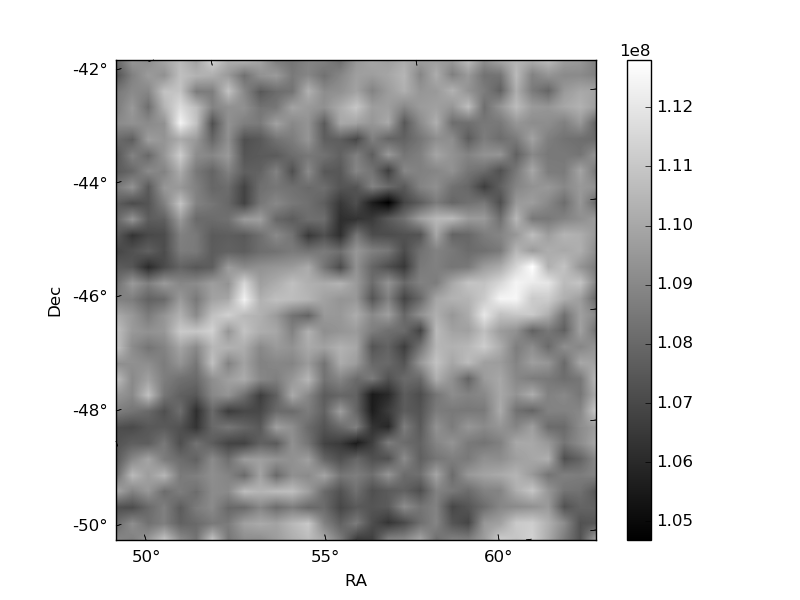
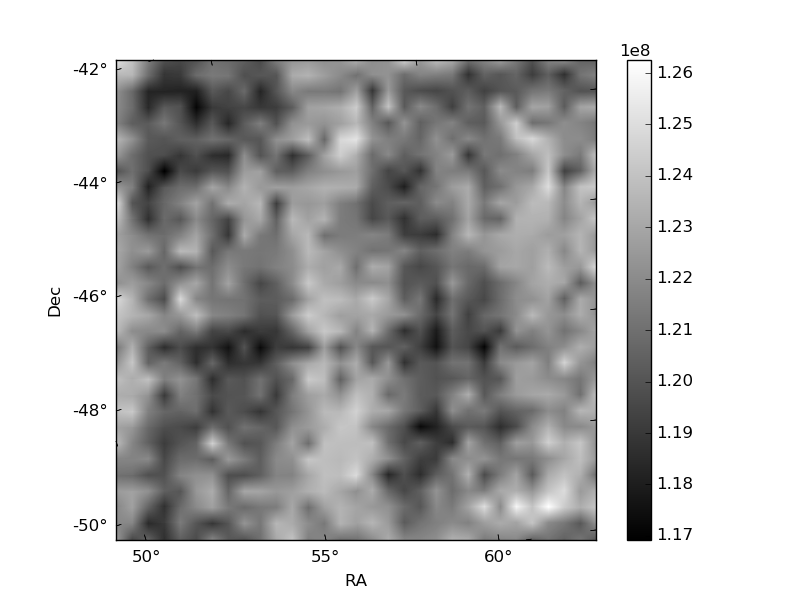
Histogram calculated using DETX and DETY for each event in the final _common_clean file
| Quadrant A | 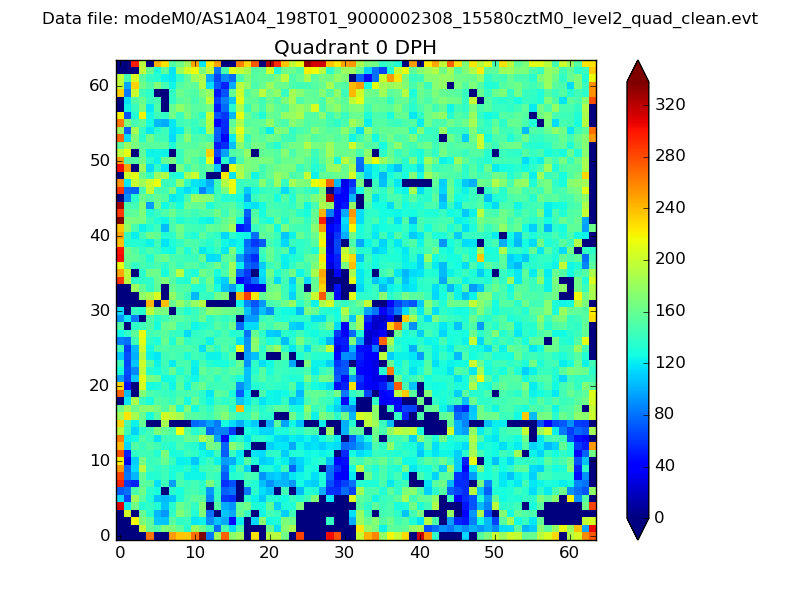 |
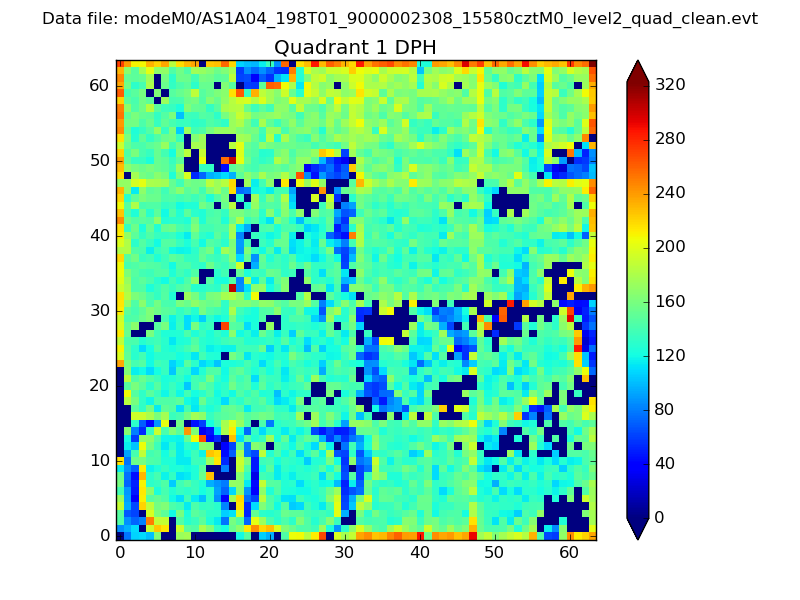 |
Quadrant B |
|---|---|---|---|
| Quadrant D | 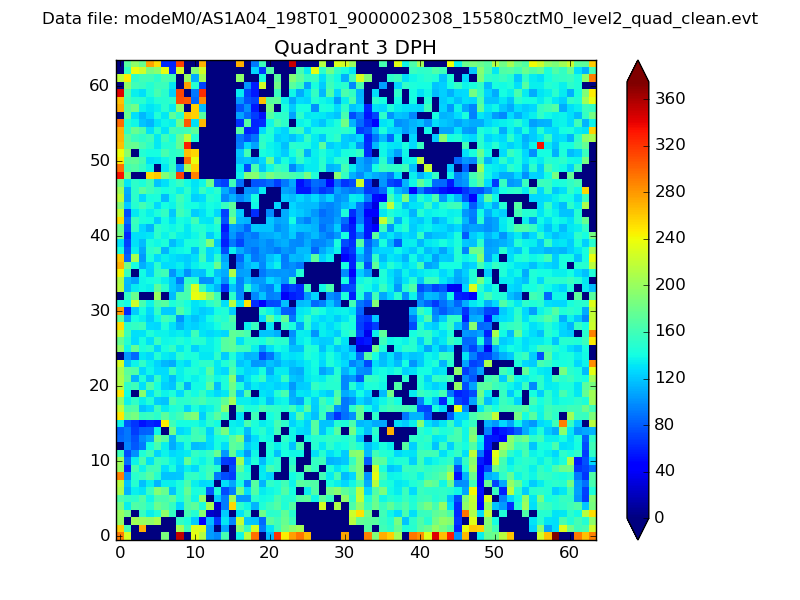 |
 |
Quadrant C |
| Plot type | Count rate plots | Images |
|---|---|---|
| Comparison with Poisson distribution Blue bars denote a histogram of data divided into 1 sec bins. Red curve is a Poisson curve with rate = median count rate of data. |
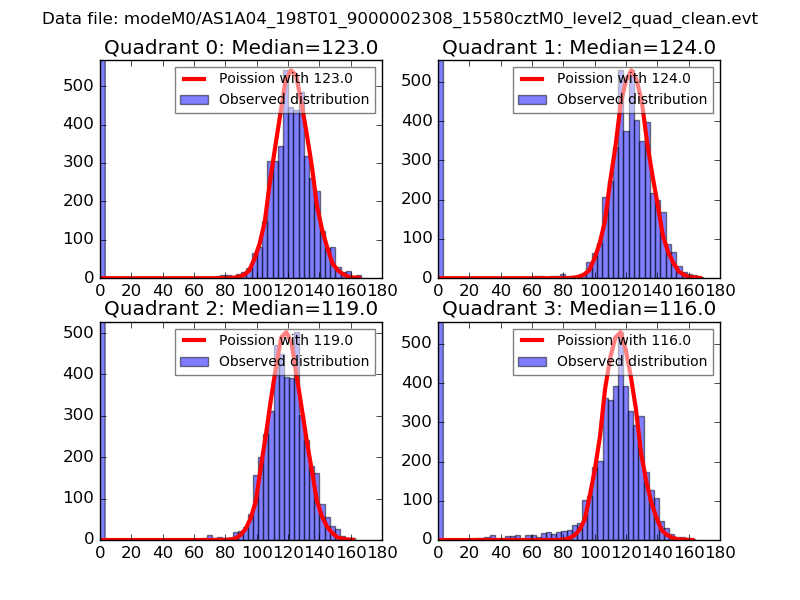 |
 |
| Quadrant-wise count rates Data is divided into 100 sec bins |
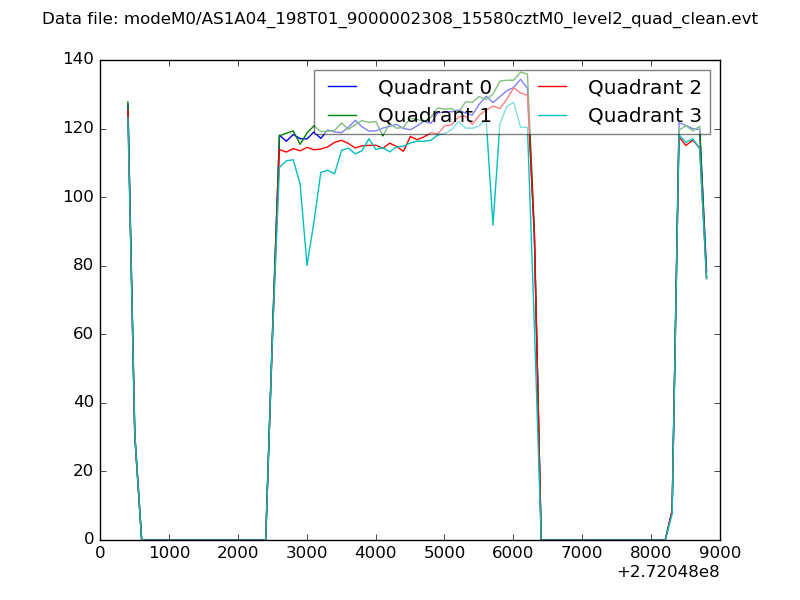 |
|
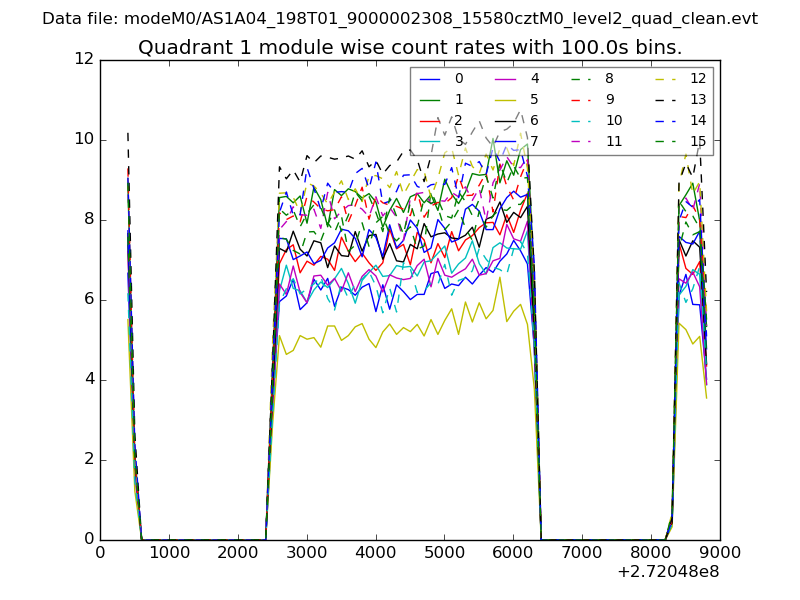
| Module-wise count rates for Quadrant A Data is divided into 100 sec bins |
 |
 |
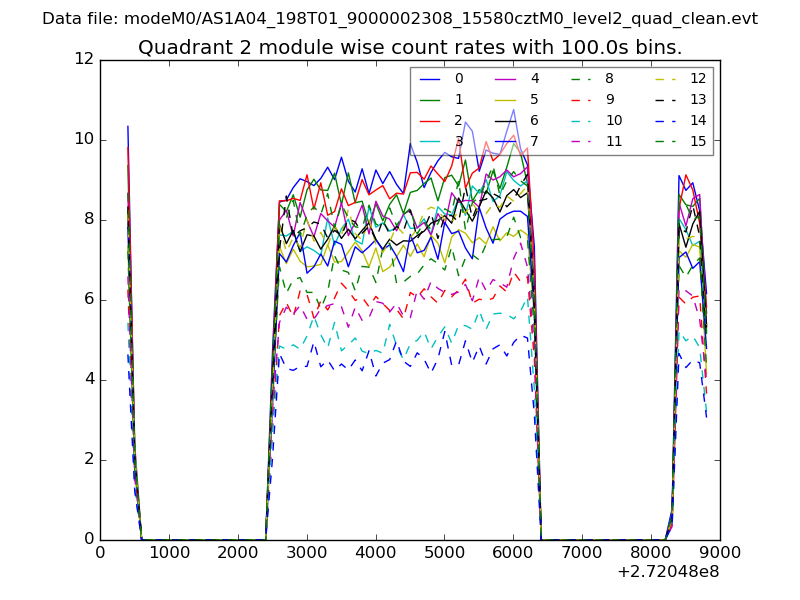
| Module-wise count rates for Quadrant B Data is divided into 100 sec bins |
 |
 |
| Module-wise count rates for Quadrant C Data is divided into 100 sec bins |
 |
 |
| Module-wise count rates for Quadrant D Data is divided into 100 sec bins |
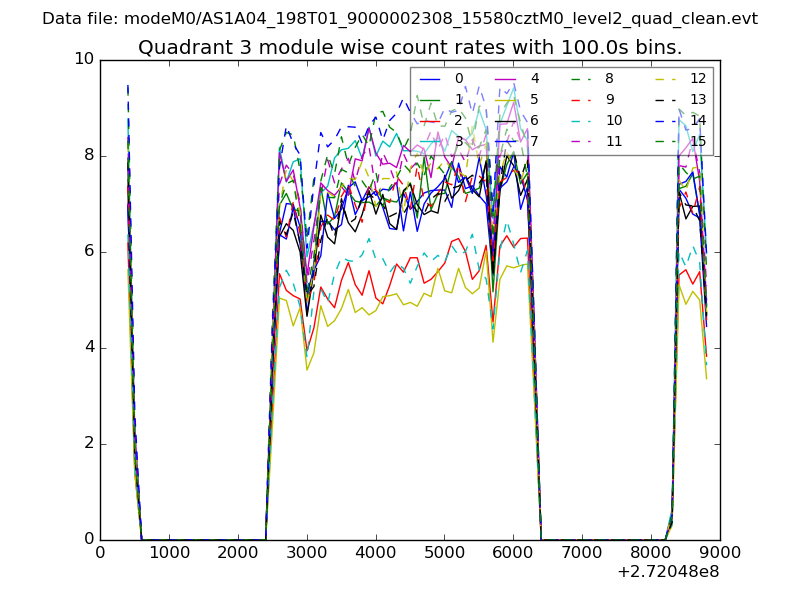 |
 |
| Parameter | Plot |
|---|---|
| CZT HV Monitor | 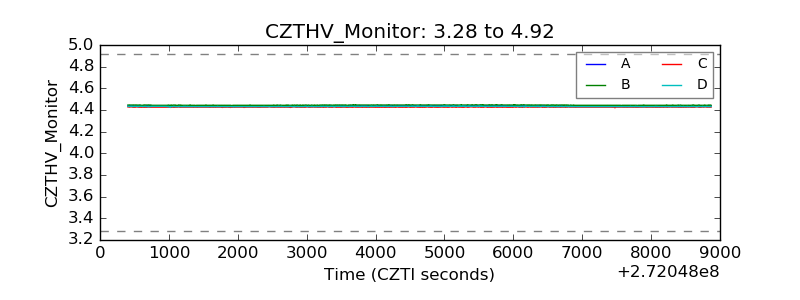 |
| D_VDD | 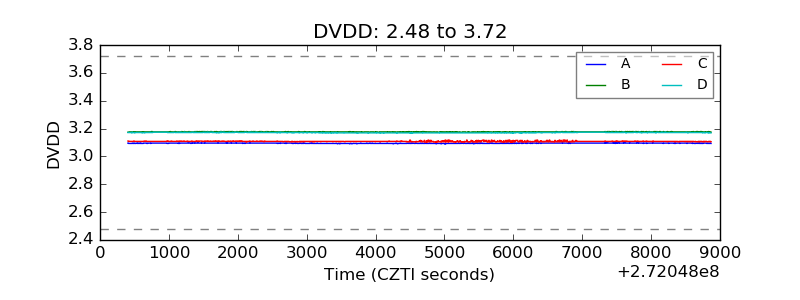 |
| Temperature 1 | 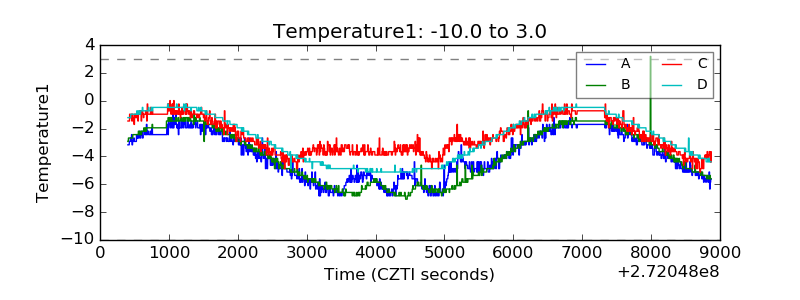 |
| Veto HV Monitor | 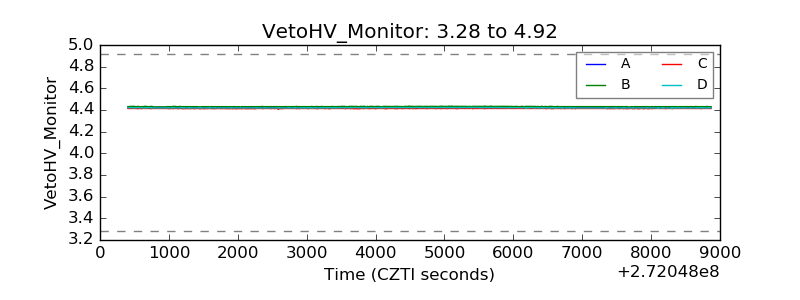 |
| Veto LLD | 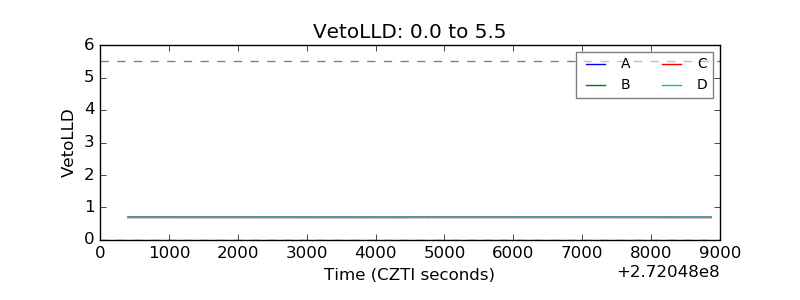 |
| Alpha Counter | 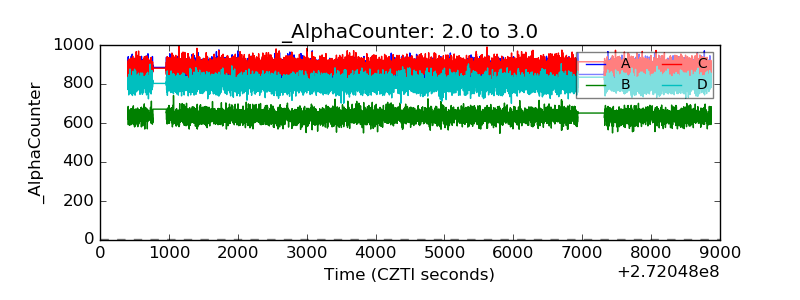 |
| _CPM_Rate | 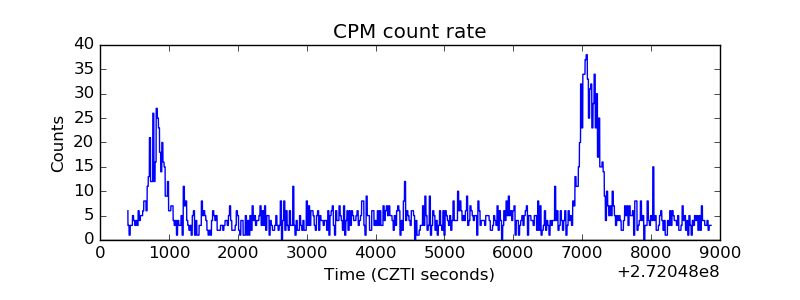 |
| CZT Counter | 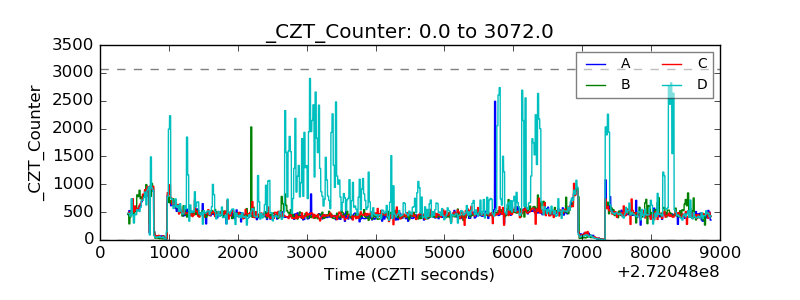 |
| +2.5 Volts monitor |  |
| +5 Volts monitor |  |
| _ROLL_ROT | 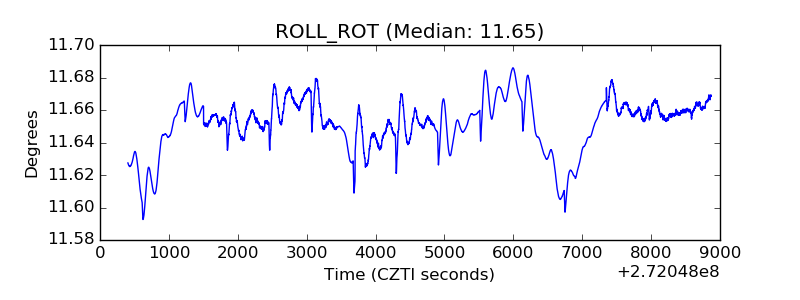 |
| _Roll_DEC | 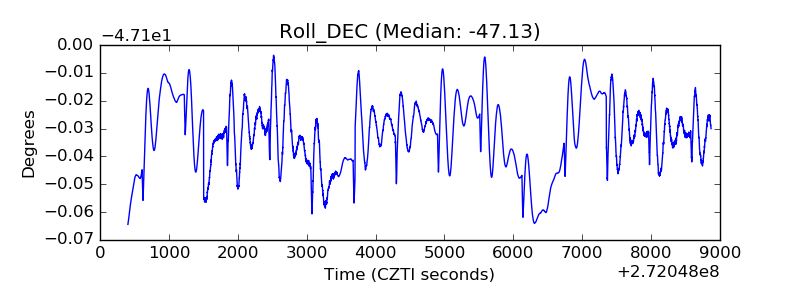 |
| _Roll_RA |  |
| Veto Counter | 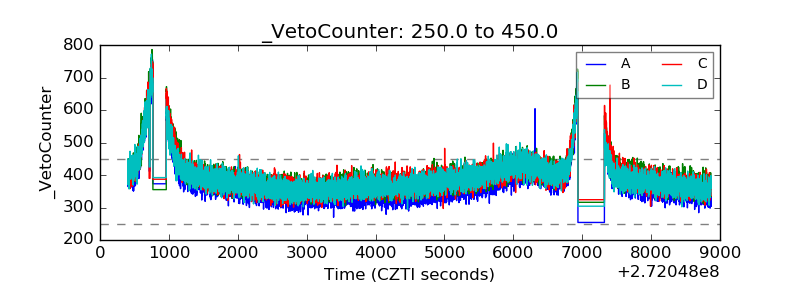 |