| Param | Original file | Final file |
|---|---|---|
| Filename | modeM0/AS1A04_198T01_9000002308_15582cztM0_level2.evt | modeM0/AS1A04_198T01_9000002308_15582cztM0_level2_quad_clean.evt |
| Size (bytes) | 273,536,640 | 62,421,120 |
| Size | 260.9 MB | 59.5 MB |
| Events in quadrant A | 1,837,623 | 402,488 |
| Events in quadrant B | 1,962,413 | 406,894 |
| Events in quadrant C | 1,912,589 | 393,304 |
| Events in quadrant D | 2,280,884 | 388,151 |
| Mode M0 | |||
|---|---|---|---|
| Quadrant | BADHDUFLAG | Total packets | Discarded packets |
| A | 0 | 8541 | 0 |
| B | 0 | 8763 | 0 |
| C | 0 | 8567 | 0 |
| D | 0 | 9831 | 0 |
| Mode SS | |||
|---|---|---|---|
| Quadrant | BADHDUFLAG | Total packets | Discarded packets |
| A | 0 | 84 | 0 |
| B | 0 | 84 | 0 |
| C | 0 | 84 | 0 |
| D | 0 | 84 | 0 |
| Quadrant | Total seconds | Saturated seconds | Saturation percentage |
|---|---|---|---|
| A | 4253 | 3 | 0.070538% |
| B | 4253 | 15 | 0.352692% |
| C | 4253 | 18 | 0.423231% |
| D | 4253 | 108 | 2.539384% |
Noise dominated data is calculated using 1-second bins in cleaned event files. If a bin has >2000 counts, and if more than 50% of those come from <1% of pixels, then it is considered to be noise-dominated and hence unusable.
| Quadrant | # 1 sec bins | Bins with >0 counts | Bins with >2000 counts | High rate bins dominated by noise | Noise dominated (total time) | Noise dominated (detector-on time) | Marked lightcurve |
|---|---|---|---|---|---|---|---|
| A | 4254 | 4254 | 0 | 0 | 0.00% | 0.00% | 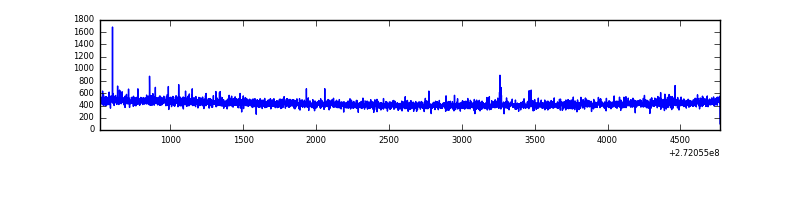 |
| B | 4254 | 4254 | 7 | 7 | 0.16% | 0.16% | 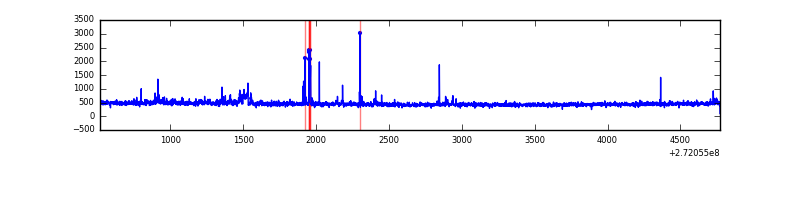 |
| C | 4254 | 4254 | 0 | 0 | 0.00% | 0.00% |  |
| D | 4254 | 4254 | 115 | 115 | 2.70% | 2.70% | 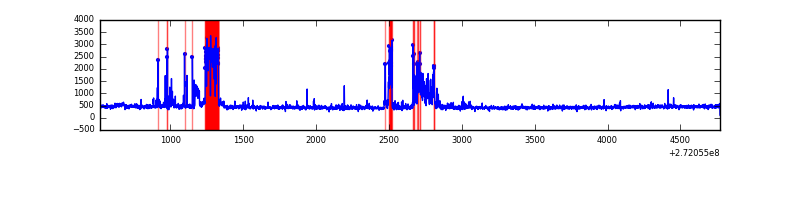 |
Top three noisy pixels from each quadrant. If the there are fewer than three noisy pixels in the level2.evt file, extra rows are filled as -1
| Pixel properties | Quadrant properties | ||||||
|---|---|---|---|---|---|---|---|
| Quadrant | DetID | PixID | Counts | Sigma | Mean | Median | Sigma |
| A | 9 | 143 | 5711 | 53.46 | 474 | 463 | 98.2 |
| A | 7 | 16 | 5522 | 51.53 | 474 | 463 | 98.2 |
| A | 0 | 226 | 4195 | 38.01 | 474 | 463 | 98.2 |
| B | 0 | 228 | 27667 | 291.48 | 478 | 464 | 93.3 |
| B | 0 | 189 | 25121 | 264.2 | 478 | 464 | 93.3 |
| B | 12 | 111 | 10641 | 109.05 | 478 | 464 | 93.3 |
| C | 14 | 238 | 70827 | 646.48 | 461 | 464 | 108.8 |
| C | 3 | 233 | 26668 | 240.76 | 461 | 464 | 108.8 |
| C | 0 | 207 | 17590 | 157.35 | 461 | 464 | 108.8 |
| D | 1 | 52 | 478544 | 4176.19 | 460 | 445 | 114.5 |
| D | 5 | 51 | 40947 | 353.78 | 460 | 445 | 114.5 |
| D | 2 | 234 | 20543 | 175.55 | 460 | 445 | 114.5 |
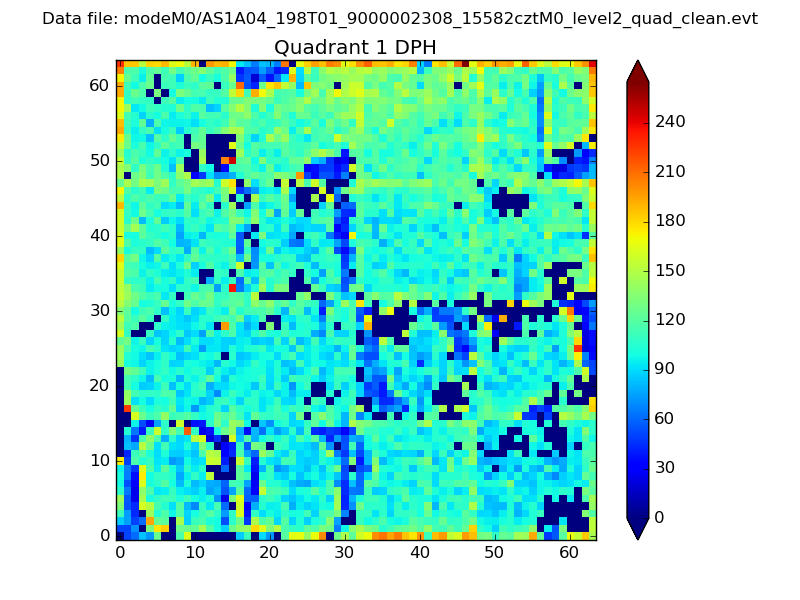
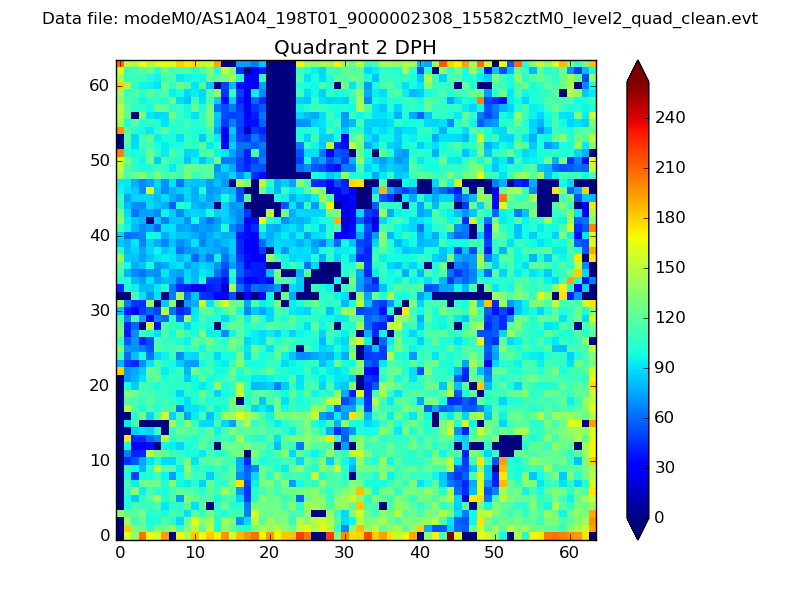
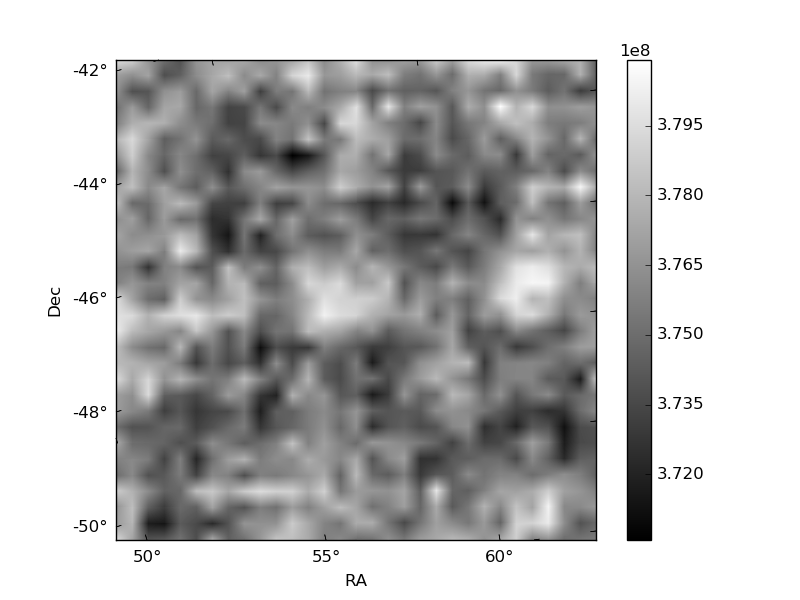
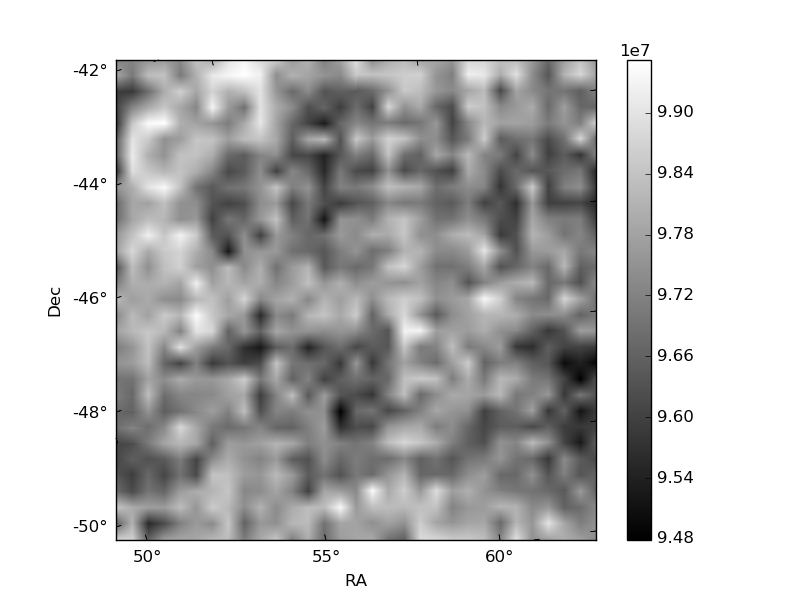
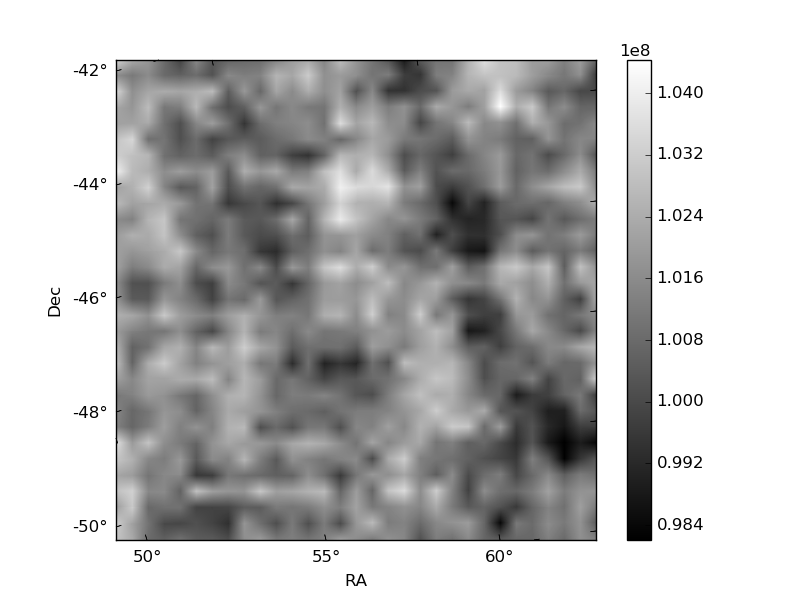
Histogram calculated using DETX and DETY for each event in the final _common_clean file
| Quadrant A | 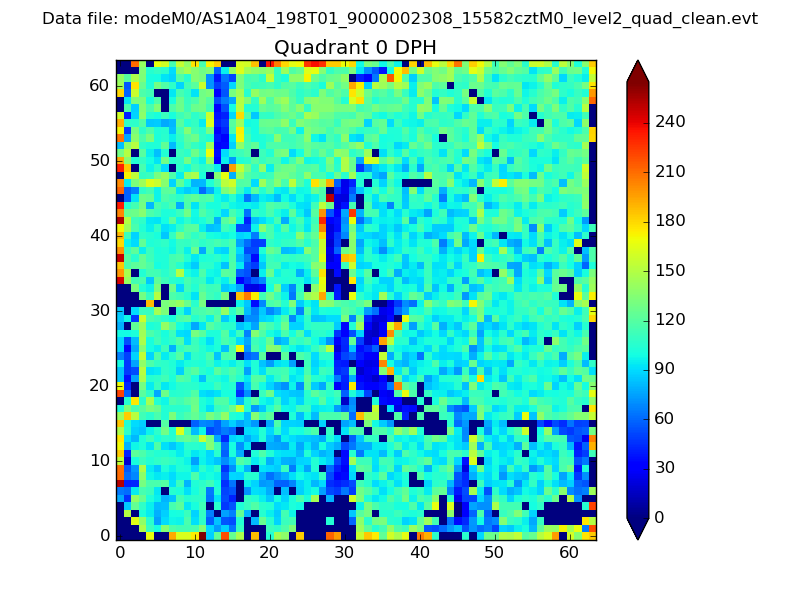 |
 |
Quadrant B |
|---|---|---|---|
| Quadrant D | 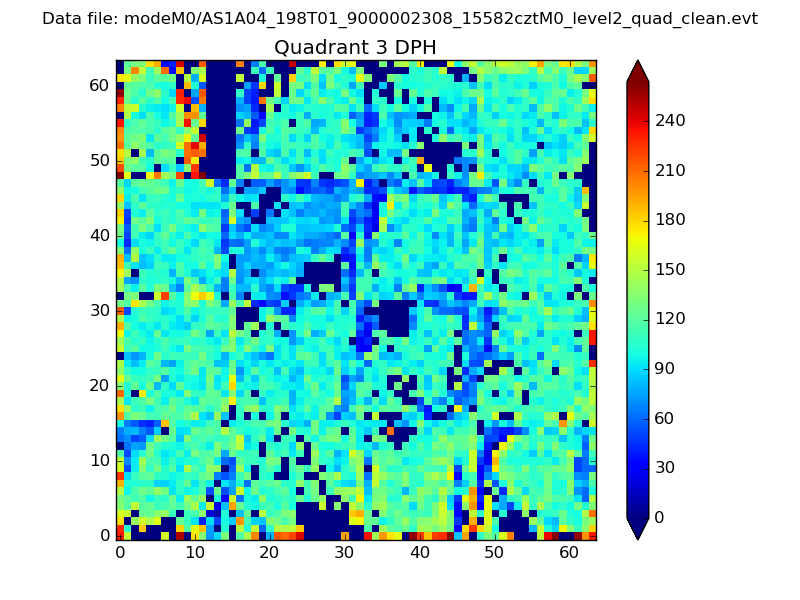 |
 |
Quadrant C |
| Plot type | Count rate plots | Images |
|---|---|---|
| Comparison with Poisson distribution Blue bars denote a histogram of data divided into 1 sec bins. Red curve is a Poisson curve with rate = median count rate of data. |
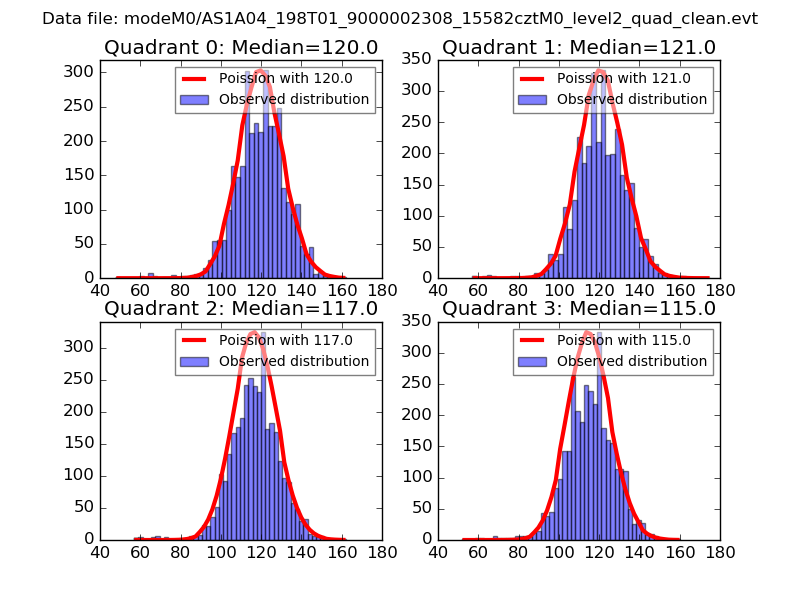 |
 |
| Quadrant-wise count rates Data is divided into 100 sec bins |
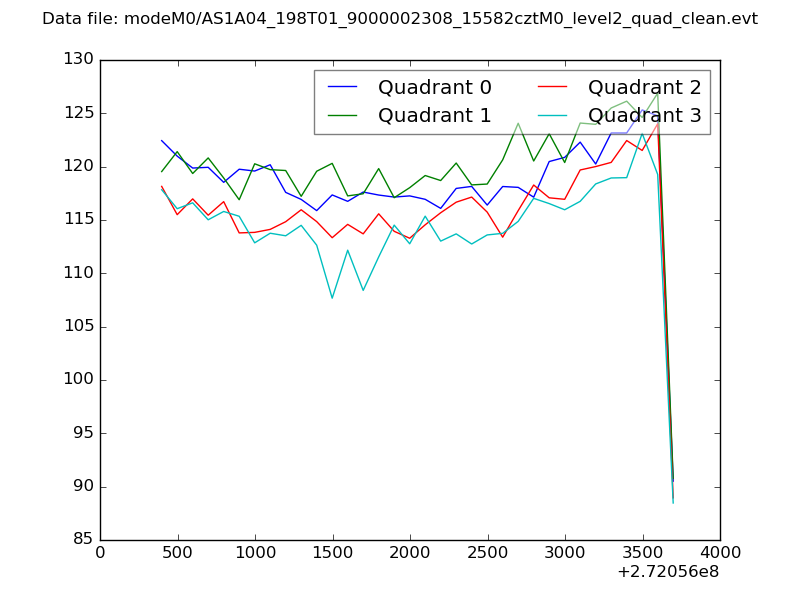 |
|
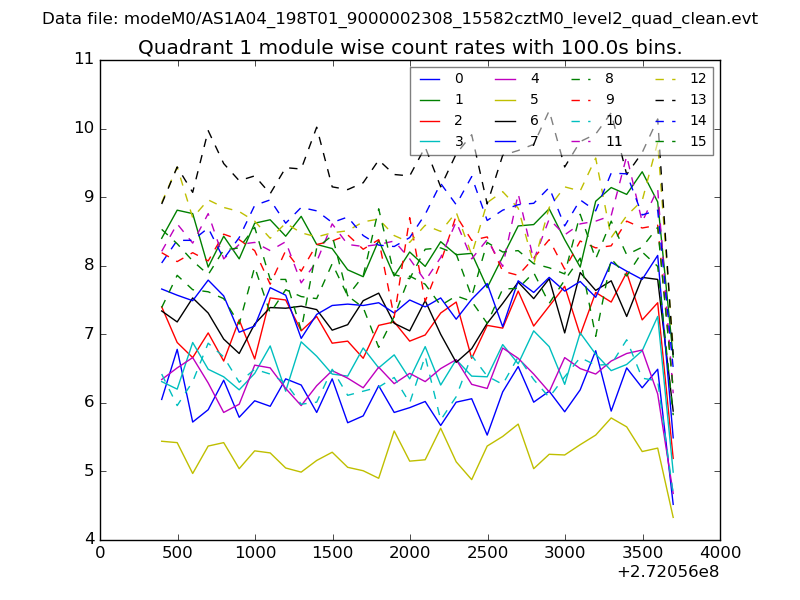
| Module-wise count rates for Quadrant A Data is divided into 100 sec bins |
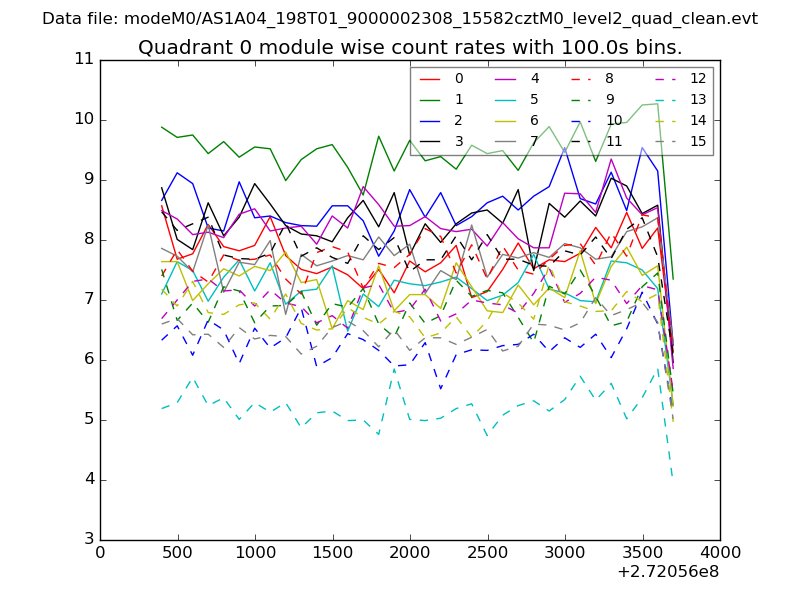 |
 |
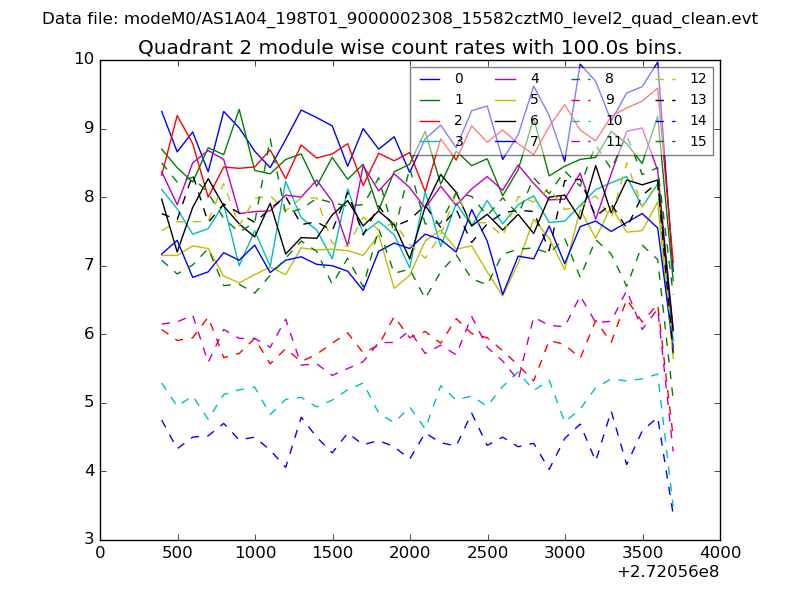
| Module-wise count rates for Quadrant B Data is divided into 100 sec bins |
 |
 |
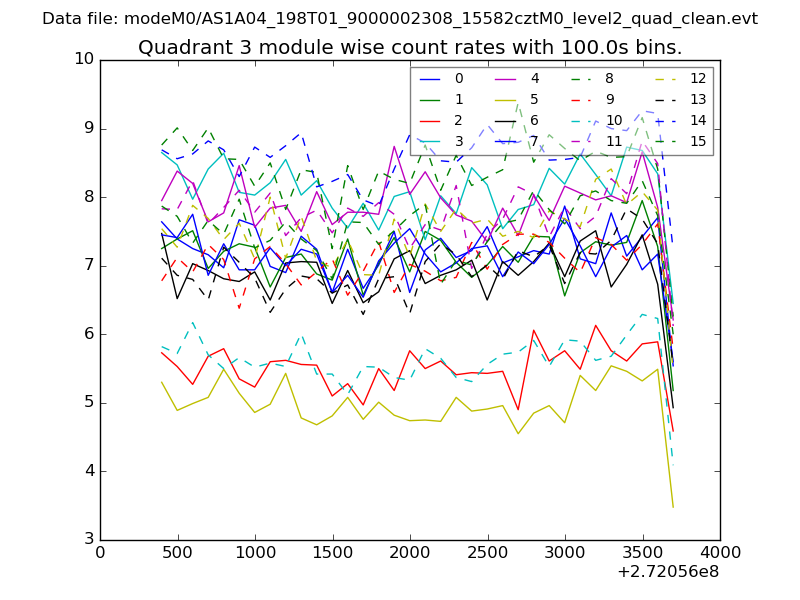
| Module-wise count rates for Quadrant C Data is divided into 100 sec bins |
 |
 |
| Module-wise count rates for Quadrant D Data is divided into 100 sec bins |
 |
 |
| Parameter | Plot |
|---|---|
| CZT HV Monitor | 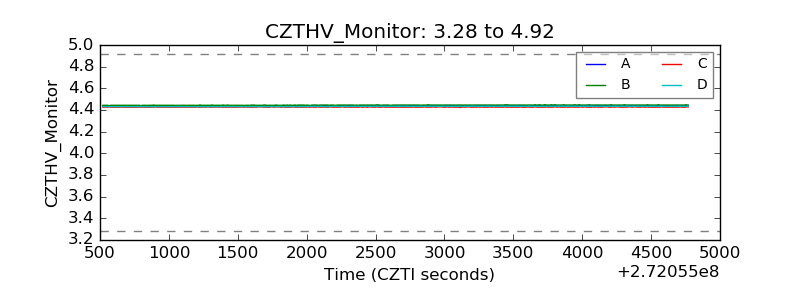 |
| D_VDD | 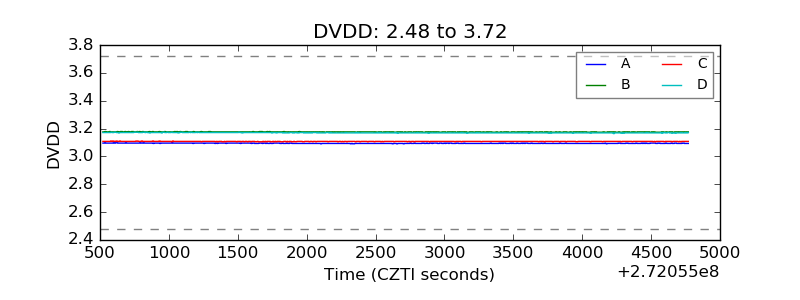 |
| Temperature 1 | 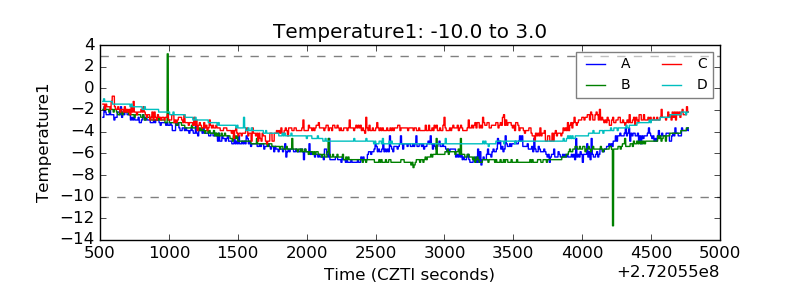 |
| Veto HV Monitor | 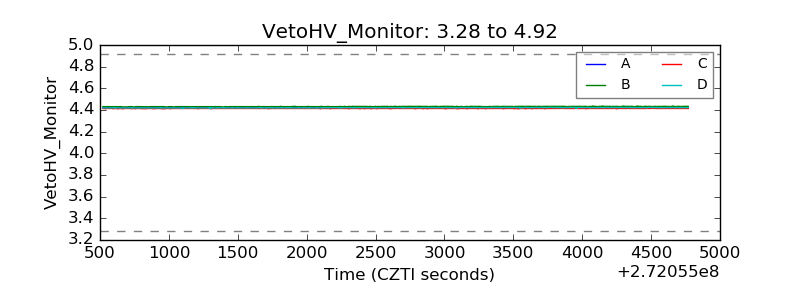 |
| Veto LLD | 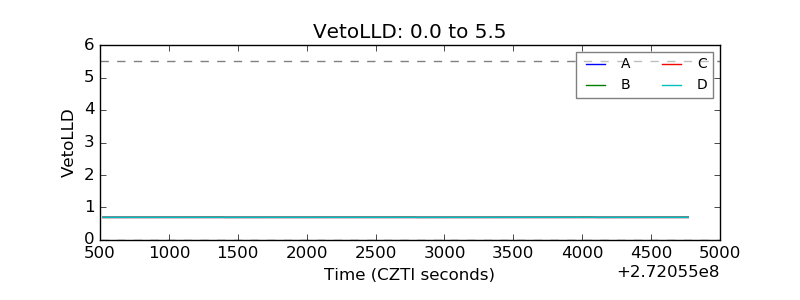 |
| Alpha Counter | 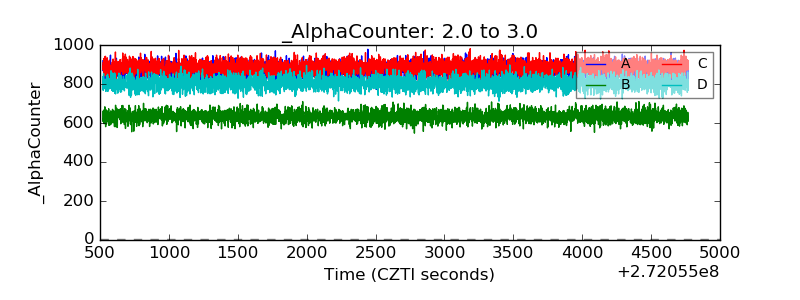 |
| _CPM_Rate | 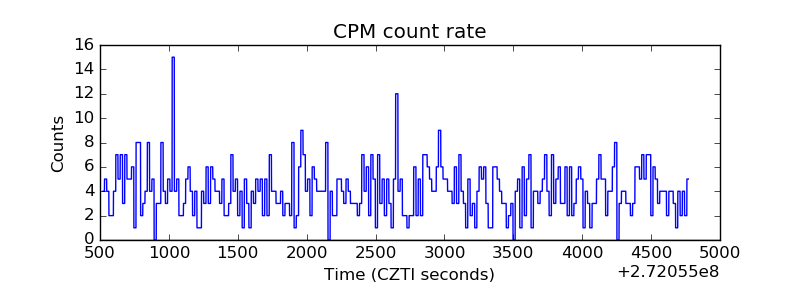 |
| CZT Counter | 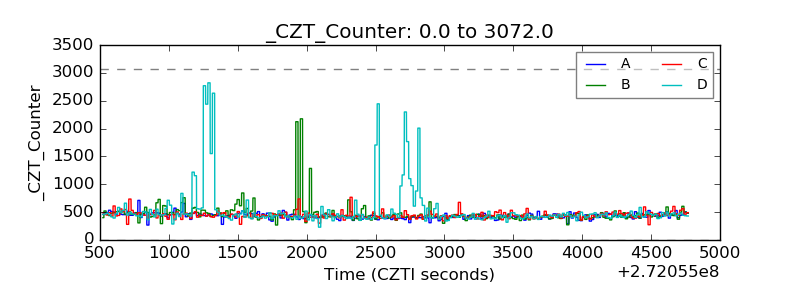 |
| +2.5 Volts monitor |  |
| +5 Volts monitor | 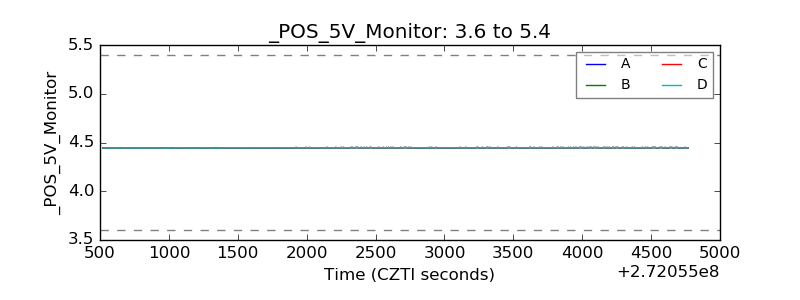 |
| _ROLL_ROT | 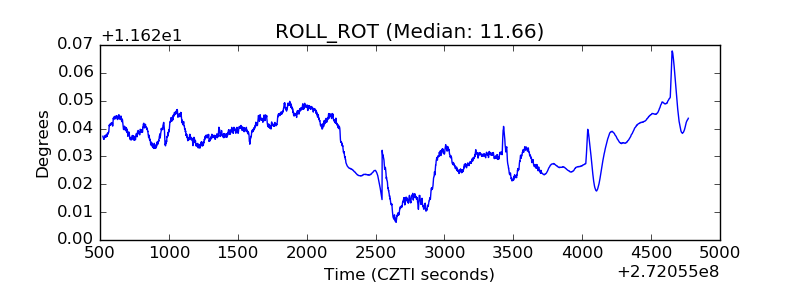 |
| _Roll_DEC | 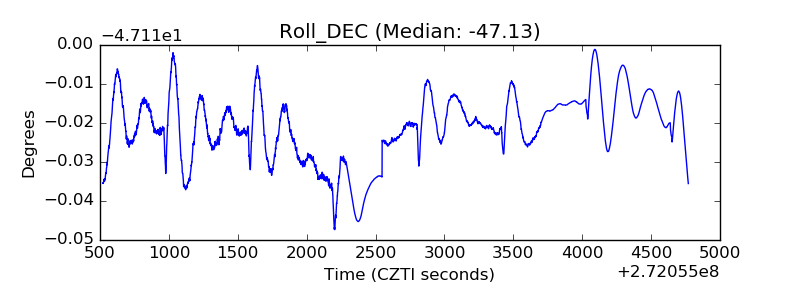 |
| _Roll_RA | 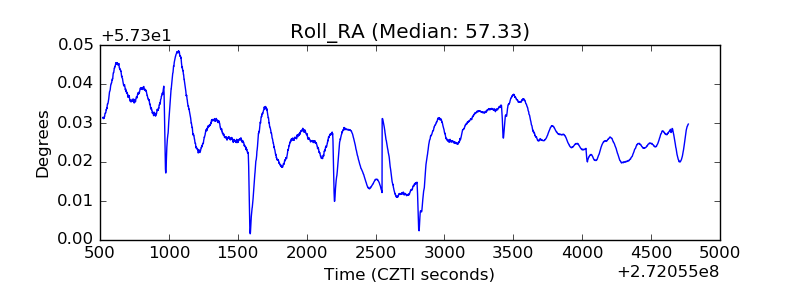 |
| Veto Counter | 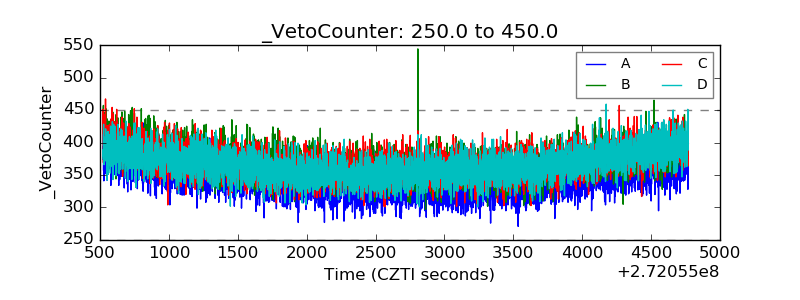 |