| Param | Original file | Final file |
|---|---|---|
| Filename | modeM0/AS1G08_028T01_9000002306cztM0_level2.fits | modeM0/AS1G08_028T01_9000002306cztM0_level2_quad_clean.evt |
| Size (bytes) | 271,370,880 | 279,429,120 |
| Size | 258.8 MB | 266.5 MB |
| Events in quadrant A | 1,681,050 | 1,746,856 |
| Events in quadrant B | 1,607,150 | 1,735,807 |
| Events in quadrant C | 1,606,706 | 1,607,848 |
| Events in quadrant D | 1,422,494 | 1,471,652 |
| Mode M9 | |||
|---|---|---|---|
| Quadrant | BADHDUFLAG | Total packets | Discarded packets |
| A | 0 | 31 | 0 |
| B | 0 | 31 | 0 |
| C | 0 | 31 | 0 |
| D | 0 | 31 | 0 |
| Mode M0 | |||
|---|---|---|---|
| Quadrant | BADHDUFLAG | Total packets | Discarded packets |
| A | 0 | 58053 | 0 |
| B | 0 | 60348 | 0 |
| C | 0 | 64094 | 0 |
| D | 0 | 68843 | 0 |
| Mode SS | |||
|---|---|---|---|
| Quadrant | BADHDUFLAG | Total packets | Discarded packets |
| A | 0 | 566 | 0 |
| B | 0 | 566 | 0 |
| C | 0 | 566 | 0 |
| D | 0 | 566 | 0 |
| Quadrant | Total seconds | Saturated seconds | Saturation percentage |
|---|---|---|---|
| A | 27627 | 578 | 2.092156% |
| B | 27627 | 766 | 2.772650% |
| C | 27627 | 1571 | 5.686466% |
| D | 27627 | 1213 | 4.390632% |
Noise dominated data is calculated using 1-second bins in cleaned event files. If a bin has >2000 counts, and if more than 50% of those come from <1% of pixels, then it is considered to be noise-dominated and hence unusable.
| Quadrant | # 1 sec bins | Bins with >0 counts | Bins with >2000 counts | High rate bins dominated by noise | Noise dominated (total time) | Noise dominated (detector-on time) | Marked lightcurve |
|---|---|---|---|---|---|---|---|
| A | 30742 | 27624 | 0 | 0 | 0.00% | 0.00% |  |
| B | 30742 | 27622 | 0 | 0 | 0.00% | 0.00% |  |
| C | 30742 | 27625 | 0 | 0 | 0.00% | 0.00% |  |
| D | 30741 | 27622 | 0 | 0 | 0.00% | 0.00% |  |
Top three noisy pixels from each quadrant. If the there are fewer than three noisy pixels in the level2.evt file, extra rows are filled as -1
| Pixel properties | Quadrant properties | ||||||
|---|---|---|---|---|---|---|---|
| Quadrant | DetID | PixID | Counts | Sigma | Mean | Median | Sigma |
| A | 0 | 29 | 1599 | 11.01 | 437 | 410 | 108.0 |
| A | 7 | 110 | 1334 | 8.55 | 437 | 410 | 108.0 |
| A | 15 | 236 | 1293 | 8.17 | 437 | 410 | 108.0 |
| B | 2 | 9 | 1271 | 9.96 | 424 | 404 | 87.1 |
| B | 2 | 8 | 1100 | 7.99 | 424 | 404 | 87.1 |
| B | 5 | 232 | 1082 | 7.79 | 424 | 404 | 87.1 |
| C | 2 | 191 | 1081 | 6.16 | 425 | 396 | 111.1 |
| C | 12 | 241 | 1054 | 5.92 | 425 | 396 | 111.1 |
| C | 9 | 233 | 1049 | 5.87 | 425 | 396 | 111.1 |
| D | 3 | 14 | 1019 | 5.94 | 406 | 370 | 109.2 |
| D | 10 | 189 | 992 | 5.7 | 406 | 370 | 109.2 |
| D | 7 | 3 | 989 | 5.67 | 406 | 370 | 109.2 |
Histogram calculated using DETX and DETY for each event in the final _common_clean file
| Quadrant A | 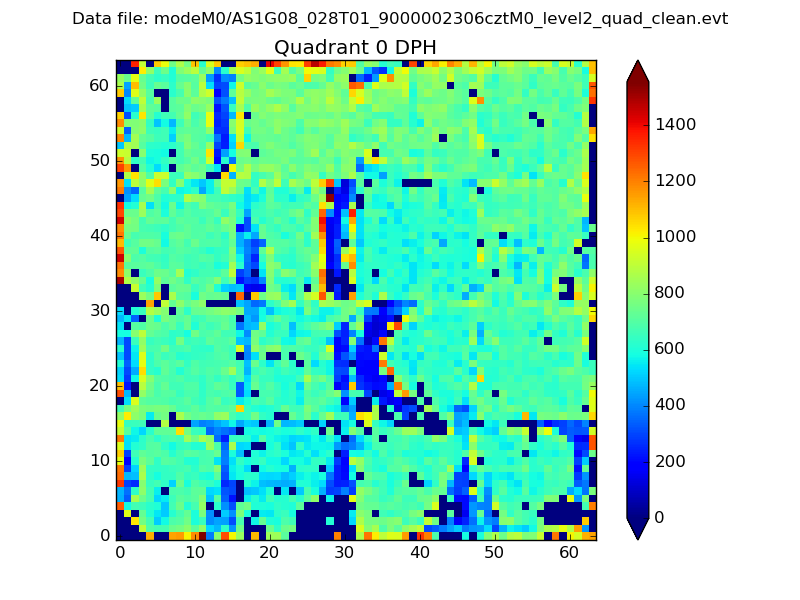 |
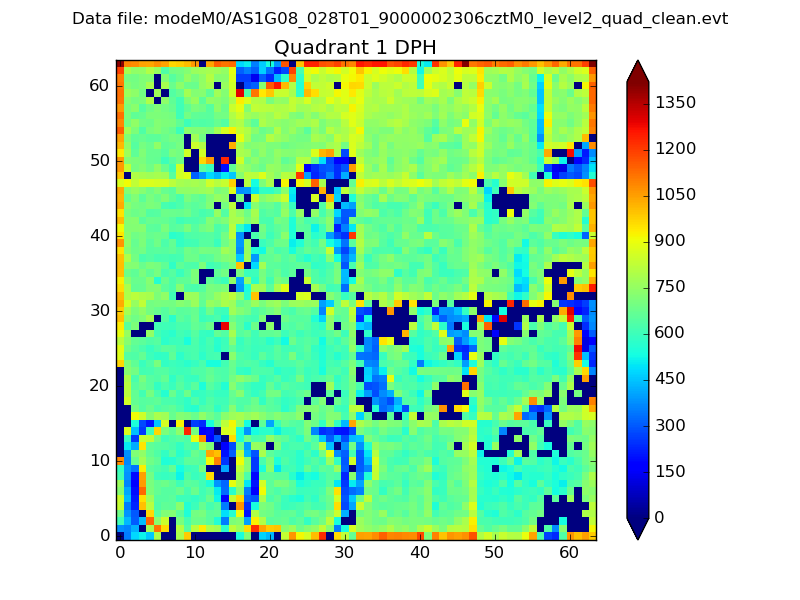 |
Quadrant B |
|---|---|---|---|
| Quadrant D | 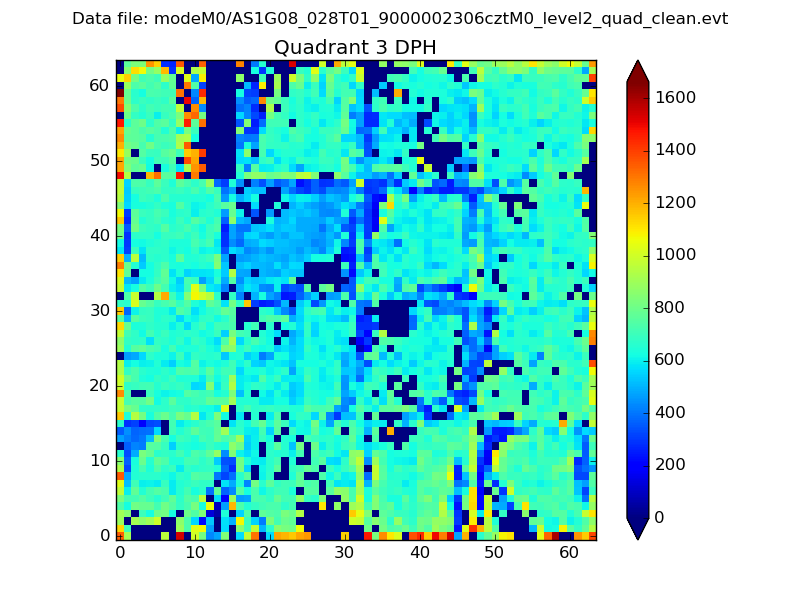 |
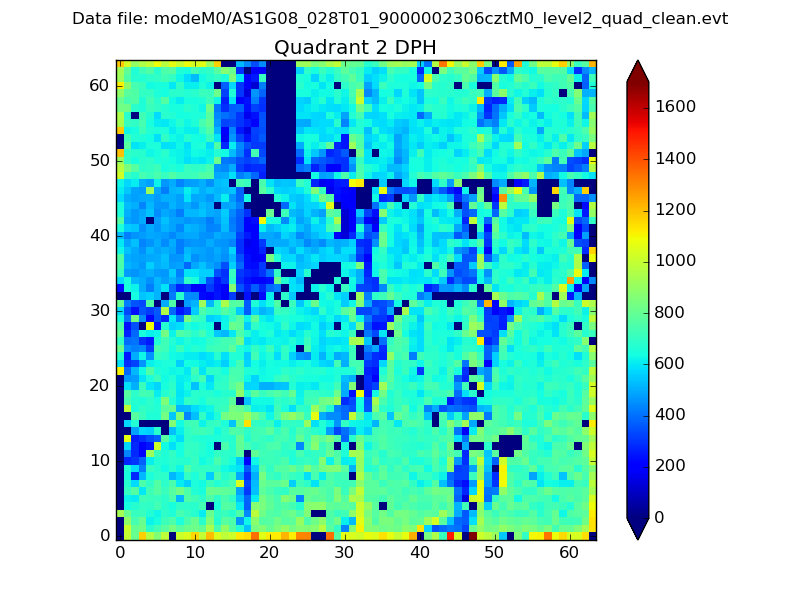 |
Quadrant C |
| Plot type | Count rate plots | Images |
|---|---|---|
| Comparison with Poisson distribution Blue bars denote a histogram of data divided into 1 sec bins. Red curve is a Poisson curve with rate = median count rate of data. |
 |
 |
| Quadrant-wise count rates Data is divided into 100 sec bins |
 |
|
| Module-wise count rates for Quadrant A Data is divided into 100 sec bins |
 |
 |
| Module-wise count rates for Quadrant B Data is divided into 100 sec bins |
 |
 |
| Module-wise count rates for Quadrant C Data is divided into 100 sec bins |
 |
 |
| Module-wise count rates for Quadrant D Data is divided into 100 sec bins |
 |
 |
| Parameter | Plot |
|---|---|
| CZT HV Monitor |  |
| D_VDD |  |
| Temperature 1 |  |
| Veto HV Monitor |  |
| Veto LLD |  |
| Alpha Counter |  |
| _CPM_Rate |  |
| CZT Counter |  |
| +2.5 Volts monitor |  |
| +5 Volts monitor |  |
| _ROLL_ROT |  |
| _Roll_DEC |  |
| _Roll_RA |  |
| Veto Counter |  |