| Param | Original file | Final file |
|---|---|---|
| Filename | modeM0/AS1G08_028T01_9000002306_15561cztM0_level2.evt | modeM0/AS1G08_028T01_9000002306_15561cztM0_level2_quad_clean.evt |
| Size (bytes) | 296,559,360 | 62,415,360 |
| Size | 282.8 MB | 59.5 MB |
| Events in quadrant A | 2,037,998 | 413,913 |
| Events in quadrant B | 2,128,163 | 415,949 |
| Events in quadrant C | 2,054,799 | 399,856 |
| Events in quadrant D | 2,499,076 | 389,804 |
| Mode M9 | |||
|---|---|---|---|
| Quadrant | BADHDUFLAG | Total packets | Discarded packets |
| A | 0 | 12 | 0 |
| B | 0 | 12 | 0 |
| C | 0 | 12 | 0 |
| D | 0 | 12 | 0 |
| Mode M0 | |||
|---|---|---|---|
| Quadrant | BADHDUFLAG | Total packets | Discarded packets |
| A | 0 | 8263 | 2 |
| B | 0 | 8531 | 1 |
| C | 0 | 8256 | 1 |
| D | 0 | 9779 | 1 |
| Mode SS | |||
|---|---|---|---|
| Quadrant | BADHDUFLAG | Total packets | Discarded packets |
| A | 0 | 80 | 0 |
| B | 0 | 80 | 0 |
| C | 0 | 80 | 0 |
| D | 0 | 80 | 0 |
| Quadrant | Total seconds | Saturated seconds | Saturation percentage |
|---|---|---|---|
| A | 3822 | 104 | 2.721088% |
| B | 3822 | 113 | 2.956567% |
| C | 3822 | 122 | 3.192046% |
| D | 3822 | 135 | 3.532182% |
Noise dominated data is calculated using 1-second bins in cleaned event files. If a bin has >2000 counts, and if more than 50% of those come from <1% of pixels, then it is considered to be noise-dominated and hence unusable.
| Quadrant | # 1 sec bins | Bins with >0 counts | Bins with >2000 counts | High rate bins dominated by noise | Noise dominated (total time) | Noise dominated (detector-on time) | Marked lightcurve |
|---|---|---|---|---|---|---|---|
| A | 5088 | 3823 | 1 | 1 | 0.02% | 0.03% | 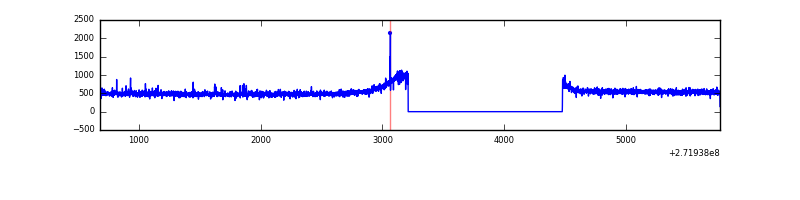 |
| B | 5088 | 3823 | 1 | 1 | 0.02% | 0.03% | 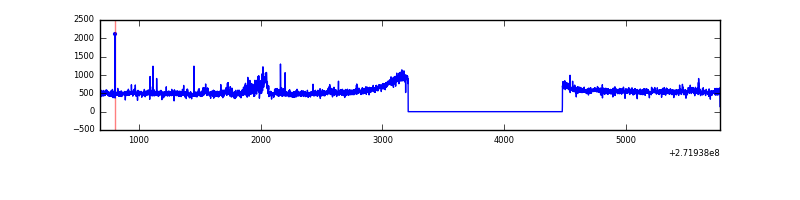 |
| C | 5088 | 3823 | 0 | 0 | 0.00% | 0.00% | 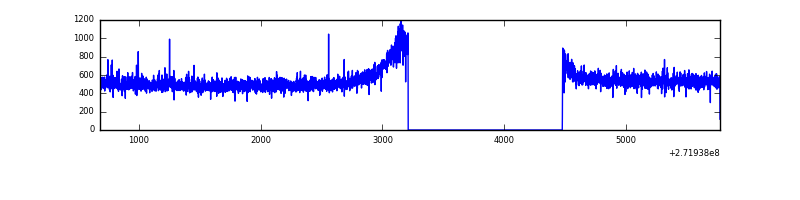 |
| D | 5088 | 3823 | 40 | 40 | 0.79% | 1.05% | 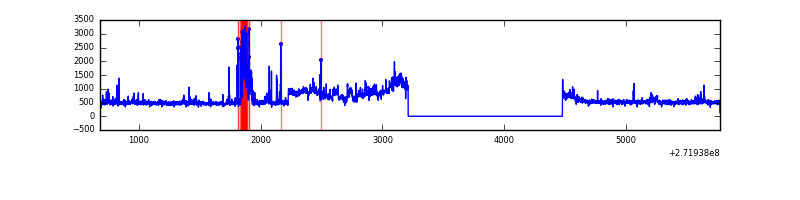 |
Top three noisy pixels from each quadrant. If the there are fewer than three noisy pixels in the level2.evt file, extra rows are filled as -1
| Pixel properties | Quadrant properties | ||||||
|---|---|---|---|---|---|---|---|
| Quadrant | DetID | PixID | Counts | Sigma | Mean | Median | Sigma |
| A | 13 | 248 | 4794 | 40.01 | 526 | 516 | 106.9 |
| A | 0 | 226 | 4644 | 38.6 | 526 | 516 | 106.9 |
| A | 7 | 16 | 4520 | 37.44 | 526 | 516 | 106.9 |
| B | 4 | 216 | 39952 | 394.91 | 518 | 506 | 99.9 |
| B | 0 | 189 | 13553 | 130.62 | 518 | 506 | 99.9 |
| B | 12 | 111 | 11285 | 107.91 | 518 | 506 | 99.9 |
| C | 14 | 238 | 76176 | 639.84 | 499 | 505 | 118.3 |
| C | 3 | 233 | 21515 | 177.65 | 499 | 505 | 118.3 |
| C | 0 | 207 | 7217 | 56.75 | 499 | 505 | 118.3 |
| D | 12 | 221 | 302008 | 2299.51 | 508 | 496 | 131.1 |
| D | 13 | 172 | 131165 | 996.56 | 508 | 496 | 131.1 |
| D | 5 | 222 | 39719 | 299.14 | 508 | 496 | 131.1 |
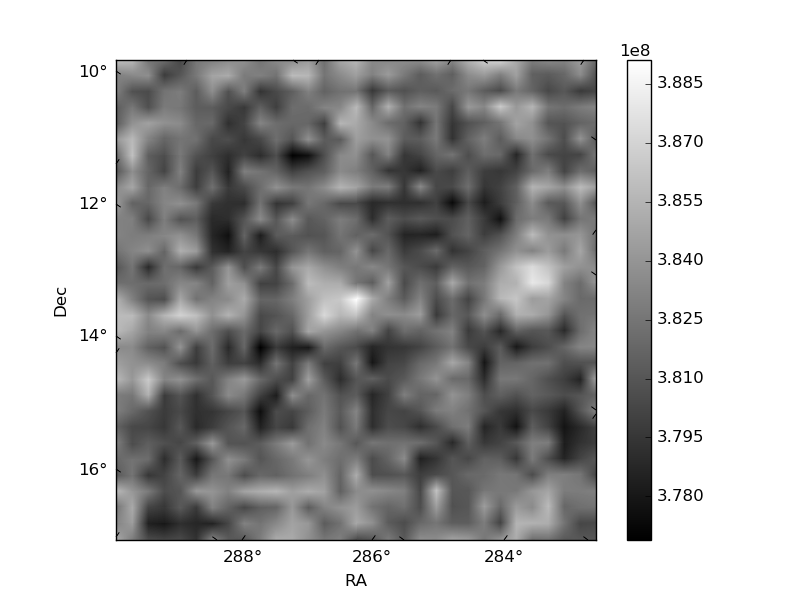
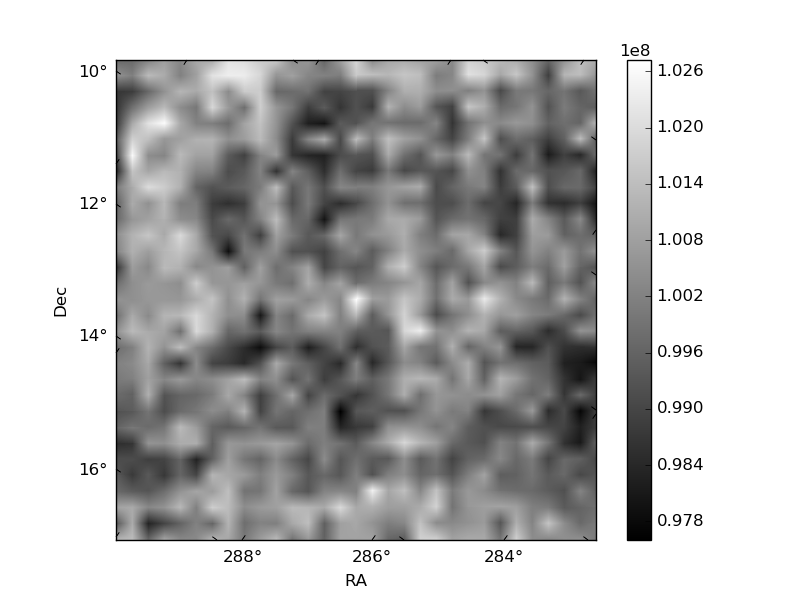
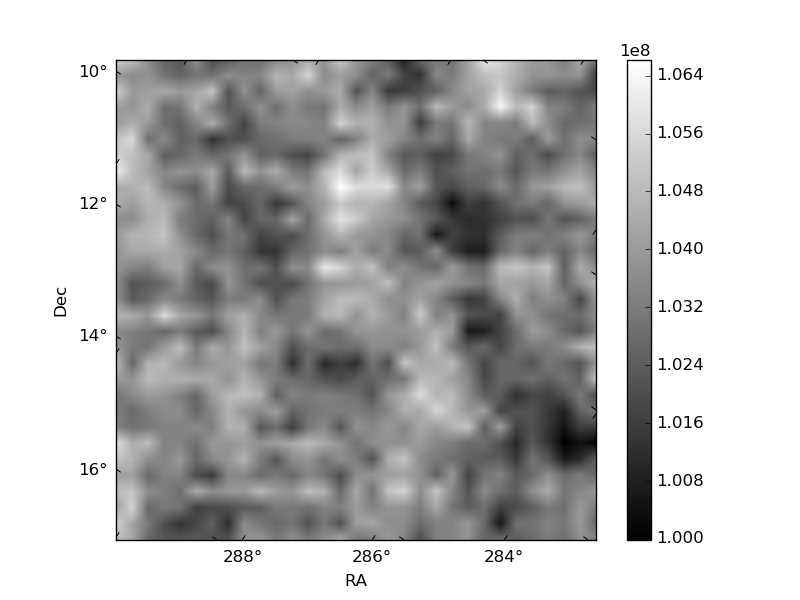
Histogram calculated using DETX and DETY for each event in the final _common_clean file
| Quadrant A | 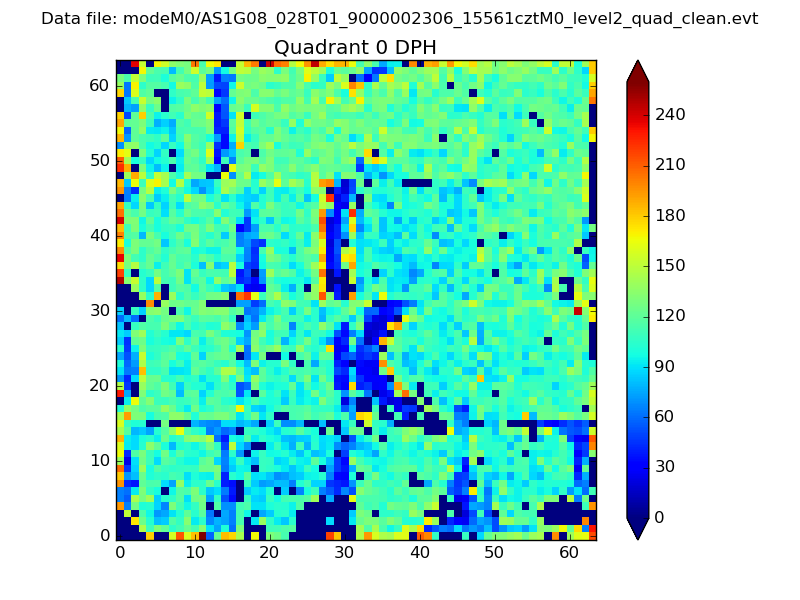 |
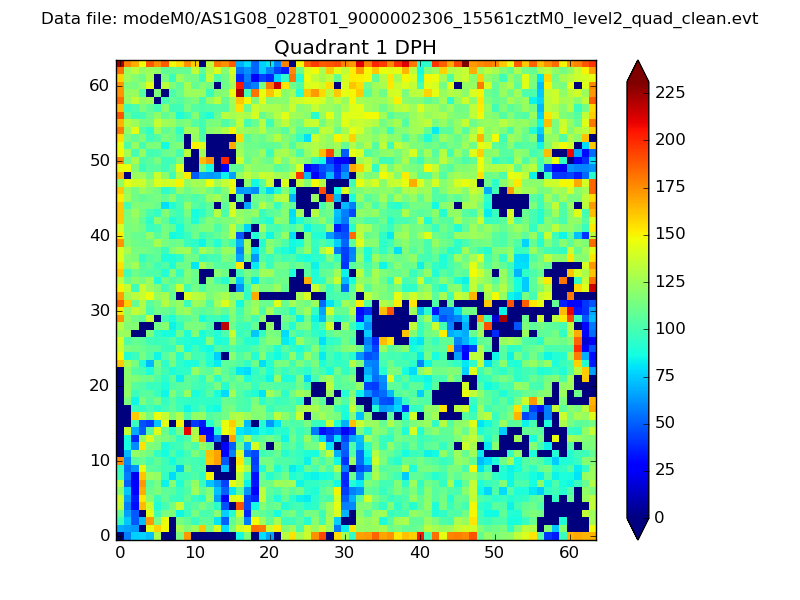 |
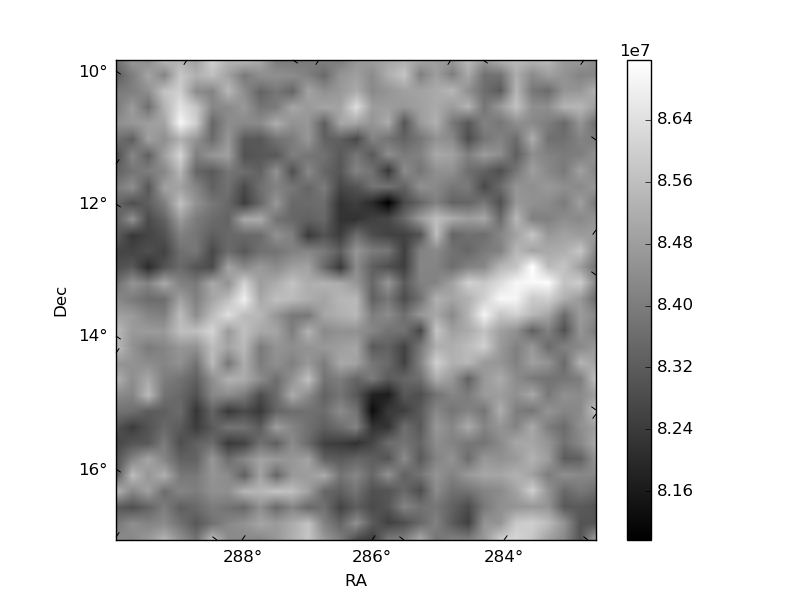
Quadrant B |
|---|---|---|---|
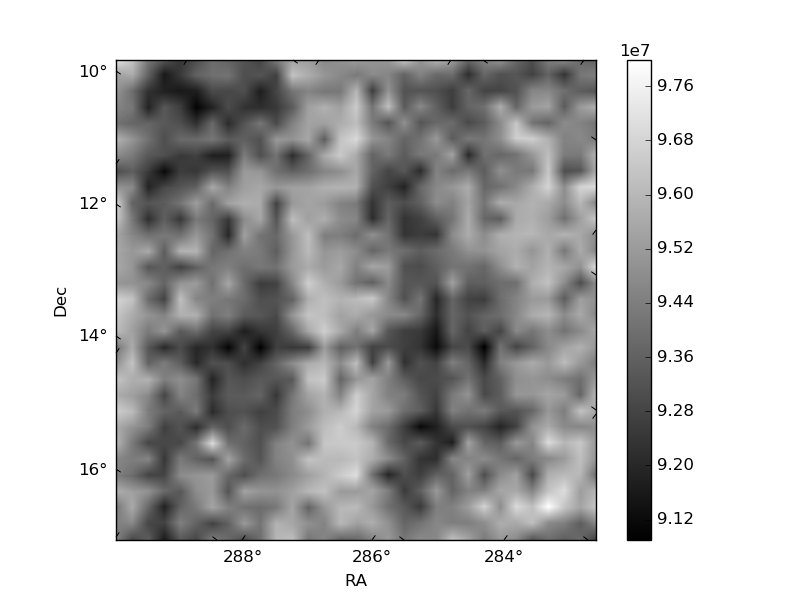
| Quadrant D | 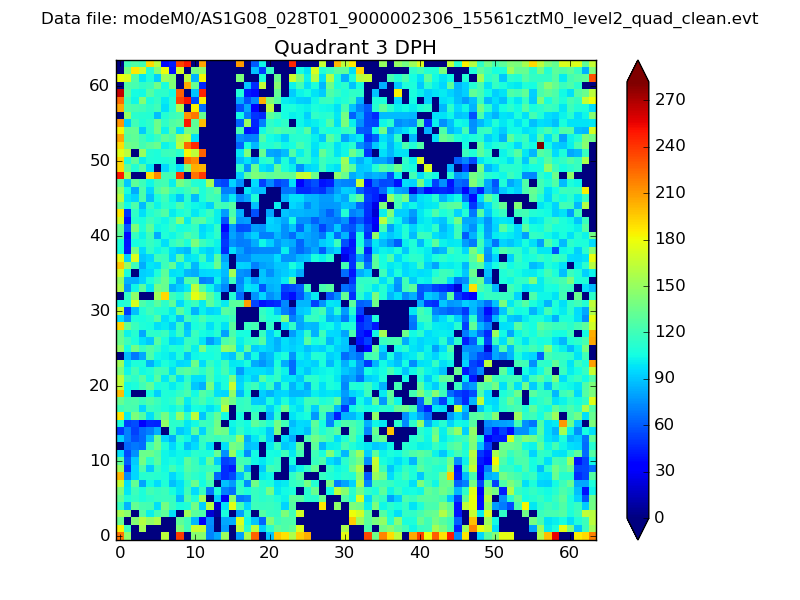 |
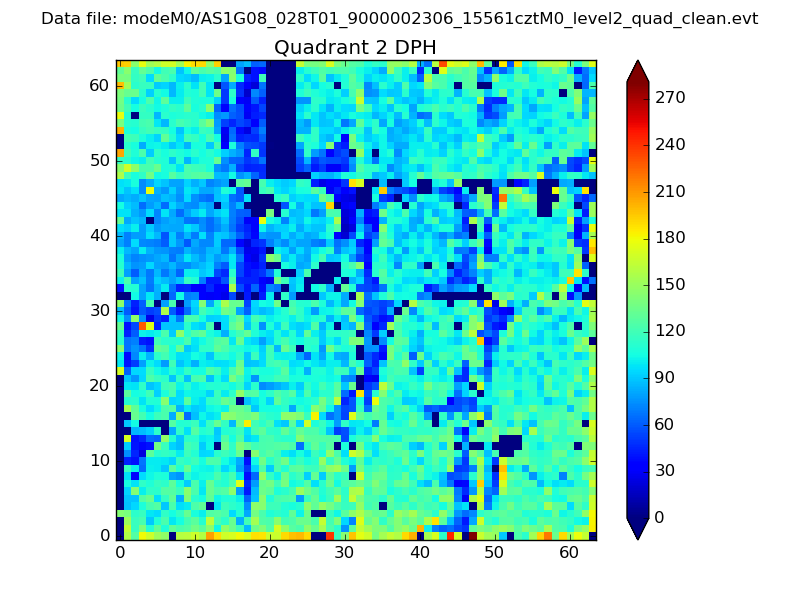 |
Quadrant C |
| Plot type | Count rate plots | Images |
|---|---|---|
| Comparison with Poisson distribution Blue bars denote a histogram of data divided into 1 sec bins. Red curve is a Poisson curve with rate = median count rate of data. |
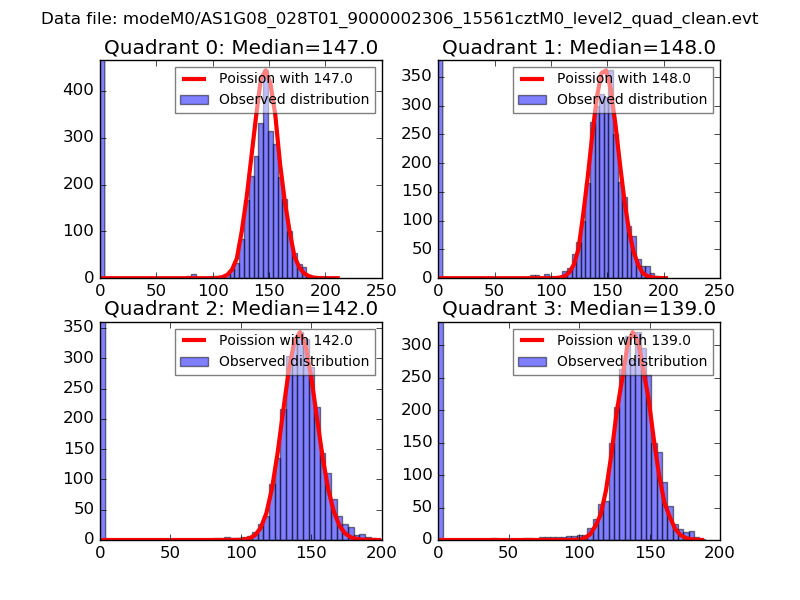 |
 |
| Quadrant-wise count rates Data is divided into 100 sec bins |
 |
|
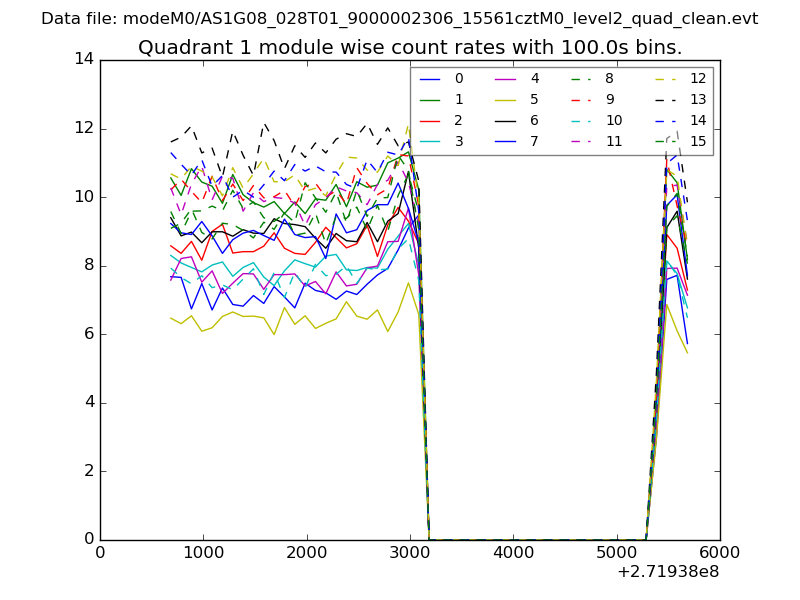
| Module-wise count rates for Quadrant A Data is divided into 100 sec bins |
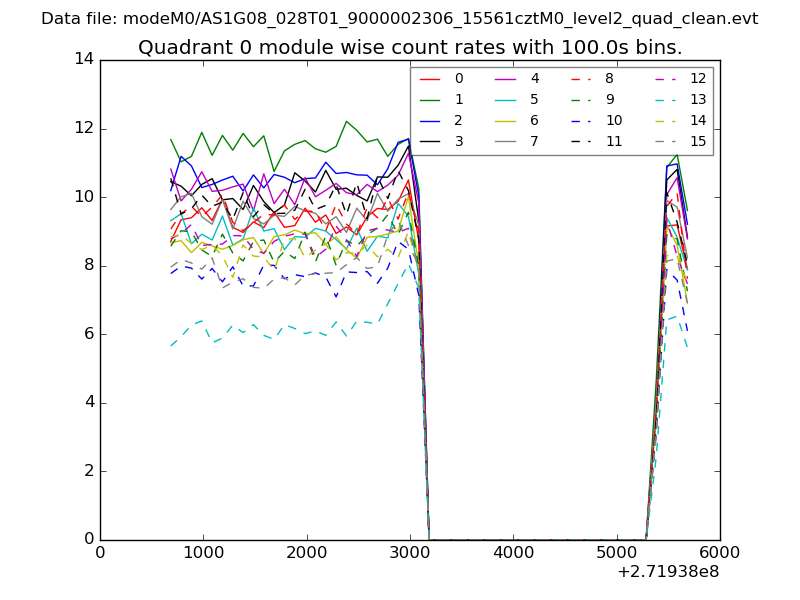 |
 |
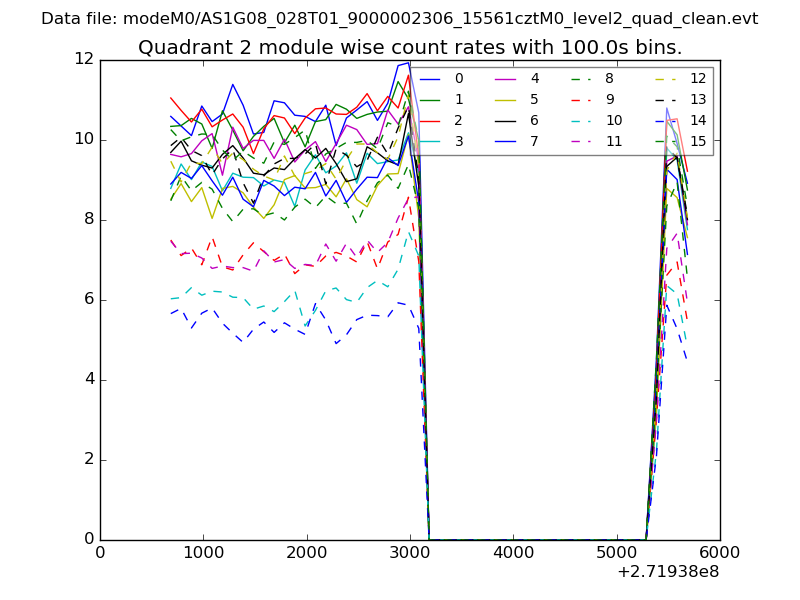
| Module-wise count rates for Quadrant B Data is divided into 100 sec bins |
 |
 |
| Module-wise count rates for Quadrant C Data is divided into 100 sec bins |
 |
 |
| Module-wise count rates for Quadrant D Data is divided into 100 sec bins |
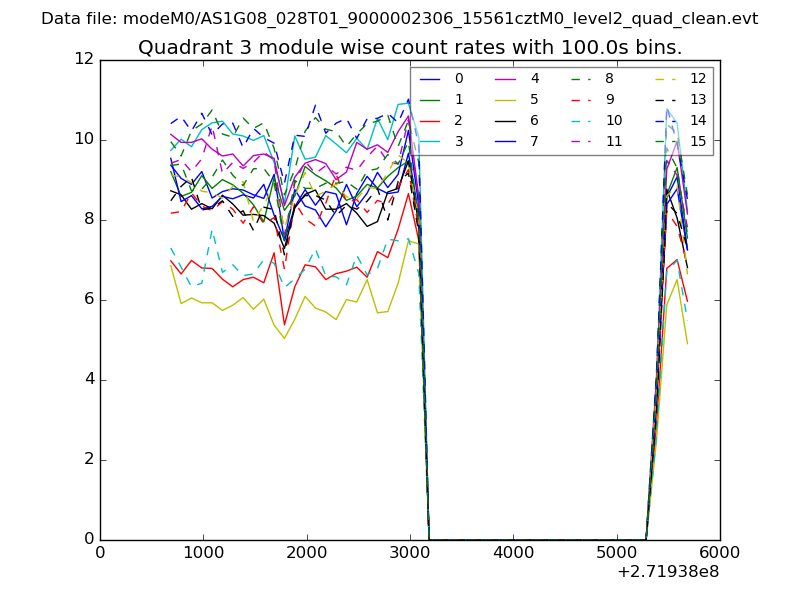 |
 |
| Parameter | Plot |
|---|---|
| CZT HV Monitor | 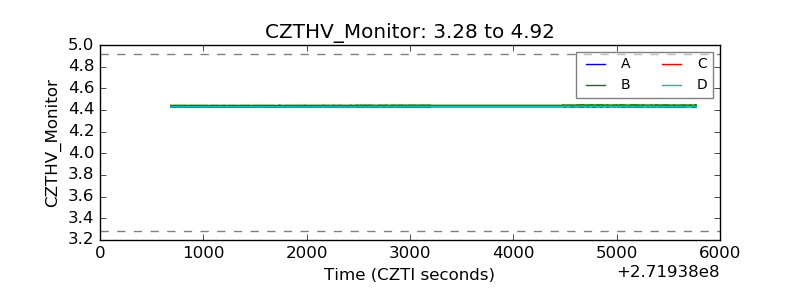 |
| D_VDD | 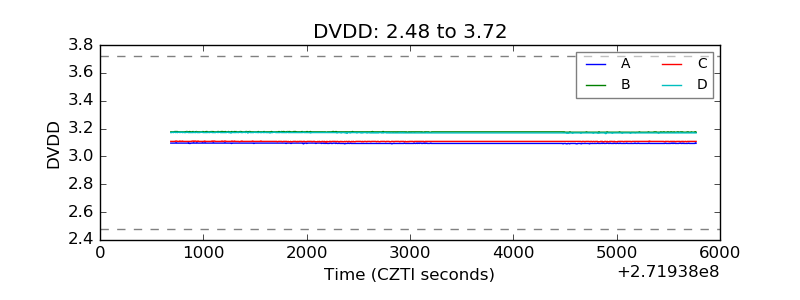 |
| Temperature 1 | 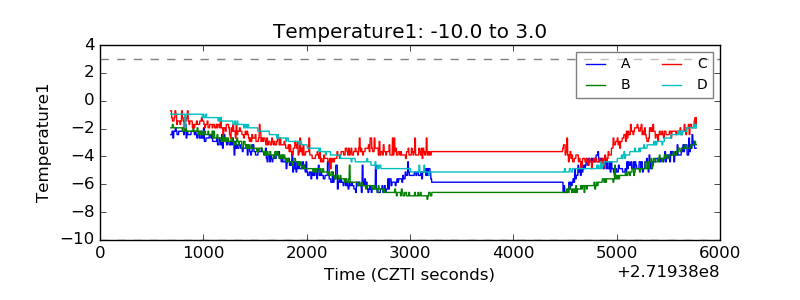 |
| Veto HV Monitor | 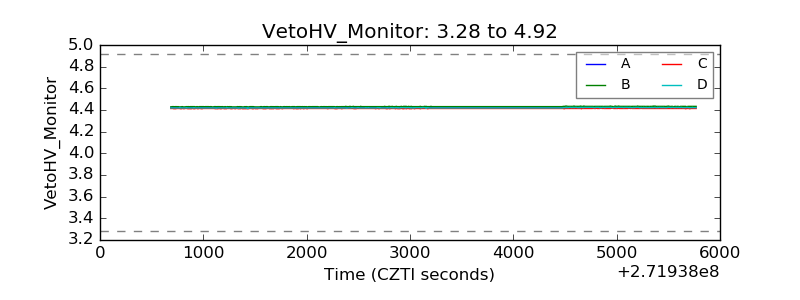 |
| Veto LLD | 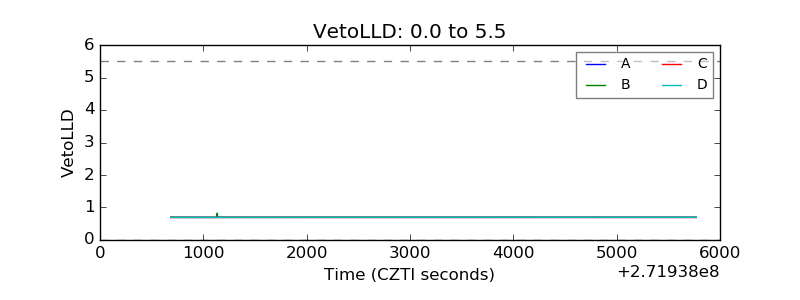 |
| Alpha Counter |  |
| _CPM_Rate |  |
| CZT Counter | 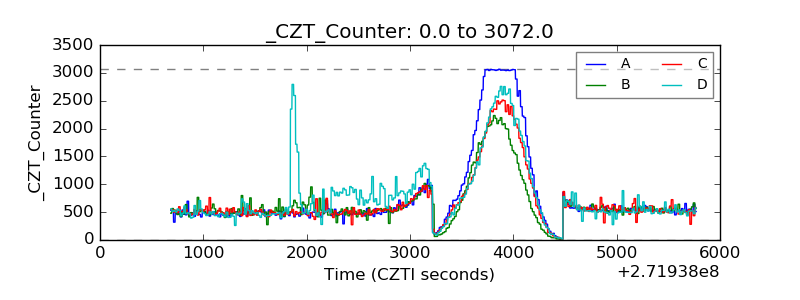 |
| +2.5 Volts monitor |  |
| +5 Volts monitor |  |
| _ROLL_ROT | 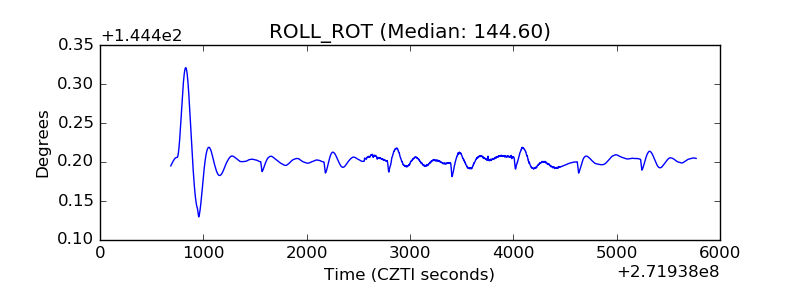 |
| _Roll_DEC | 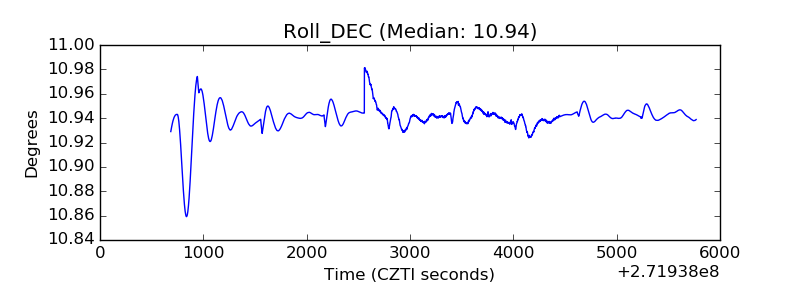 |
| _Roll_RA | 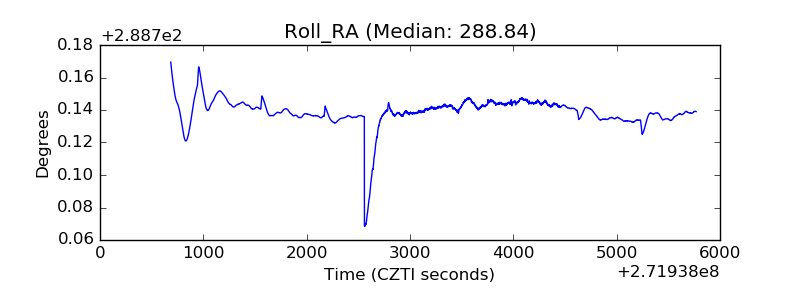 |
| Veto Counter | 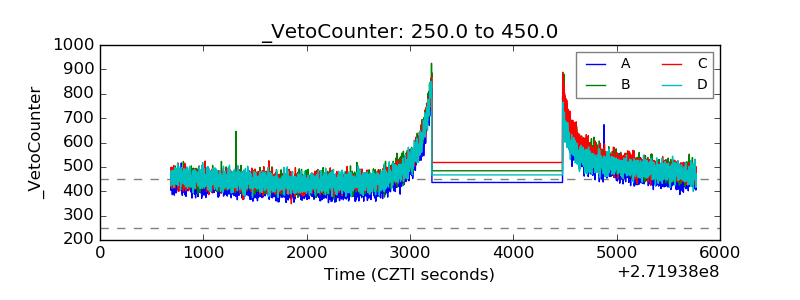 |