| Param | Original file | Final file |
|---|---|---|
| Filename | modeM0/AS1G08_028T01_9000002306_15562cztM0_level2.evt | modeM0/AS1G08_028T01_9000002306_15562cztM0_level2_quad_clean.evt |
| Size (bytes) | 507,850,560 | 100,650,240 |
| Size | 484.3 MB | 96.0 MB |
| Events in quadrant A | 3,651,995 | 657,201 |
| Events in quadrant B | 3,811,562 | 659,213 |
| Events in quadrant C | 3,690,434 | 626,626 |
| Events in quadrant D | 3,752,666 | 619,292 |
| Mode M9 | |||
|---|---|---|---|
| Quadrant | BADHDUFLAG | Total packets | Discarded packets |
| A | 0 | 22 | 0 |
| B | 0 | 22 | 0 |
| C | 0 | 22 | 0 |
| D | 0 | 22 | 0 |
| Mode M0 | |||
|---|---|---|---|
| Quadrant | BADHDUFLAG | Total packets | Discarded packets |
| A | 0 | 14900 | 3 |
| B | 0 | 15412 | 2 |
| C | 0 | 14952 | 2 |
| D | 0 | 15360 | 2 |
| Mode SS | |||
|---|---|---|---|
| Quadrant | BADHDUFLAG | Total packets | Discarded packets |
| A | 0 | 144 | 0 |
| B | 0 | 144 | 0 |
| C | 0 | 144 | 0 |
| D | 0 | 144 | 0 |
| Quadrant | Total seconds | Saturated seconds | Saturation percentage |
|---|---|---|---|
| A | 6972 | 203 | 2.911647% |
| B | 6972 | 221 | 3.169822% |
| C | 6972 | 234 | 3.356282% |
| D | 6972 | 194 | 2.782559% |
Noise dominated data is calculated using 1-second bins in cleaned event files. If a bin has >2000 counts, and if more than 50% of those come from <1% of pixels, then it is considered to be noise-dominated and hence unusable.
| Quadrant | # 1 sec bins | Bins with >0 counts | Bins with >2000 counts | High rate bins dominated by noise | Noise dominated (total time) | Noise dominated (detector-on time) | Marked lightcurve |
|---|---|---|---|---|---|---|---|
| A | 9213 | 6973 | 6 | 6 | 0.07% | 0.09% | 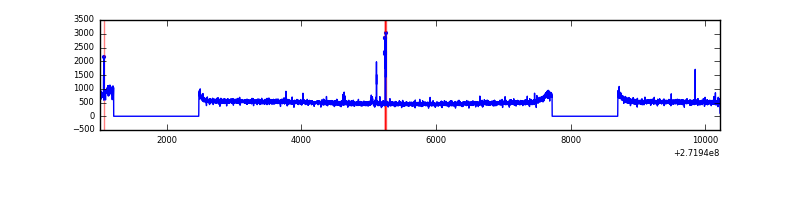 |
| B | 9213 | 6973 | 9 | 9 | 0.10% | 0.13% | 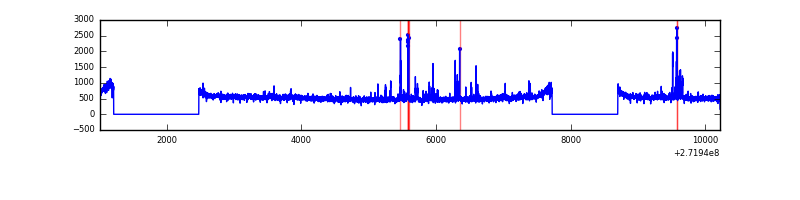 |
| C | 9213 | 6973 | 7 | 7 | 0.08% | 0.10% | 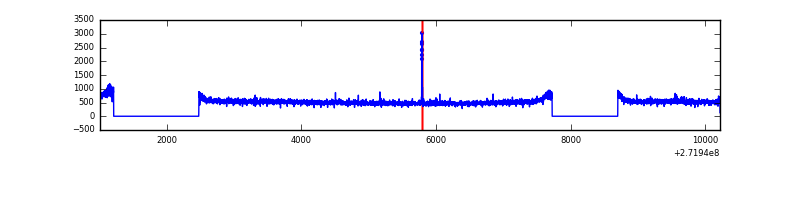 |
| D | 9213 | 6973 | 15 | 15 | 0.16% | 0.22% | 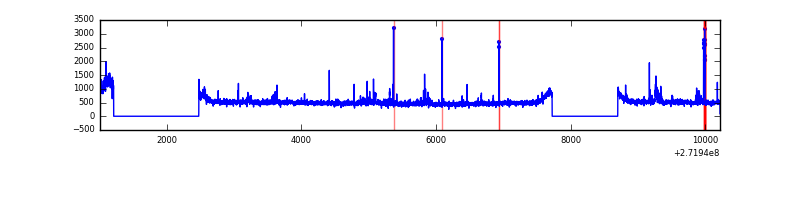 |
Top three noisy pixels from each quadrant. If the there are fewer than three noisy pixels in the level2.evt file, extra rows are filled as -1
| Pixel properties | Quadrant properties | ||||||
|---|---|---|---|---|---|---|---|
| Quadrant | DetID | PixID | Counts | Sigma | Mean | Median | Sigma |
| A | 15 | 223 | 26552 | 136.26 | 937 | 918 | 188.1 |
| A | 7 | 16 | 9475 | 45.48 | 937 | 918 | 188.1 |
| A | 0 | 226 | 8335 | 39.42 | 937 | 918 | 188.1 |
| B | 0 | 189 | 78040 | 433.21 | 923 | 898 | 178.1 |
| B | 4 | 48 | 53962 | 298.0 | 923 | 898 | 178.1 |
| B | 0 | 214 | 25200 | 136.48 | 923 | 898 | 178.1 |
| C | 14 | 238 | 135656 | 647.71 | 888 | 896 | 208.1 |
| C | 3 | 233 | 63830 | 302.49 | 888 | 896 | 208.1 |
| C | 10 | 22 | 23691 | 109.56 | 888 | 896 | 208.1 |
| D | 1 | 52 | 70190 | 310.67 | 909 | 883 | 223.1 |
| D | 12 | 221 | 63207 | 279.37 | 909 | 883 | 223.1 |
| D | 5 | 222 | 62766 | 277.39 | 909 | 883 | 223.1 |
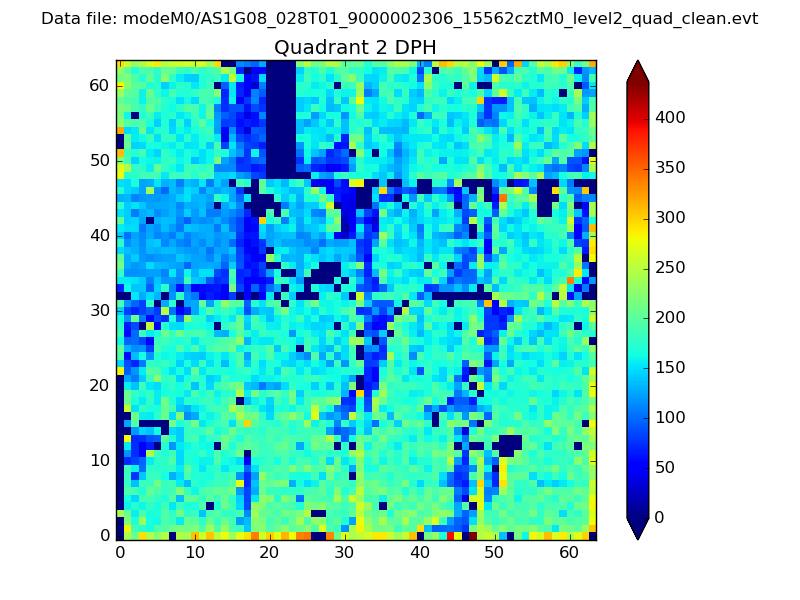
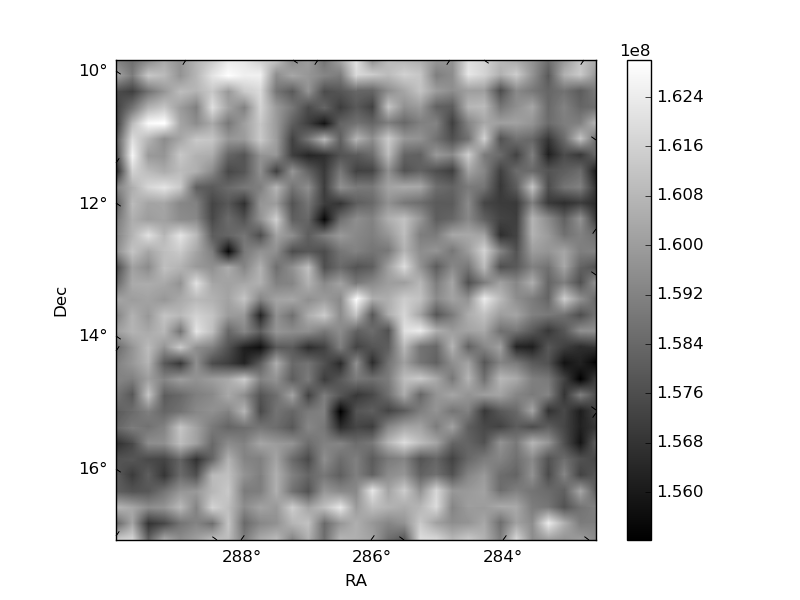
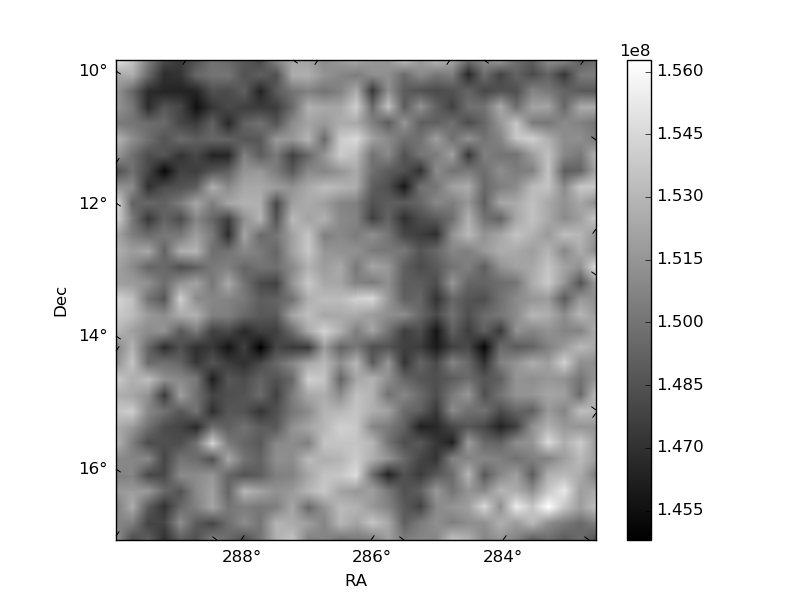
Histogram calculated using DETX and DETY for each event in the final _common_clean file
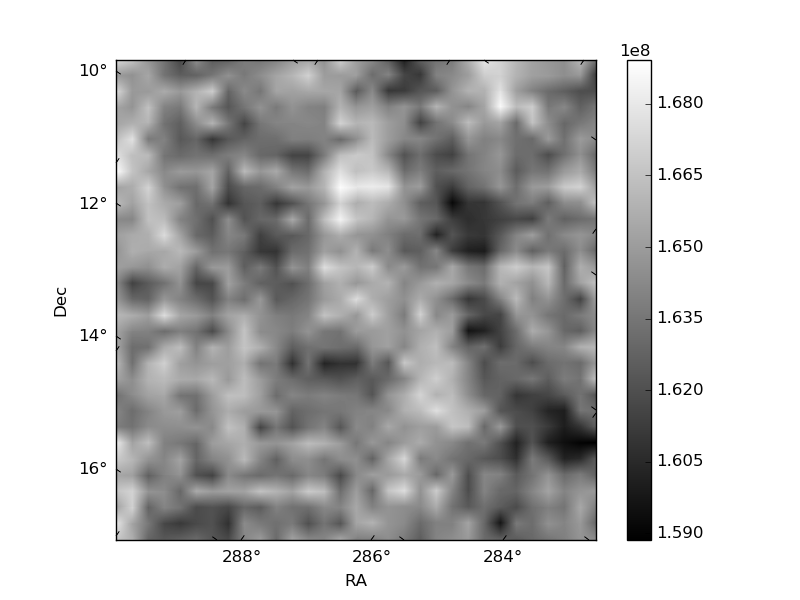
| Quadrant A | 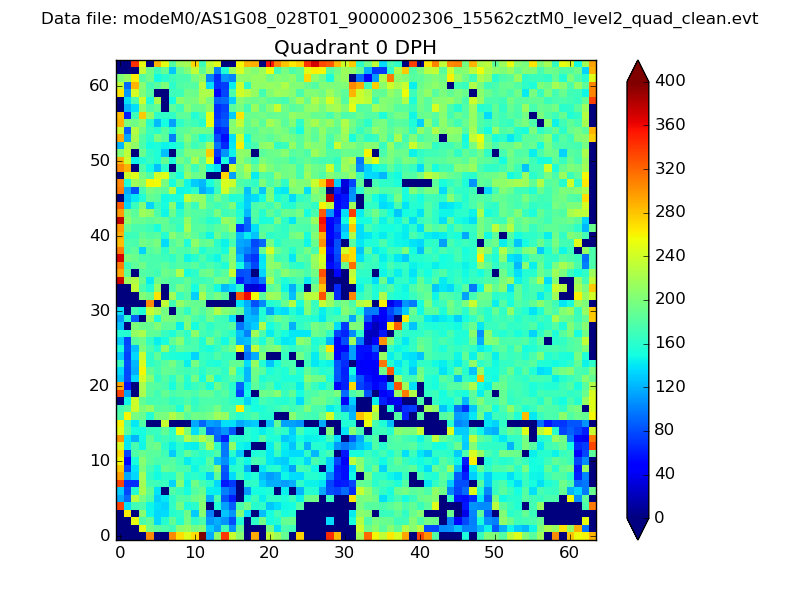 |
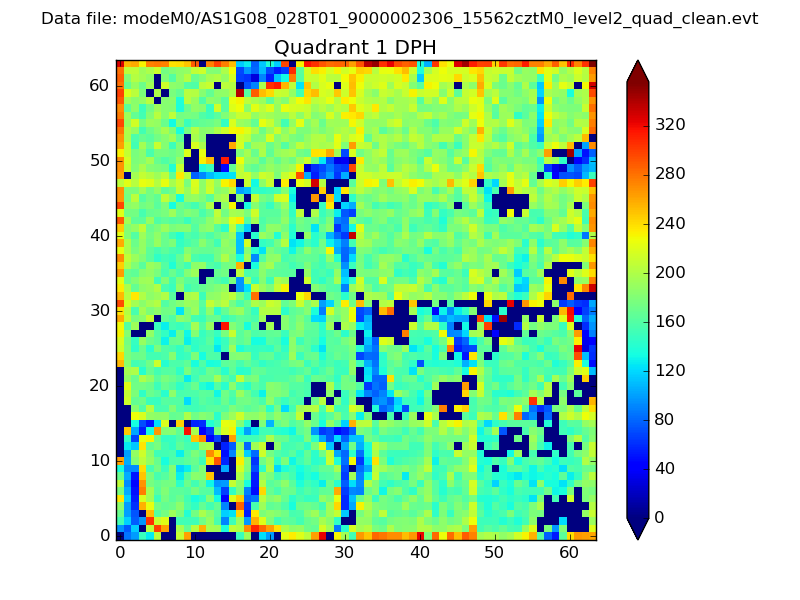 |
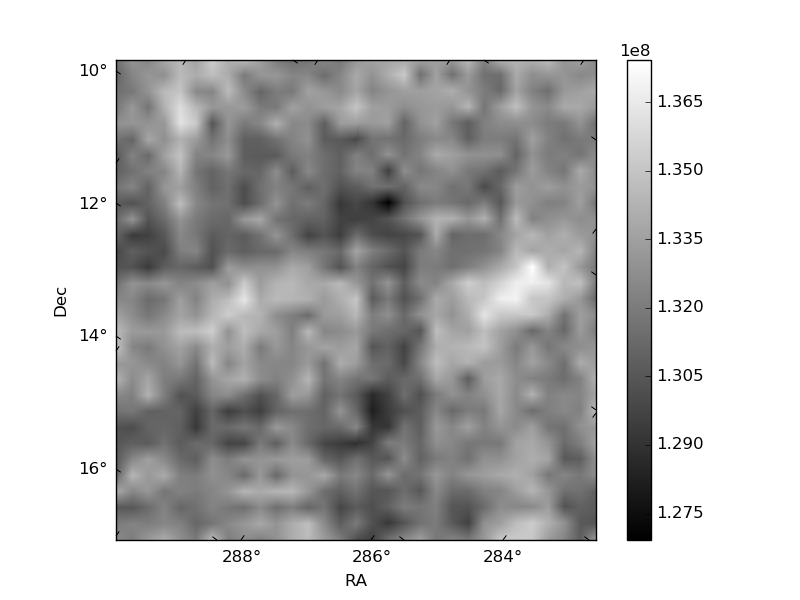
Quadrant B |
|---|---|---|---|
| Quadrant D | 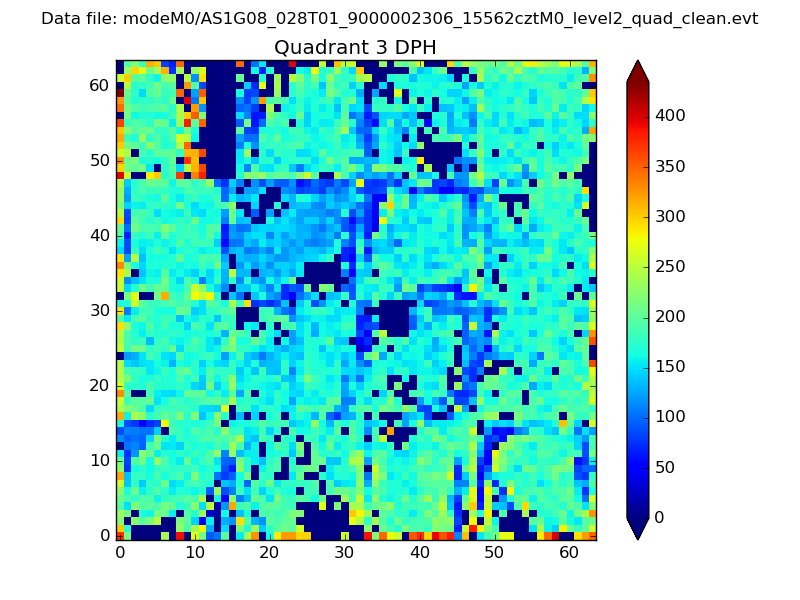 |
 |
Quadrant C |
| Plot type | Count rate plots | Images |
|---|---|---|
| Comparison with Poisson distribution Blue bars denote a histogram of data divided into 1 sec bins. Red curve is a Poisson curve with rate = median count rate of data. |
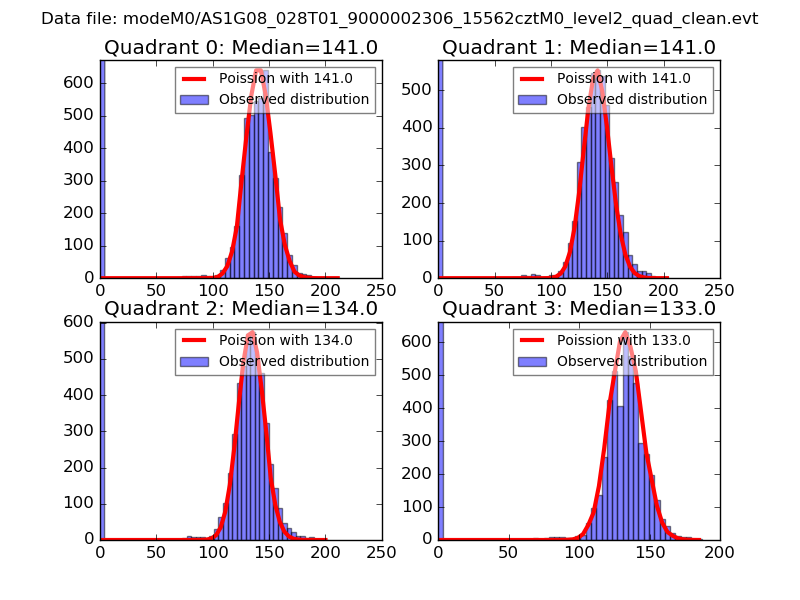 |
 |
| Quadrant-wise count rates Data is divided into 100 sec bins |
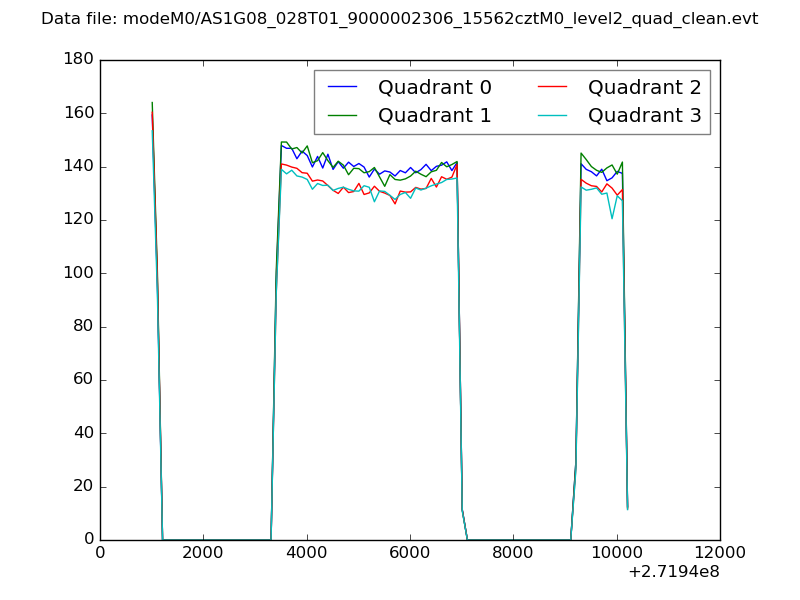 |
|
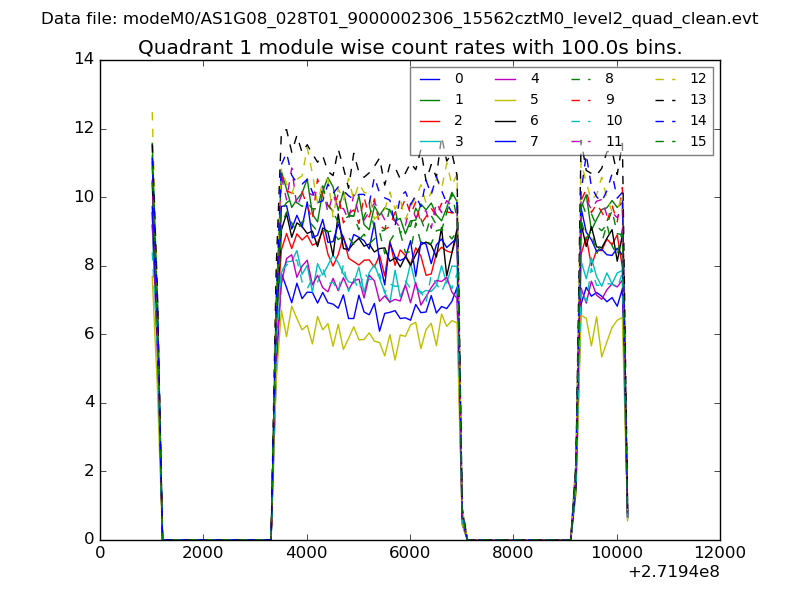
| Module-wise count rates for Quadrant A Data is divided into 100 sec bins |
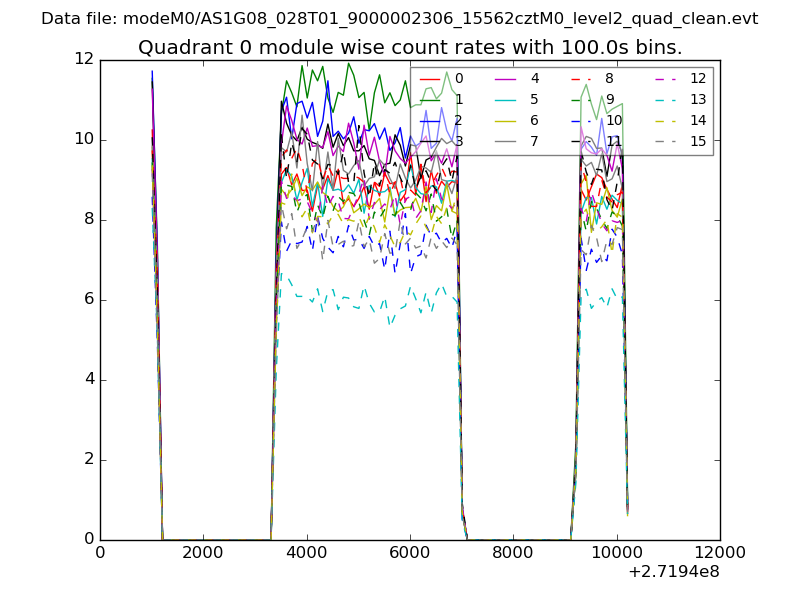 |
 |
| Module-wise count rates for Quadrant B Data is divided into 100 sec bins |
 |
 |
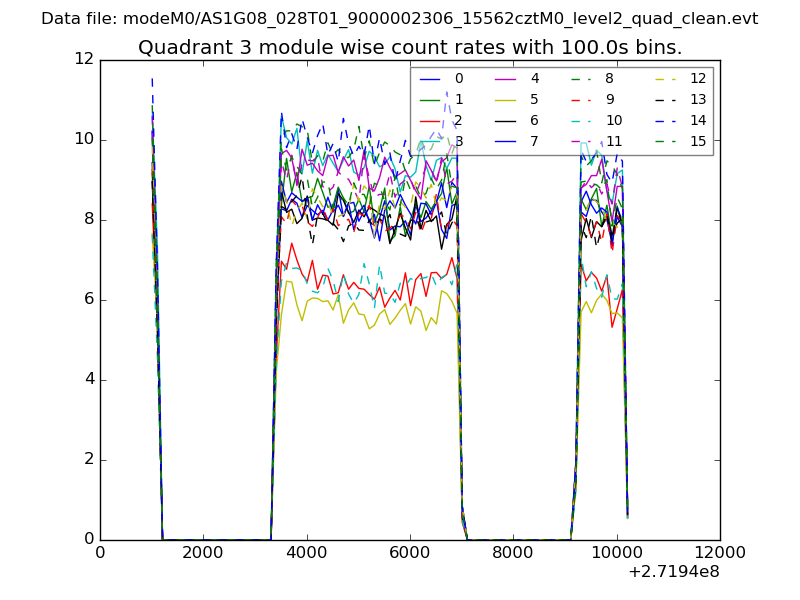
| Module-wise count rates for Quadrant C Data is divided into 100 sec bins |
 |
 |
| Module-wise count rates for Quadrant D Data is divided into 100 sec bins |
 |
 |
| Parameter | Plot |
|---|---|
| CZT HV Monitor | 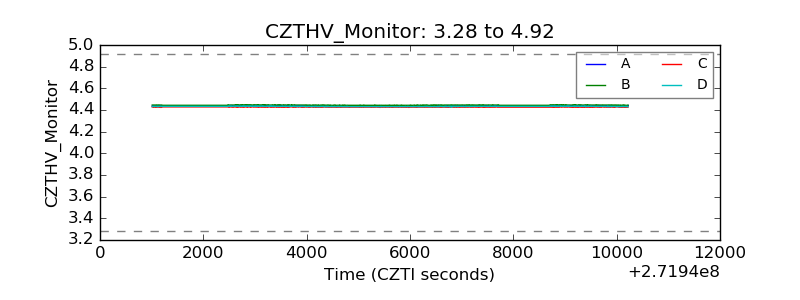 |
| D_VDD | 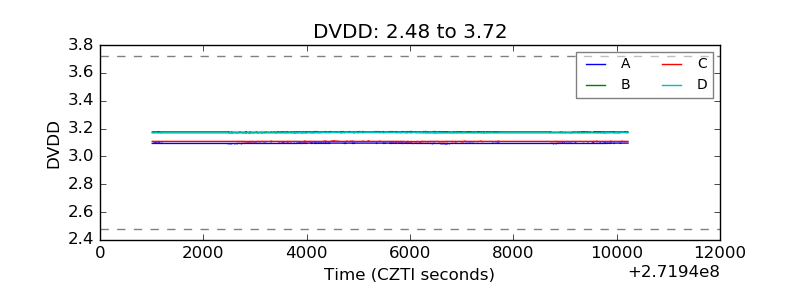 |
| Temperature 1 | 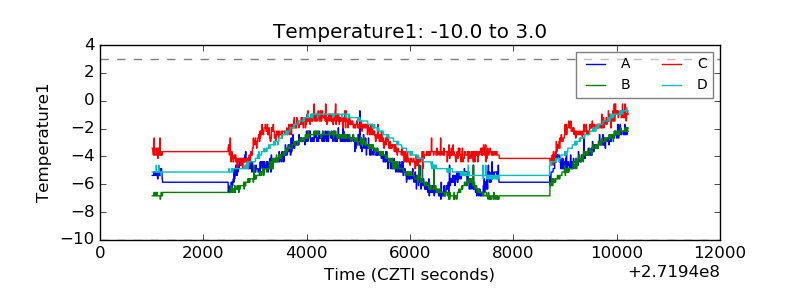 |
| Veto HV Monitor | 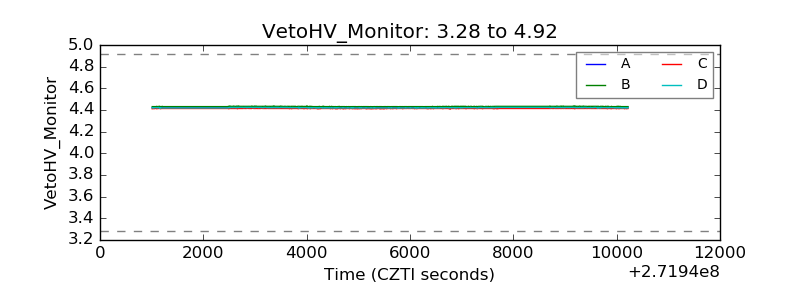 |
| Veto LLD |  |
| Alpha Counter | 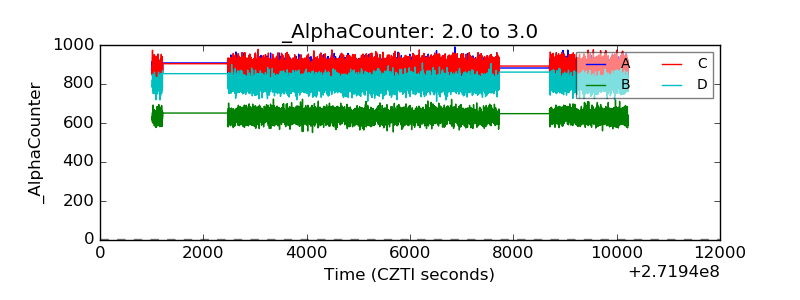 |
| _CPM_Rate | 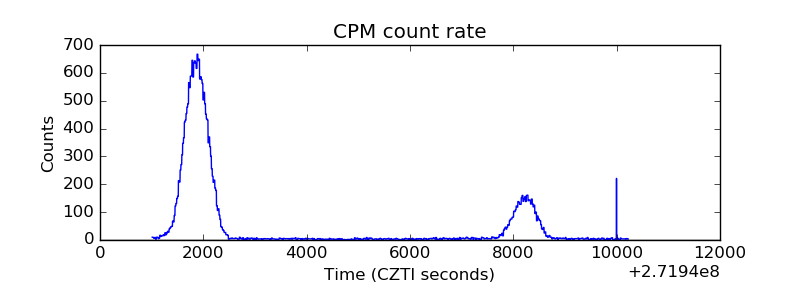 |
| CZT Counter | 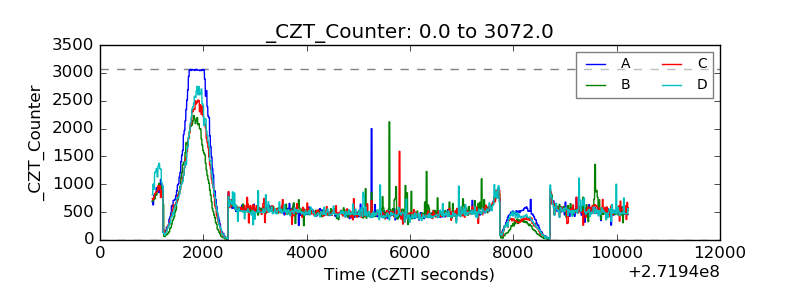 |
| +2.5 Volts monitor |  |
| +5 Volts monitor | 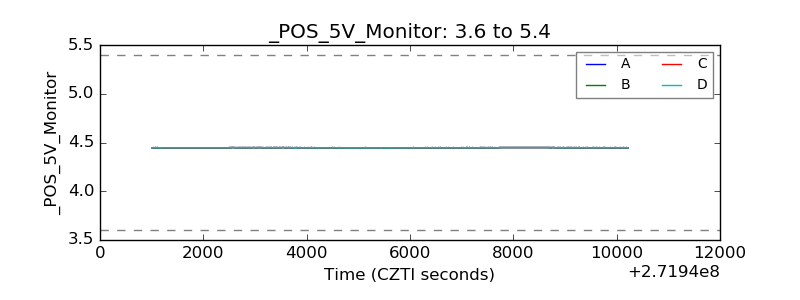 |
| _ROLL_ROT | 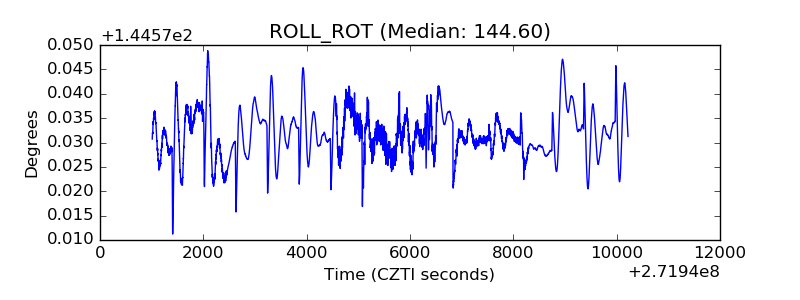 |
| _Roll_DEC | 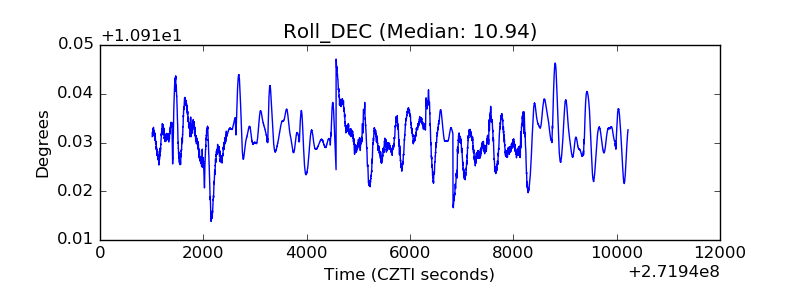 |
| _Roll_RA |  |
| Veto Counter | 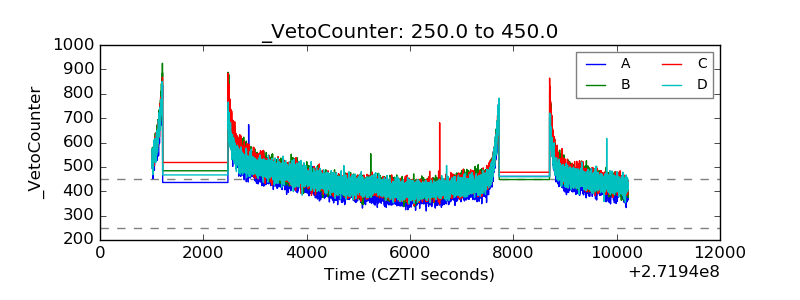 |