| Param | Original file | Final file |
|---|---|---|
| Filename | modeM0/AS1G08_028T01_9000002306_15564cztM0_level2.evt | modeM0/AS1G08_028T01_9000002306_15564cztM0_level2_quad_clean.evt |
| Size (bytes) | 559,405,440 | 104,253,120 |
| Size | 533.5 MB | 99.4 MB |
| Events in quadrant A | 3,942,906 | 669,217 |
| Events in quadrant B | 4,279,498 | 672,562 |
| Events in quadrant C | 3,977,405 | 645,217 |
| Events in quadrant D | 4,211,413 | 627,029 |
| Mode M9 | |||
|---|---|---|---|
| Quadrant | BADHDUFLAG | Total packets | Discarded packets |
| A | 0 | 6 | 0 |
| B | 0 | 6 | 0 |
| C | 0 | 6 | 0 |
| D | 0 | 6 | 0 |
| Mode M0 | |||
|---|---|---|---|
| Quadrant | BADHDUFLAG | Total packets | Discarded packets |
| A | 0 | 16733 | 3 |
| B | 0 | 17671 | 2 |
| C | 0 | 16666 | 2 |
| D | 0 | 17699 | 2 |
| Mode SS | |||
|---|---|---|---|
| Quadrant | BADHDUFLAG | Total packets | Discarded packets |
| A | 0 | 162 | 0 |
| B | 0 | 162 | 0 |
| C | 0 | 162 | 0 |
| D | 0 | 162 | 0 |
| Quadrant | Total seconds | Saturated seconds | Saturation percentage |
|---|---|---|---|
| A | 7806 | 262 | 3.356393% |
| B | 7806 | 381 | 4.880861% |
| C | 7806 | 305 | 3.907251% |
| D | 7806 | 222 | 2.843966% |
Noise dominated data is calculated using 1-second bins in cleaned event files. If a bin has >2000 counts, and if more than 50% of those come from <1% of pixels, then it is considered to be noise-dominated and hence unusable.
| Quadrant | # 1 sec bins | Bins with >0 counts | Bins with >2000 counts | High rate bins dominated by noise | Noise dominated (total time) | Noise dominated (detector-on time) | Marked lightcurve |
|---|---|---|---|---|---|---|---|
| A | 8467 | 7808 | 3 | 3 | 0.04% | 0.04% | 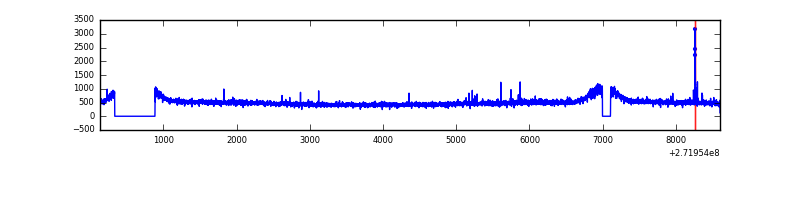 |
| B | 8467 | 7809 | 15 | 15 | 0.18% | 0.19% |  |
| C | 8467 | 7808 | 0 | 0 | 0.00% | 0.00% |  |
| D | 8467 | 7809 | 29 | 29 | 0.34% | 0.37% | 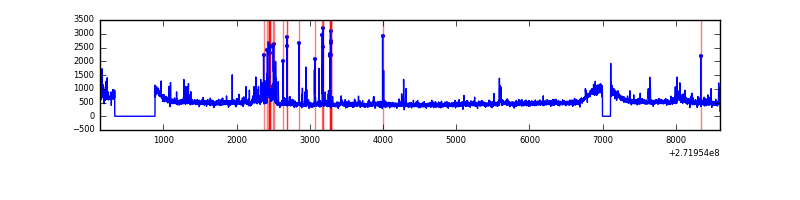 |
Top three noisy pixels from each quadrant. If the there are fewer than three noisy pixels in the level2.evt file, extra rows are filled as -1
| Pixel properties | Quadrant properties | ||||||
|---|---|---|---|---|---|---|---|
| Quadrant | DetID | PixID | Counts | Sigma | Mean | Median | Sigma |
| A | 9 | 143 | 34966 | 163.19 | 1016 | 991 | 208.2 |
| A | 0 | 226 | 9067 | 38.79 | 1016 | 991 | 208.2 |
| A | 12 | 194 | 7383 | 30.7 | 1016 | 991 | 208.2 |
| B | 4 | 48 | 217951 | 1107.22 | 1005 | 979 | 196.0 |
| B | 0 | 189 | 34553 | 171.33 | 1005 | 979 | 196.0 |
| B | 3 | 64 | 27619 | 135.95 | 1005 | 979 | 196.0 |
| C | 14 | 238 | 147345 | 636.51 | 969 | 976 | 230.0 |
| C | 7 | 247 | 19128 | 78.94 | 969 | 976 | 230.0 |
| C | 3 | 233 | 13652 | 55.12 | 969 | 976 | 230.0 |
| D | 1 | 52 | 190524 | 777.33 | 993 | 965 | 243.9 |
| D | 5 | 222 | 76635 | 310.3 | 993 | 965 | 243.9 |
| D | 10 | 70 | 43210 | 173.24 | 993 | 965 | 243.9 |
Histogram calculated using DETX and DETY for each event in the final _common_clean file
| Quadrant A |  |
 |
Quadrant B |
|---|---|---|---|
| Quadrant D |  |
 |
Quadrant C |
| Plot type | Count rate plots | Images |
|---|---|---|
| Comparison with Poisson distribution Blue bars denote a histogram of data divided into 1 sec bins. Red curve is a Poisson curve with rate = median count rate of data. |
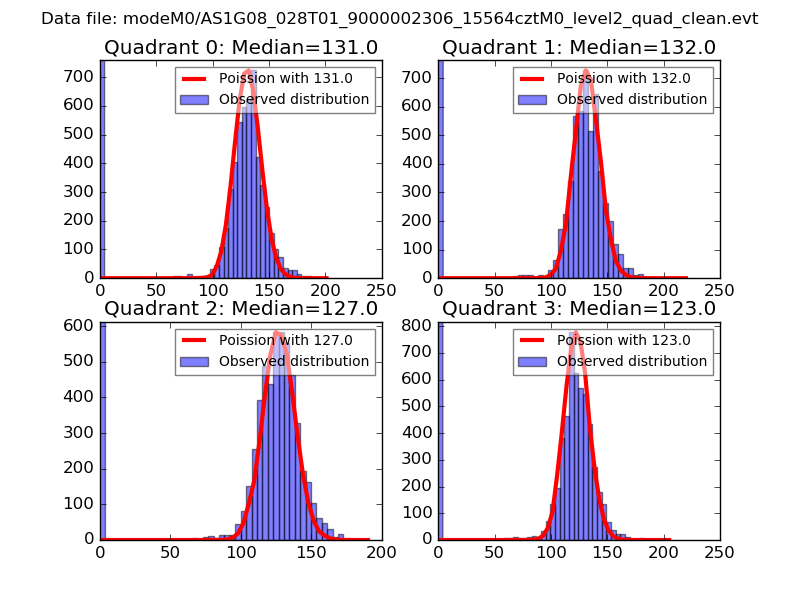 |
 |
| Quadrant-wise count rates Data is divided into 100 sec bins |
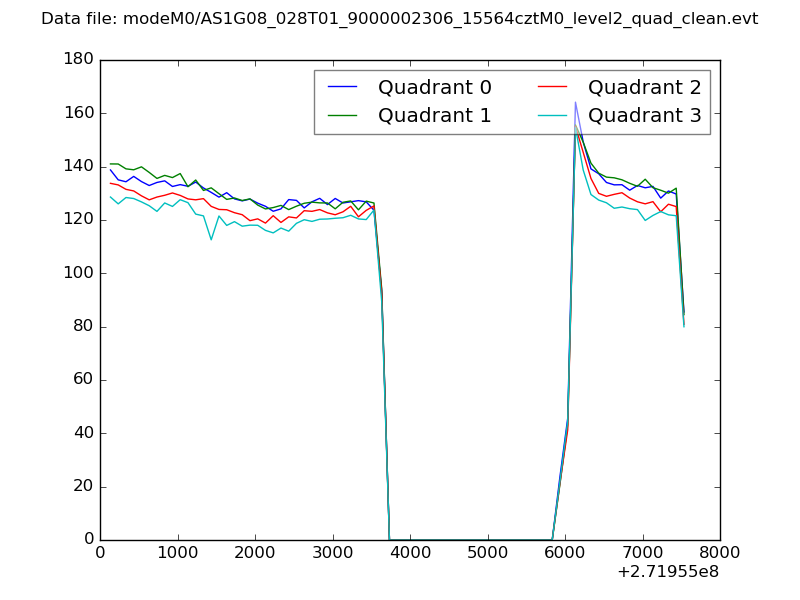 |
|
| Module-wise count rates for Quadrant A Data is divided into 100 sec bins |
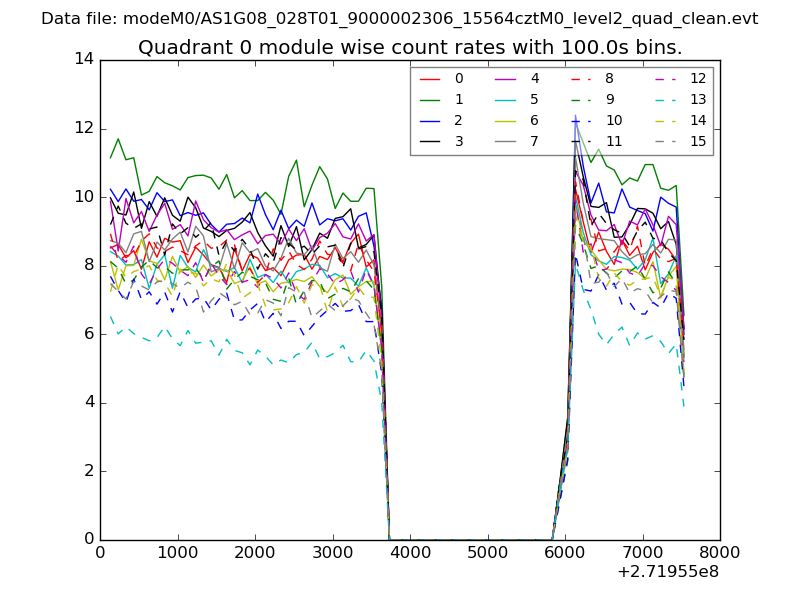 |
 |
| Module-wise count rates for Quadrant B Data is divided into 100 sec bins |
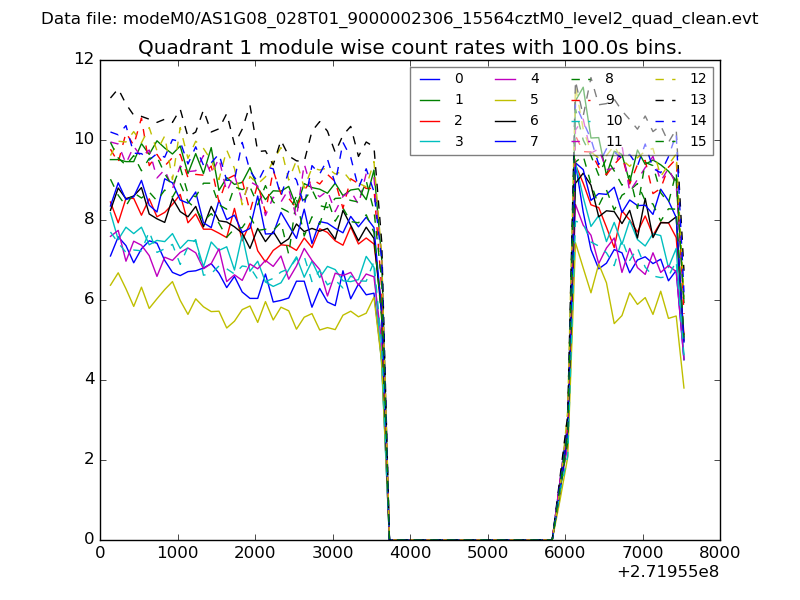 |
 |
| Module-wise count rates for Quadrant C Data is divided into 100 sec bins |
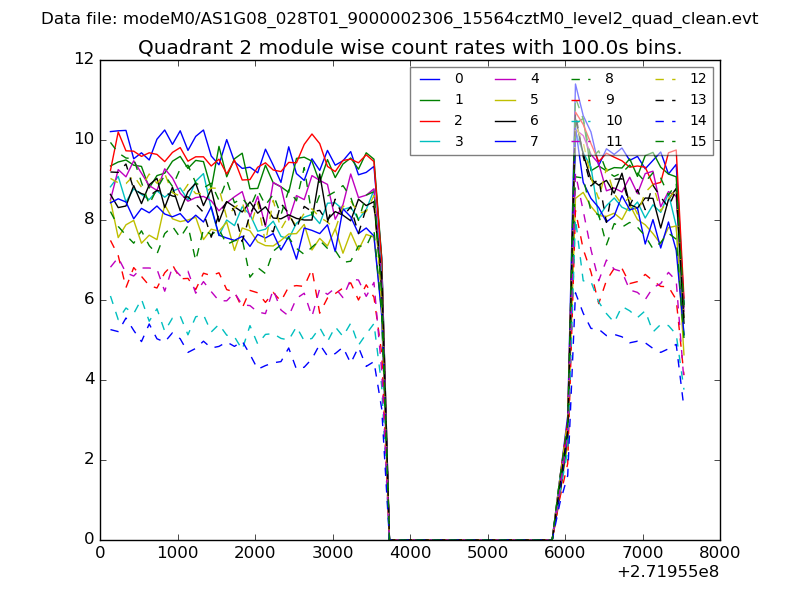 |
 |
| Module-wise count rates for Quadrant D Data is divided into 100 sec bins |
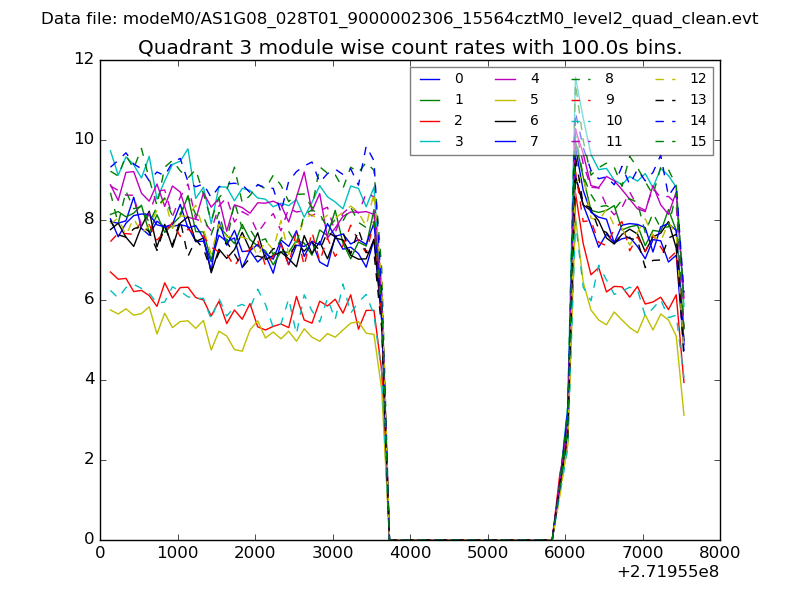 |
 |
| Parameter | Plot |
|---|---|
| CZT HV Monitor | 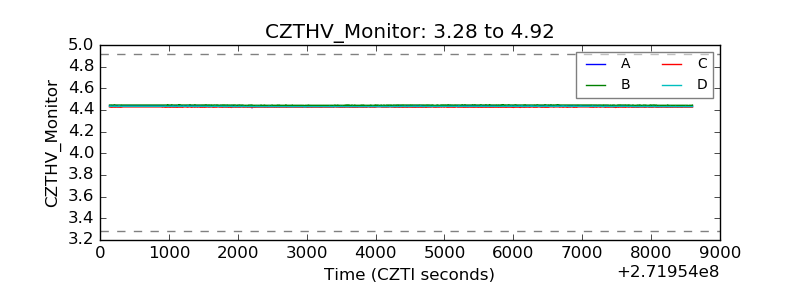 |
| D_VDD |  |
| Temperature 1 |  |
| Veto HV Monitor |  |
| Veto LLD |  |
| Alpha Counter | 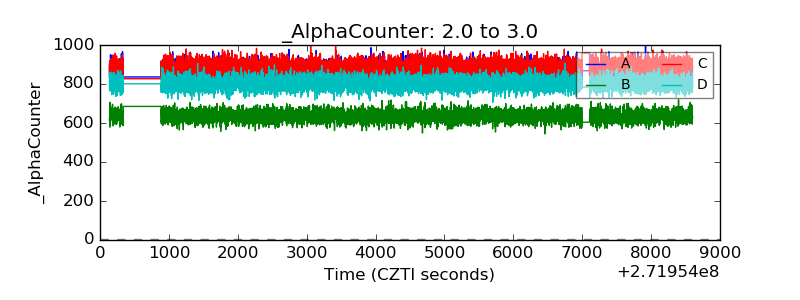 |
| _CPM_Rate | 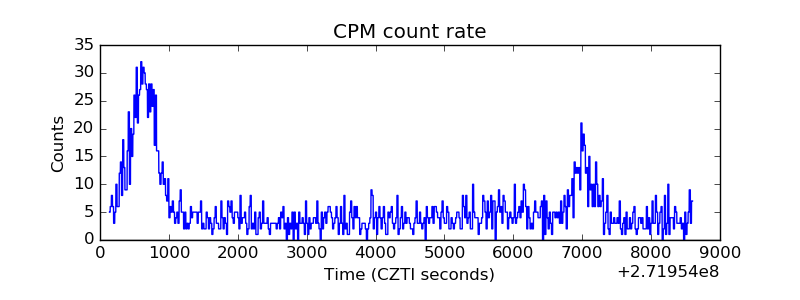 |
| CZT Counter |  |
| +2.5 Volts monitor |  |
| +5 Volts monitor |  |
| _ROLL_ROT |  |
| _Roll_DEC |  |
| _Roll_RA |  |
| Veto Counter | 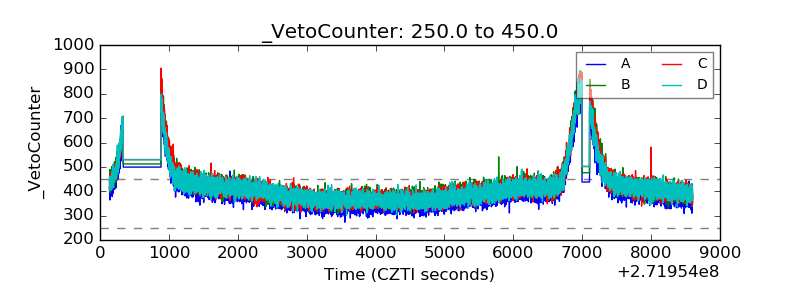 |