| Param | Original file | Final file |
|---|---|---|
| Filename | modeM0/AS1G08_028T01_9000002306_15565cztM0_level2.evt | modeM0/AS1G08_028T01_9000002306_15565cztM0_level2_quad_clean.evt |
| Size (bytes) | 617,829,120 | 104,855,040 |
| Size | 589.2 MB | 100.0 MB |
| Events in quadrant A | 3,695,166 | 690,414 |
| Events in quadrant B | 3,857,288 | 693,728 |
| Events in quadrant C | 5,616,537 | 639,115 |
| Events in quadrant D | 5,030,634 | 627,469 |
| Mode M9 | |||
|---|---|---|---|
| Quadrant | BADHDUFLAG | Total packets | Discarded packets |
| A | 0 | 3 | 0 |
| B | 0 | 3 | 0 |
| C | 0 | 3 | 0 |
| D | 0 | 3 | 0 |
| Mode M0 | |||
|---|---|---|---|
| Quadrant | BADHDUFLAG | Total packets | Discarded packets |
| A | 0 | 15906 | 3 |
| B | 0 | 16256 | 2 |
| C | 0 | 21757 | 2 |
| D | 0 | 19838 | 2 |
| Mode SS | |||
|---|---|---|---|
| Quadrant | BADHDUFLAG | Total packets | Discarded packets |
| A | 0 | 154 | 0 |
| B | 0 | 154 | 0 |
| C | 0 | 154 | 0 |
| D | 0 | 154 | 0 |
| Quadrant | Total seconds | Saturated seconds | Saturation percentage |
|---|---|---|---|
| A | 7540 | 121 | 1.604775% |
| B | 7540 | 188 | 2.493369% |
| C | 7540 | 1036 | 13.740053% |
| D | 7540 | 464 | 6.153846% |
Noise dominated data is calculated using 1-second bins in cleaned event files. If a bin has >2000 counts, and if more than 50% of those come from <1% of pixels, then it is considered to be noise-dominated and hence unusable.
| Quadrant | # 1 sec bins | Bins with >0 counts | Bins with >2000 counts | High rate bins dominated by noise | Noise dominated (total time) | Noise dominated (detector-on time) | Marked lightcurve |
|---|---|---|---|---|---|---|---|
| A | 7756 | 7543 | 3 | 3 | 0.04% | 0.04% | 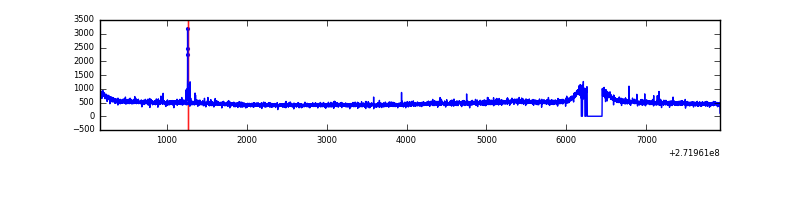 |
| B | 7756 | 7542 | 11 | 11 | 0.14% | 0.15% | 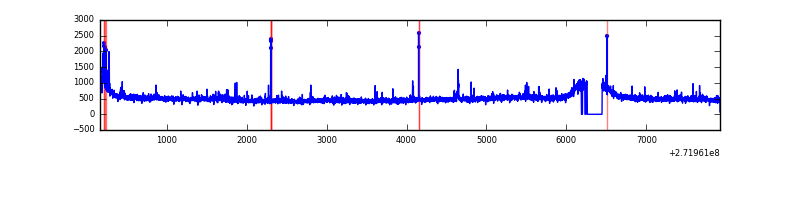 |
| C | 7756 | 7543 | 497 | 497 | 6.41% | 6.59% | 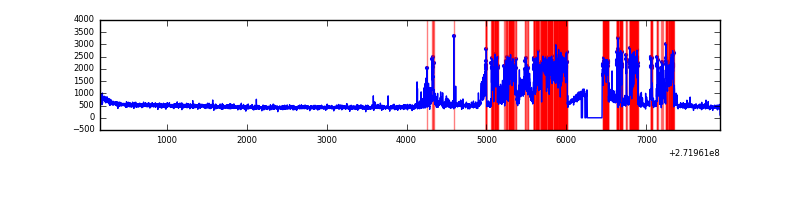 |
| D | 7756 | 7543 | 360 | 360 | 4.64% | 4.77% | 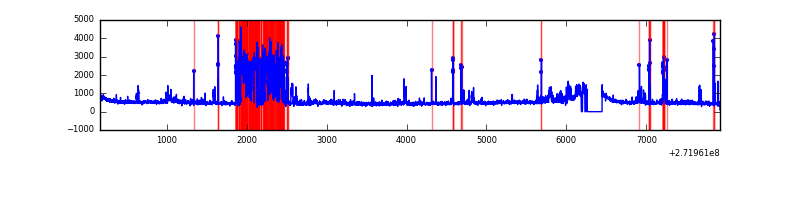 |
Top three noisy pixels from each quadrant. If the there are fewer than three noisy pixels in the level2.evt file, extra rows are filled as -1
| Pixel properties | Quadrant properties | ||||||
|---|---|---|---|---|---|---|---|
| Quadrant | DetID | PixID | Counts | Sigma | Mean | Median | Sigma |
| A | 9 | 143 | 28812 | 144.29 | 952 | 931 | 193.2 |
| A | 0 | 226 | 8563 | 39.5 | 952 | 931 | 193.2 |
| A | 12 | 194 | 7168 | 32.28 | 952 | 931 | 193.2 |
| B | 4 | 48 | 56753 | 308.25 | 944 | 920 | 181.1 |
| B | 0 | 189 | 32200 | 172.69 | 944 | 920 | 181.1 |
| B | 4 | 173 | 22252 | 117.77 | 944 | 920 | 181.1 |
| C | 3 | 233 | 2034095 | 9843.39 | 874 | 882 | 206.6 |
| C | 14 | 238 | 132786 | 638.59 | 874 | 882 | 206.6 |
| C | 8 | 128 | 11280 | 50.34 | 874 | 882 | 206.6 |
| D | 15 | 0 | 1116614 | 4920.94 | 912 | 884 | 226.7 |
| D | 5 | 222 | 209475 | 919.99 | 912 | 884 | 226.7 |
| D | 5 | 51 | 59486 | 258.46 | 912 | 884 | 226.7 |
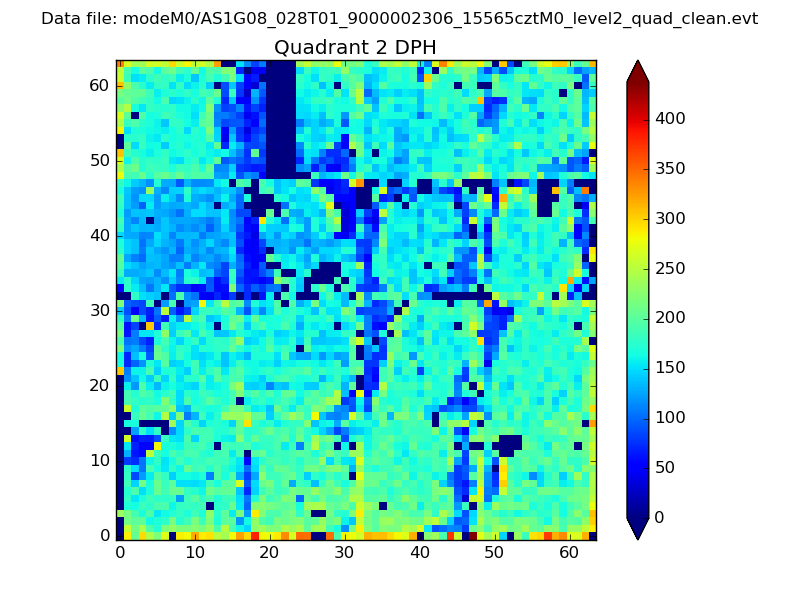
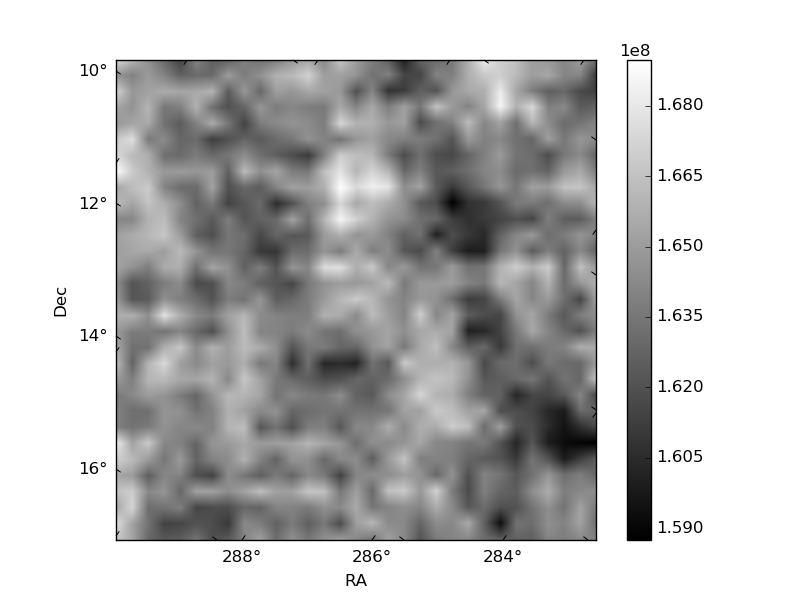
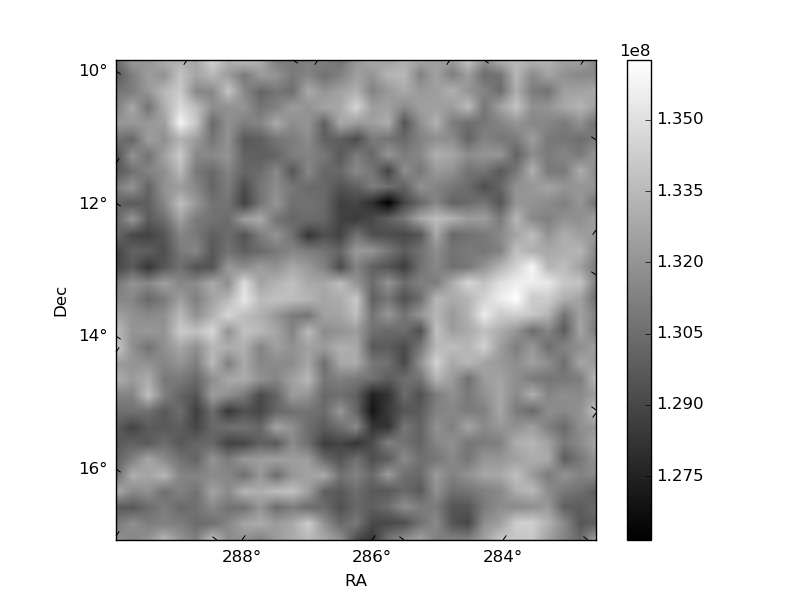
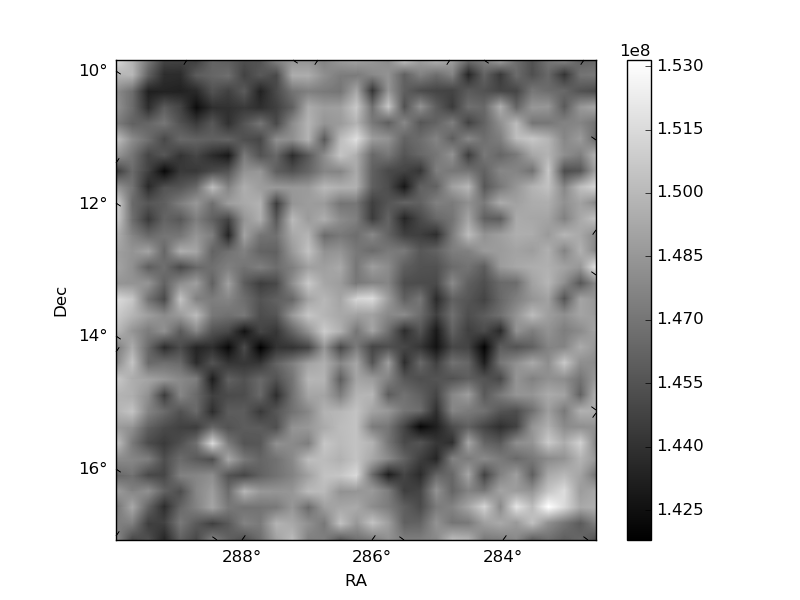
Histogram calculated using DETX and DETY for each event in the final _common_clean file
| Quadrant A | 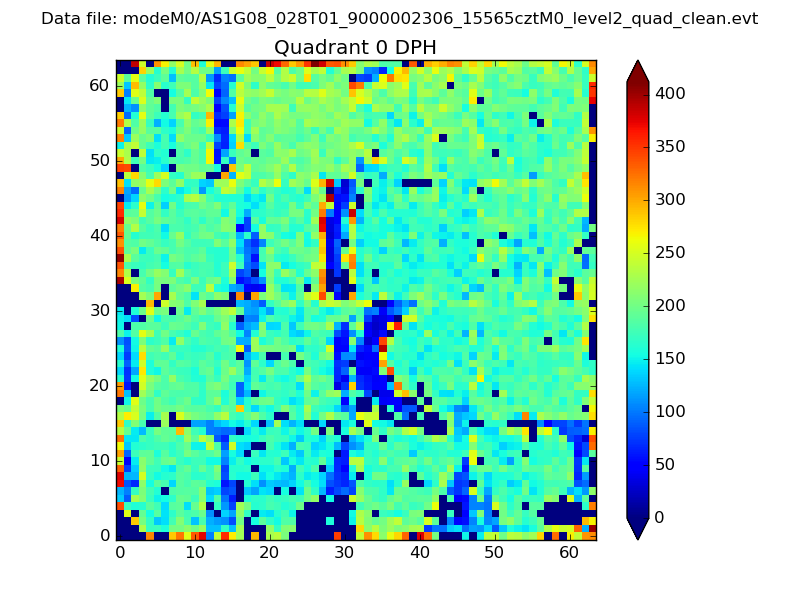 |
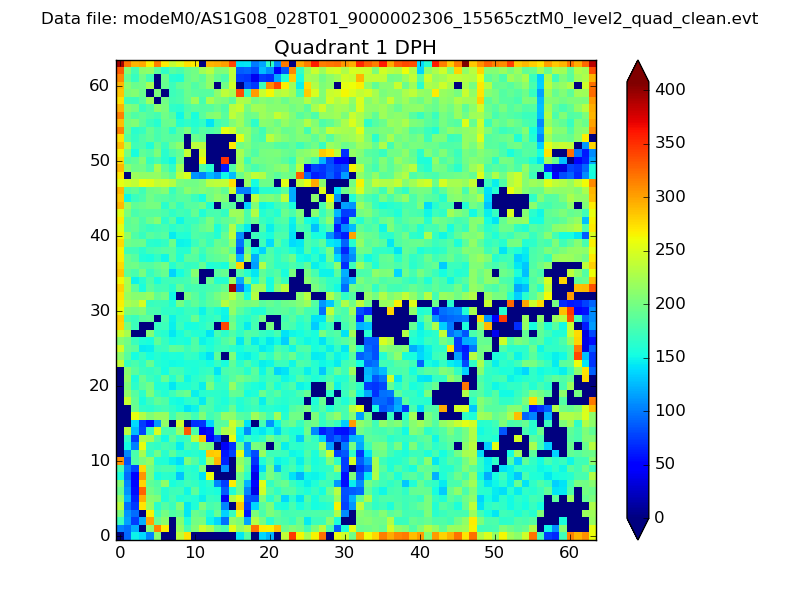 |
Quadrant B |
|---|---|---|---|
| Quadrant D | 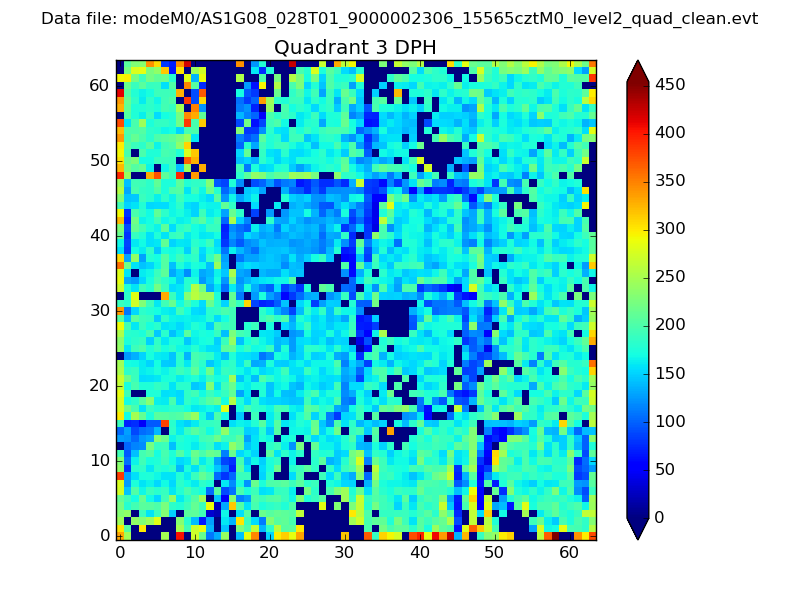 |
 |
Quadrant C |
| Plot type | Count rate plots | Images |
|---|---|---|
| Comparison with Poisson distribution Blue bars denote a histogram of data divided into 1 sec bins. Red curve is a Poisson curve with rate = median count rate of data. |
 |
 |
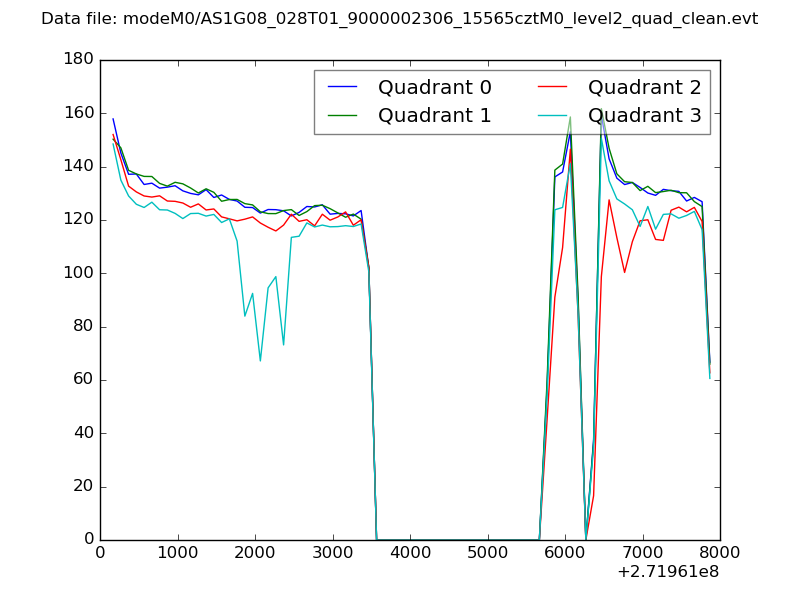
| Quadrant-wise count rates Data is divided into 100 sec bins |
 |
|
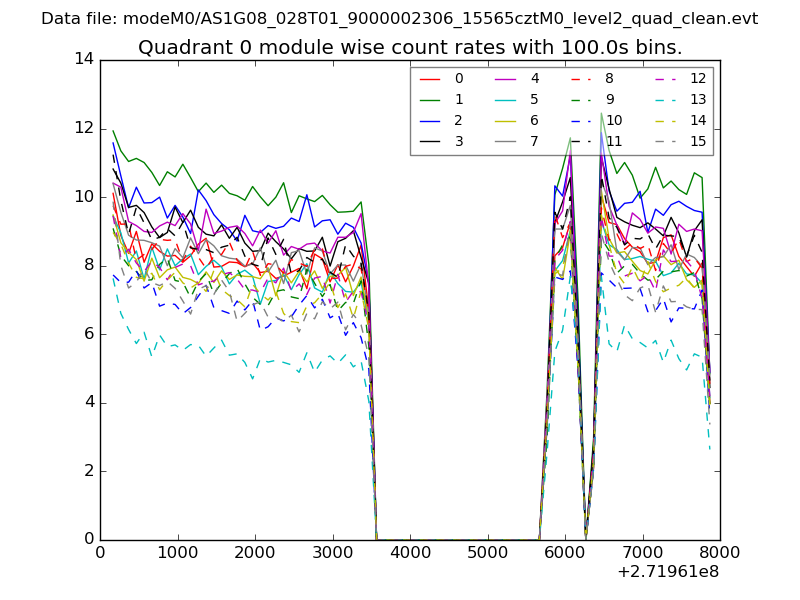
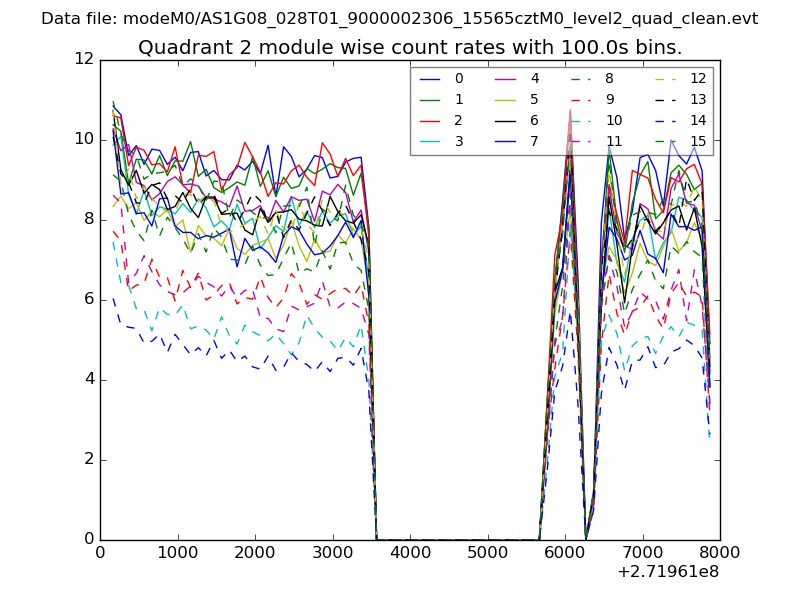
| Module-wise count rates for Quadrant A Data is divided into 100 sec bins |
 |
 |
| Module-wise count rates for Quadrant B Data is divided into 100 sec bins |
 |
 |
| Module-wise count rates for Quadrant C Data is divided into 100 sec bins |
 |
 |
| Module-wise count rates for Quadrant D Data is divided into 100 sec bins |
 |
 |
| Parameter | Plot |
|---|---|
| CZT HV Monitor | 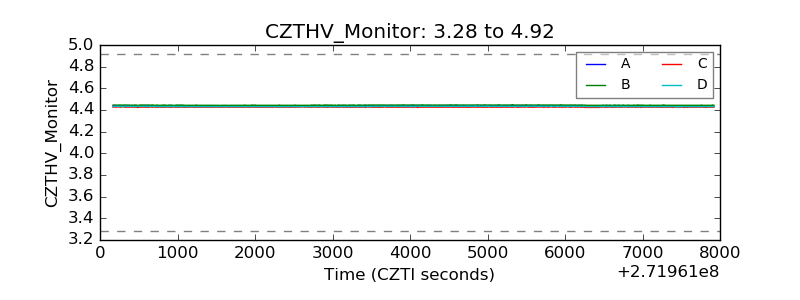 |
| D_VDD |  |
| Temperature 1 | 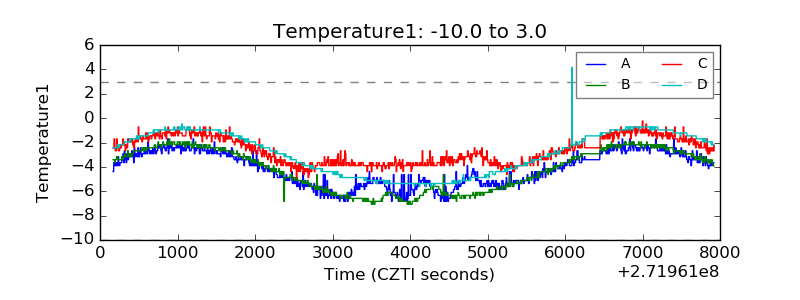 |
| Veto HV Monitor | 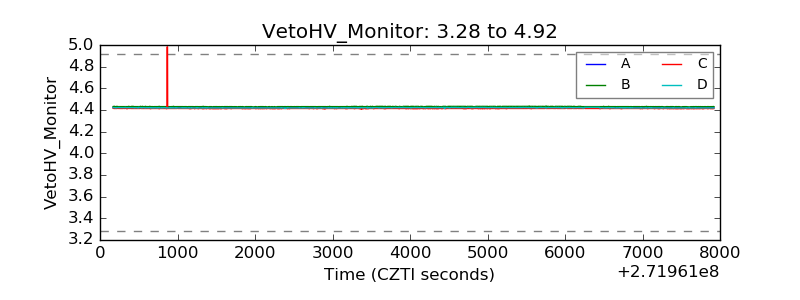 |
| Veto LLD |  |
| Alpha Counter | 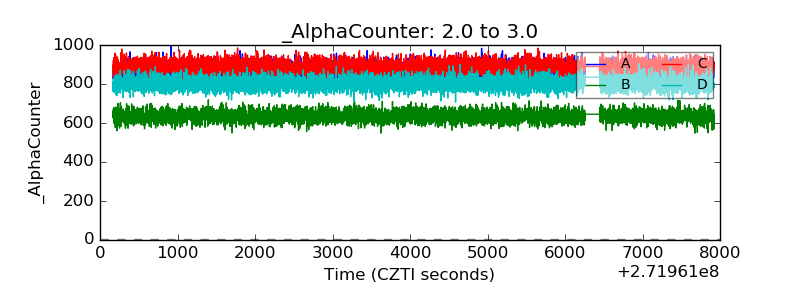 |
| _CPM_Rate | 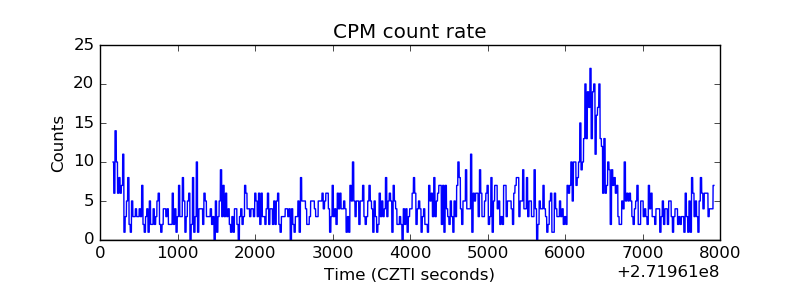 |
| CZT Counter | 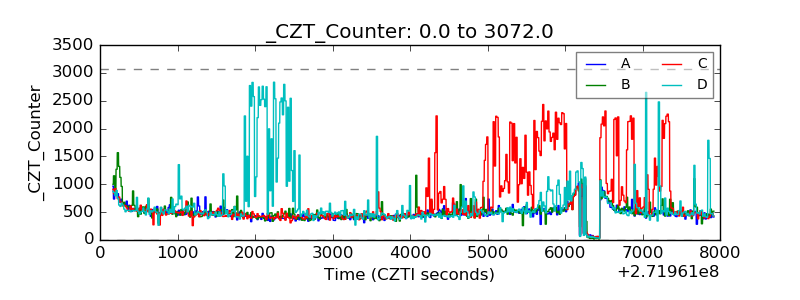 |
| +2.5 Volts monitor |  |
| +5 Volts monitor |  |
| _ROLL_ROT |  |
| _Roll_DEC | 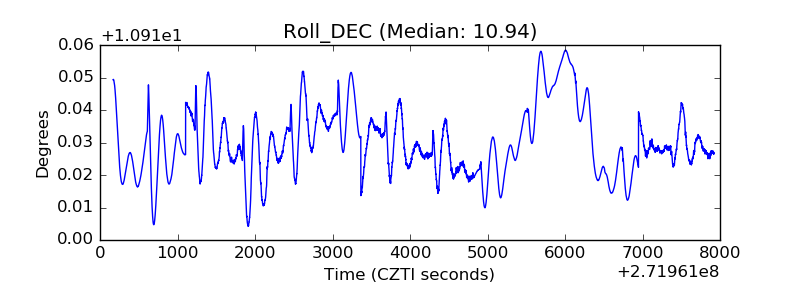 |
| _Roll_RA | 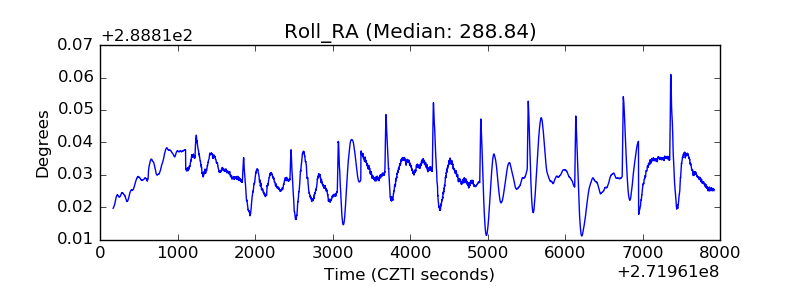 |
| Veto Counter | 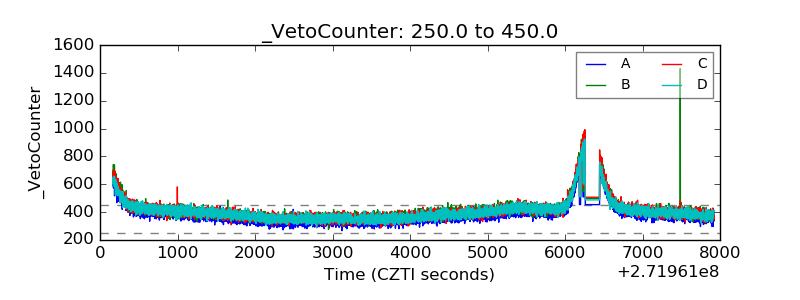 |