| Param | Original file | Final file |
|---|---|---|
| Filename | modeM0/AS1G08_028T01_9000002306_15568cztM0_level2.evt | modeM0/AS1G08_028T01_9000002306_15568cztM0_level2_quad_clean.evt |
| Size (bytes) | 165,744,000 | 37,512,000 |
| Size | 158.1 MB | 35.8 MB |
| Events in quadrant A | 971,784 | 260,549 |
| Events in quadrant B | 1,079,019 | 258,811 |
| Events in quadrant C | 1,645,461 | 230,801 |
| Events in quadrant D | 1,186,278 | 241,330 |
| Mode M9 | |||
|---|---|---|---|
| Quadrant | BADHDUFLAG | Total packets | Discarded packets |
| A | 1 | 273359709408 | 0 |
| B | 1 | -1 | -1 |
| C | 1 | -1 | -1 |
| D | 1 | -1 | -1 |
| Mode M0 | |||
|---|---|---|---|
| Quadrant | BADHDUFLAG | Total packets | Discarded packets |
| A | 0 | 4182 | 1 |
| B | 0 | 4435 | 1 |
| C | 0 | 6226 | 1 |
| D | 0 | 4818 | 1 |
| Mode SS | |||
|---|---|---|---|
| Quadrant | BADHDUFLAG | Total packets | Discarded packets |
| A | 0 | 40 | 0 |
| B | 0 | 40 | 0 |
| C | 0 | 40 | 0 |
| D | 0 | 40 | 0 |
| Quadrant | Total seconds | Saturated seconds | Saturation percentage |
|---|---|---|---|
| A | 1978 | 32 | 1.617796% |
| B | 1978 | 61 | 3.083923% |
| C | 1978 | 323 | 16.329626% |
| D | 1978 | 77 | 3.892821% |
Noise dominated data is calculated using 1-second bins in cleaned event files. If a bin has >2000 counts, and if more than 50% of those come from <1% of pixels, then it is considered to be noise-dominated and hence unusable.
| Quadrant | # 1 sec bins | Bins with >0 counts | Bins with >2000 counts | High rate bins dominated by noise | Noise dominated (total time) | Noise dominated (detector-on time) | Marked lightcurve |
|---|---|---|---|---|---|---|---|
| A | 1979 | 1979 | 0 | 0 | 0.00% | 0.00% | 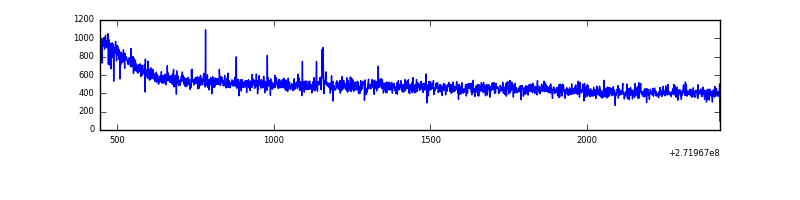 |
| B | 1979 | 1979 | 23 | 23 | 1.16% | 1.16% | 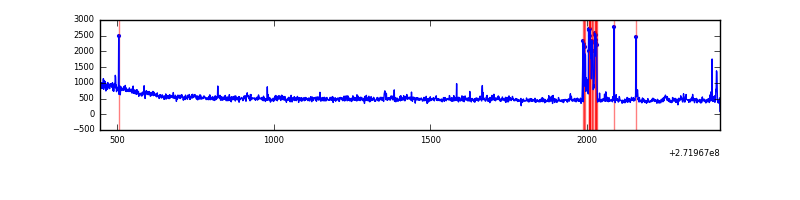 |
| C | 1979 | 1979 | 202 | 202 | 10.21% | 10.21% | 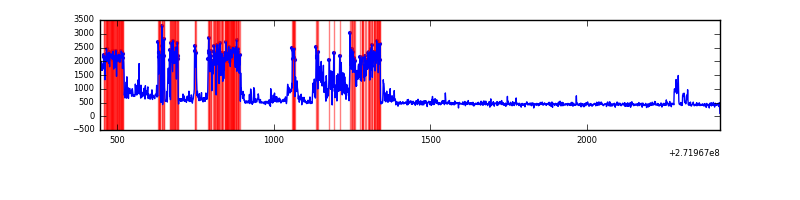 |
| D | 1978 | 1978 | 58 | 58 | 2.93% | 2.93% | 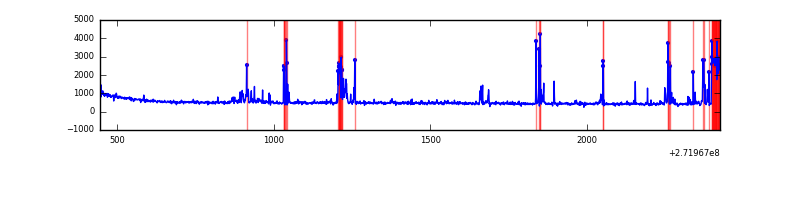 |
Top three noisy pixels from each quadrant. If the there are fewer than three noisy pixels in the level2.evt file, extra rows are filled as -1
| Pixel properties | Quadrant properties | ||||||
|---|---|---|---|---|---|---|---|
| Quadrant | DetID | PixID | Counts | Sigma | Mean | Median | Sigma |
| A | 9 | 143 | 2612 | 44.6 | 251 | 246 | 53.0 |
| A | 0 | 226 | 2305 | 38.81 | 251 | 246 | 53.0 |
| A | 12 | 194 | 1938 | 31.89 | 251 | 246 | 53.0 |
| B | 4 | 142 | 78700 | 1581.34 | 247 | 240 | 49.6 |
| B | 0 | 189 | 7247 | 141.22 | 247 | 240 | 49.6 |
| B | 0 | 197 | 6518 | 126.53 | 247 | 240 | 49.6 |
| C | 3 | 233 | 734300 | 13568.83 | 223 | 224 | 54.1 |
| C | 14 | 238 | 34834 | 639.74 | 223 | 224 | 54.1 |
| C | 14 | 220 | 2437 | 40.91 | 223 | 224 | 54.1 |
| D | 15 | 0 | 85133 | 1388.53 | 243 | 236 | 61.1 |
| D | 1 | 52 | 64633 | 1053.25 | 243 | 236 | 61.1 |
| D | 7 | 38 | 50088 | 815.35 | 243 | 236 | 61.1 |
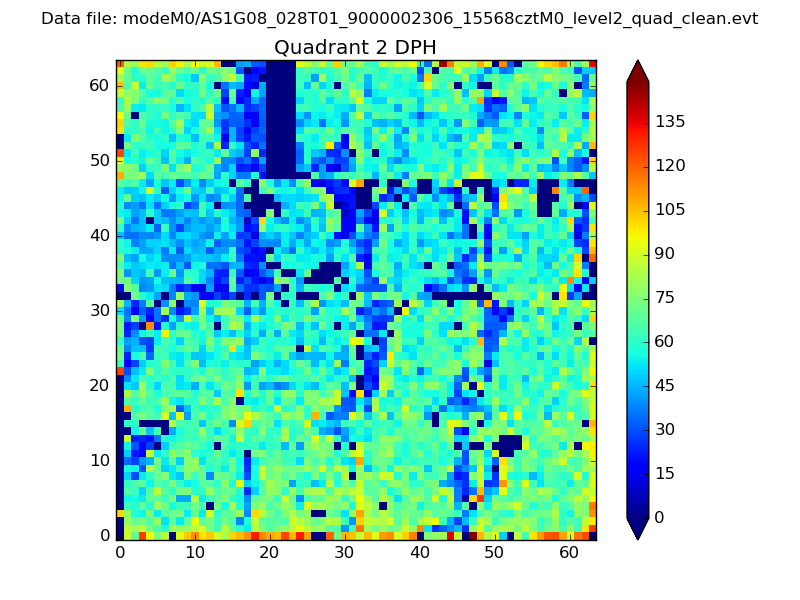
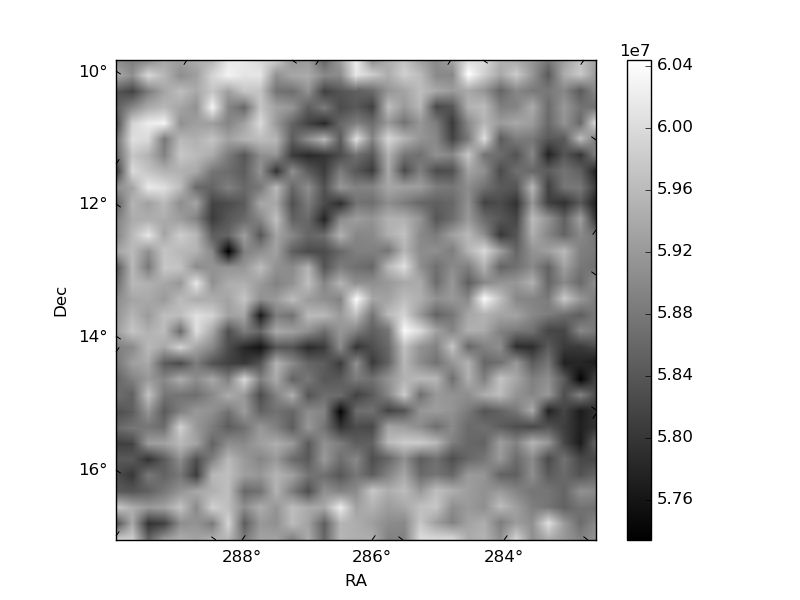
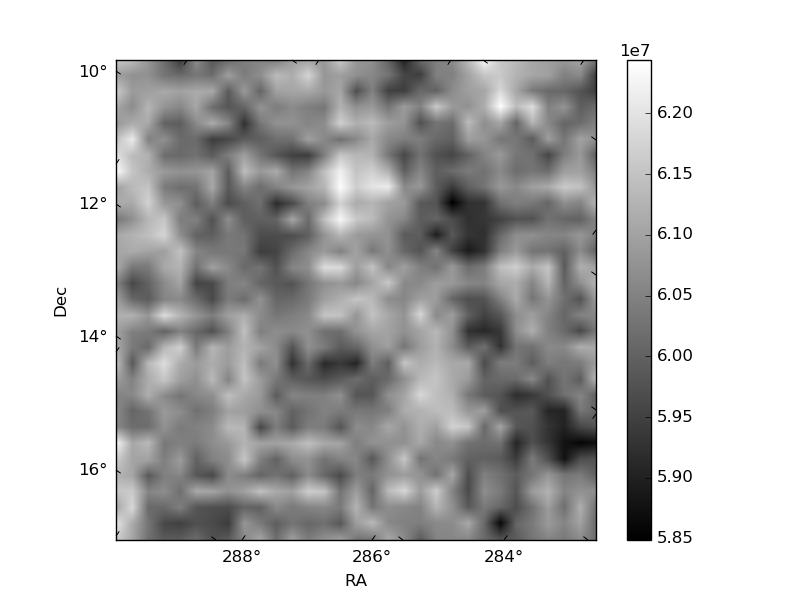
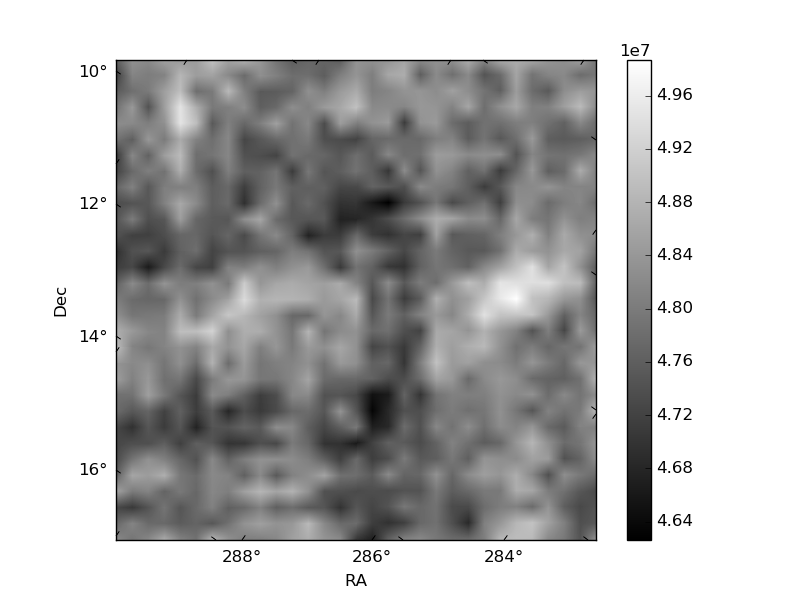
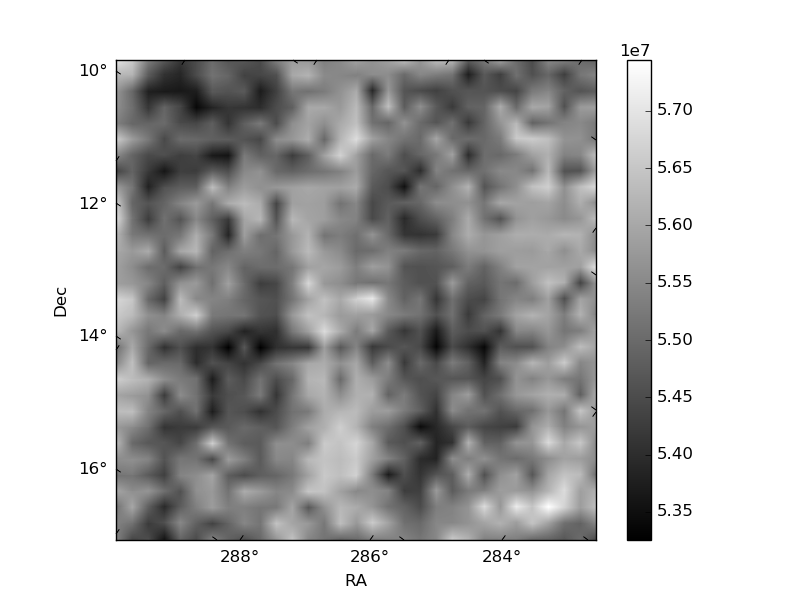
Histogram calculated using DETX and DETY for each event in the final _common_clean file
| Quadrant A | 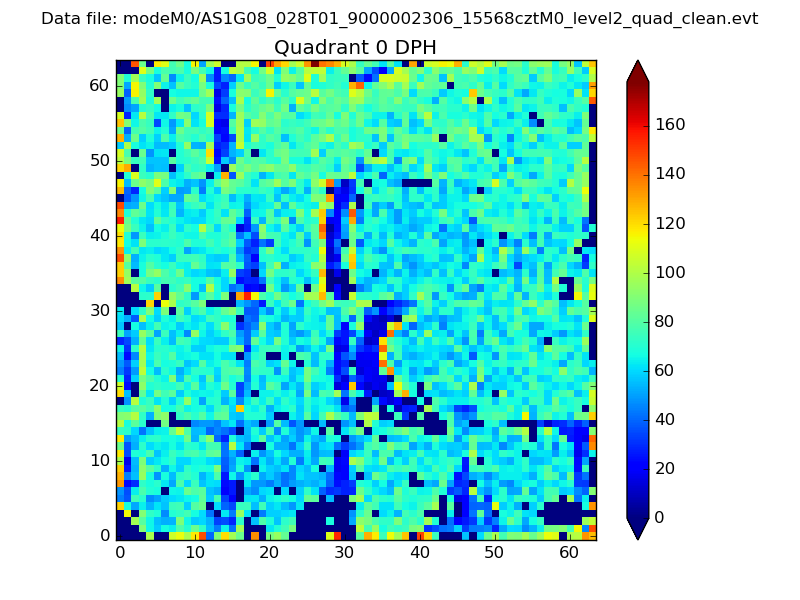 |
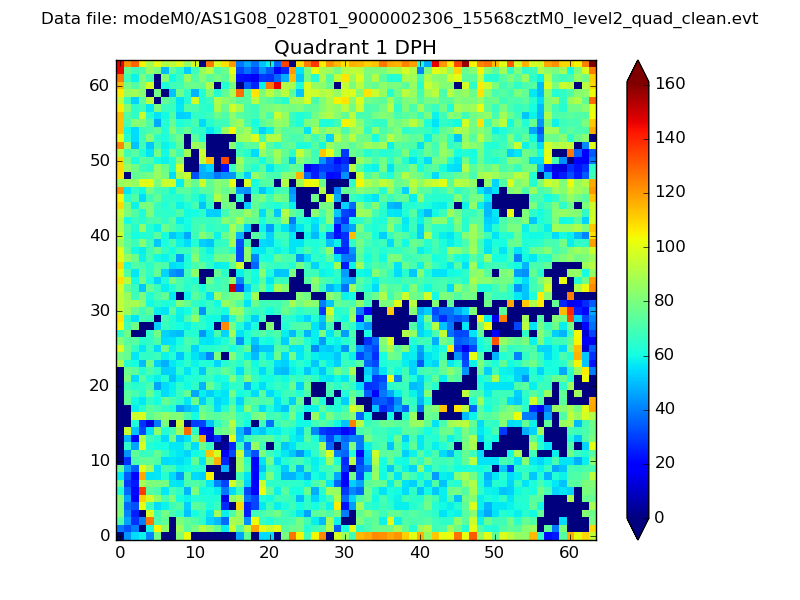 |
Quadrant B |
|---|---|---|---|
| Quadrant D | 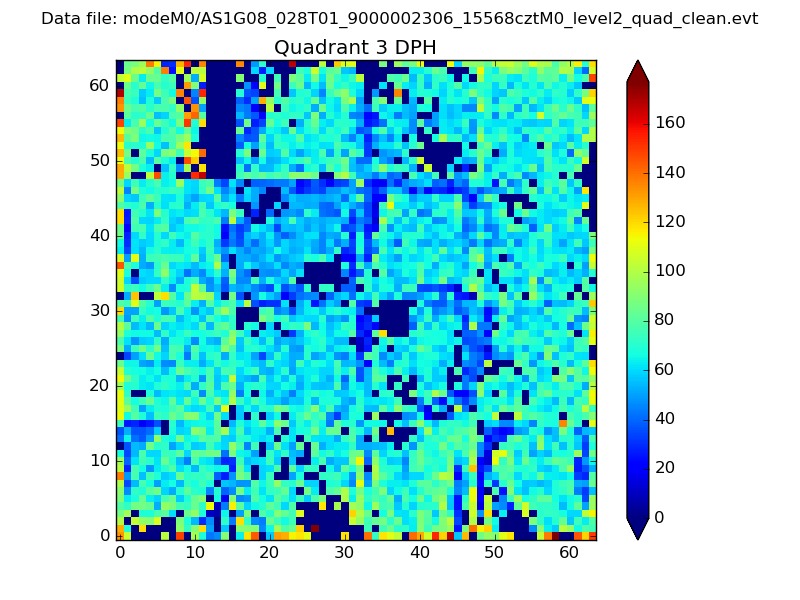 |
 |
Quadrant C |
| Plot type | Count rate plots | Images |
|---|---|---|
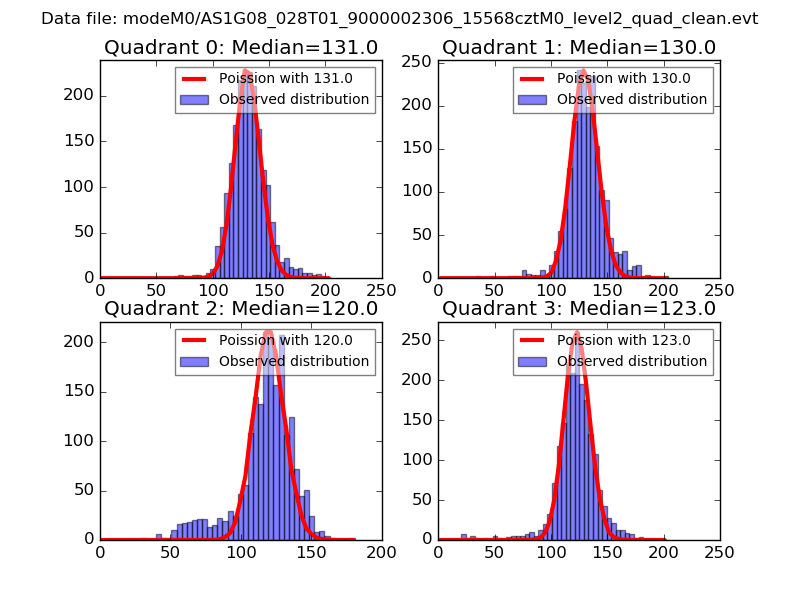
| Comparison with Poisson distribution Blue bars denote a histogram of data divided into 1 sec bins. Red curve is a Poisson curve with rate = median count rate of data. |
 |
 |
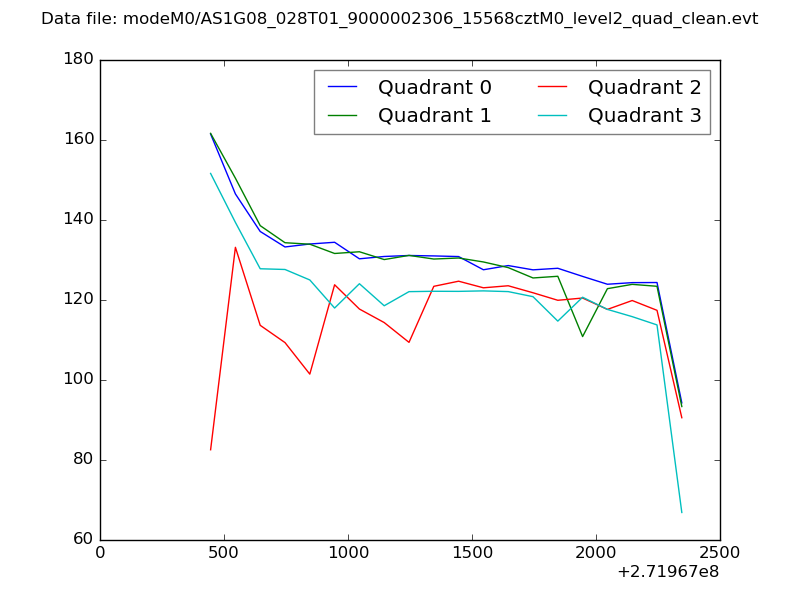
| Quadrant-wise count rates Data is divided into 100 sec bins |
 |
|
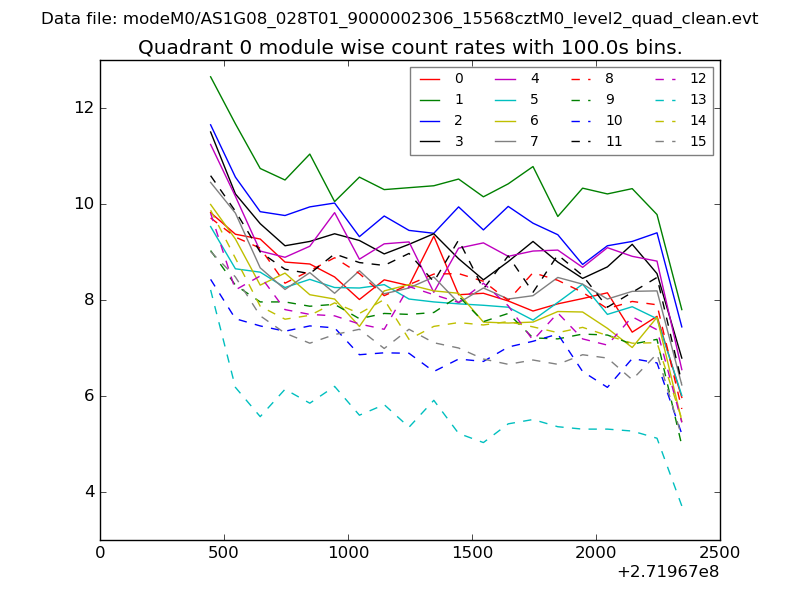
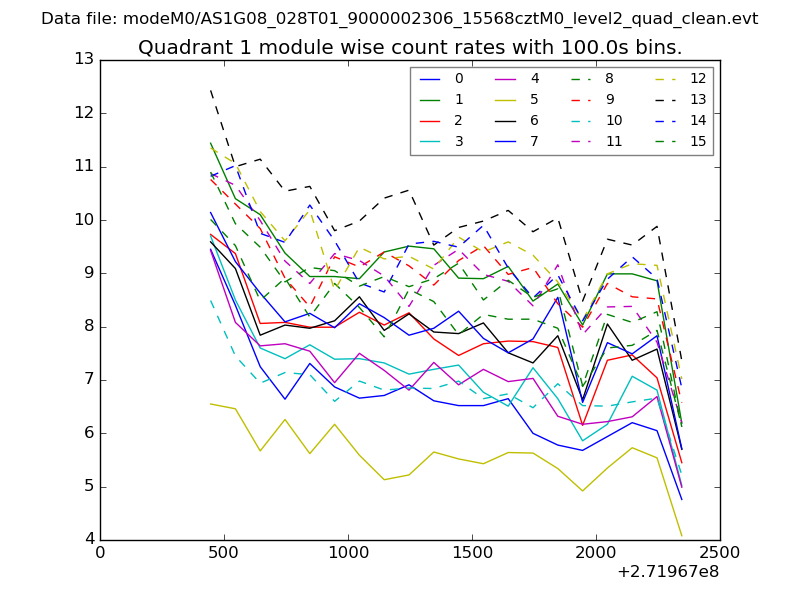
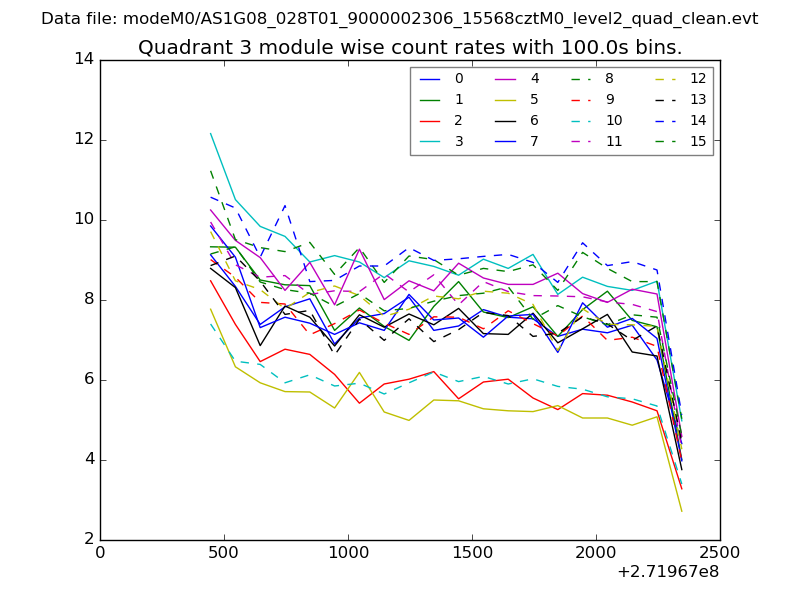
| Module-wise count rates for Quadrant A Data is divided into 100 sec bins |
 |
 |
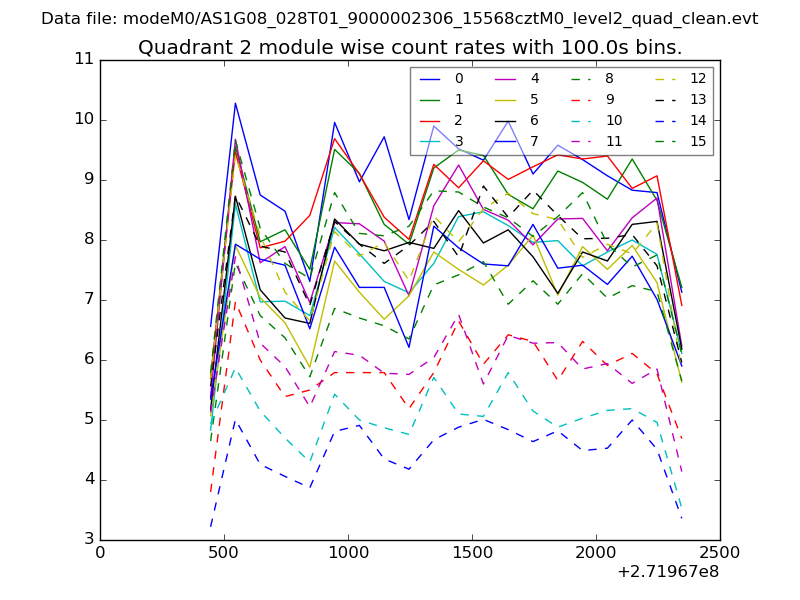
| Module-wise count rates for Quadrant B Data is divided into 100 sec bins |
 |
 |
| Module-wise count rates for Quadrant C Data is divided into 100 sec bins |
 |
 |
| Module-wise count rates for Quadrant D Data is divided into 100 sec bins |
 |
 |
| Parameter | Plot |
|---|---|
| CZT HV Monitor | 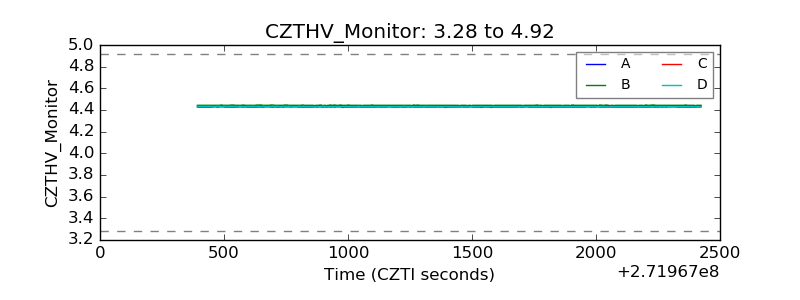 |
| D_VDD | 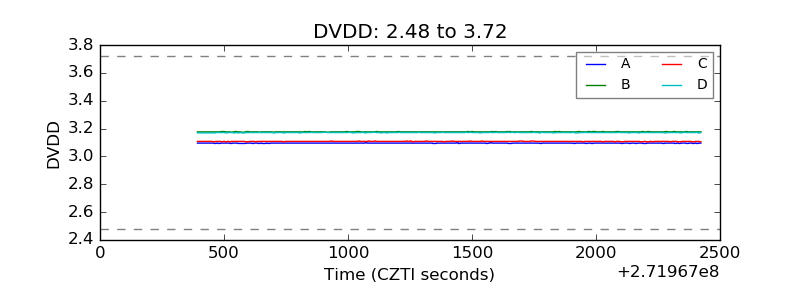 |
| Temperature 1 | 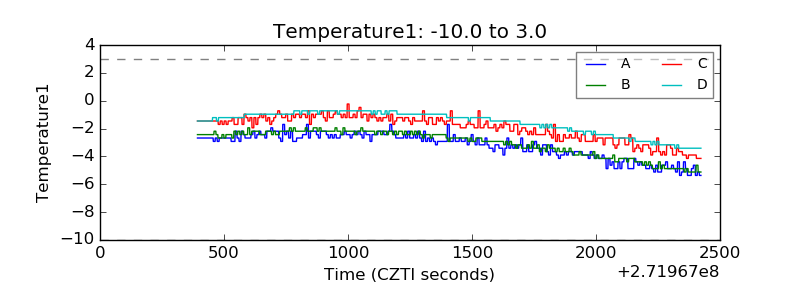 |
| Veto HV Monitor | 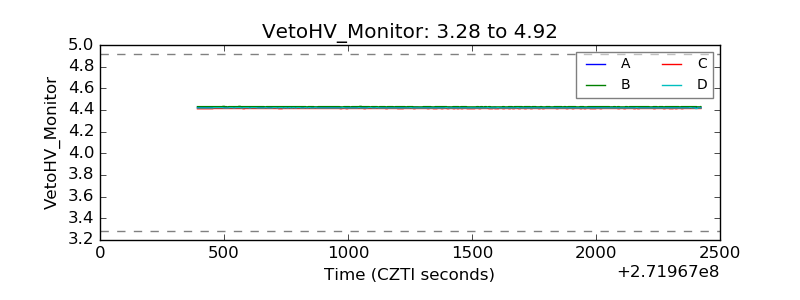 |
| Veto LLD |  |
| Alpha Counter | 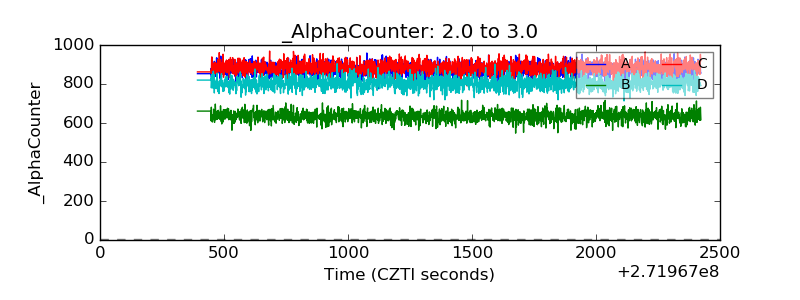 |
| _CPM_Rate | 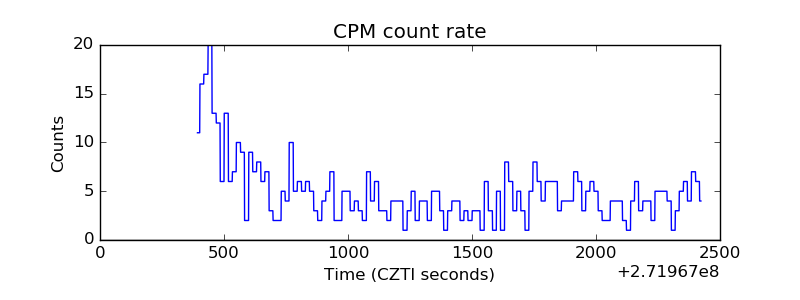 |
| CZT Counter | 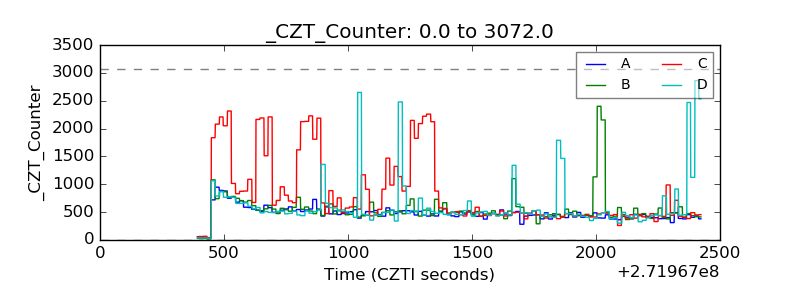 |
| +2.5 Volts monitor |  |
| +5 Volts monitor |  |
| _ROLL_ROT | 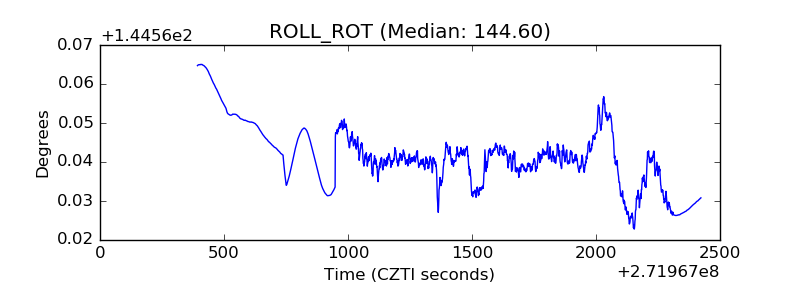 |
| _Roll_DEC | 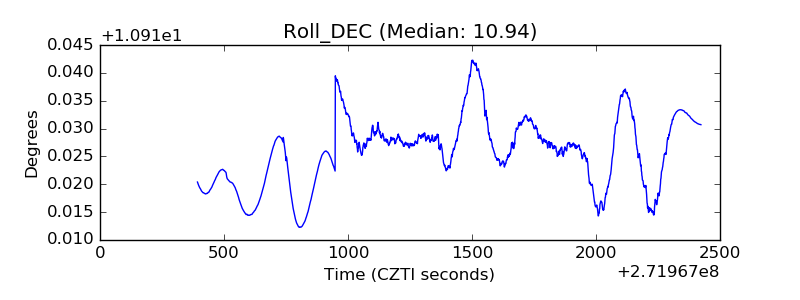 |
| _Roll_RA | 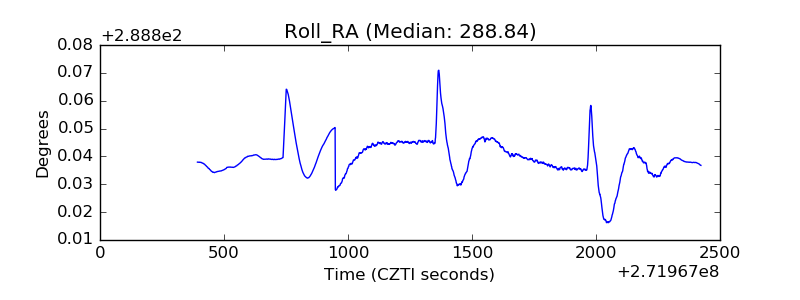 |
| Veto Counter | 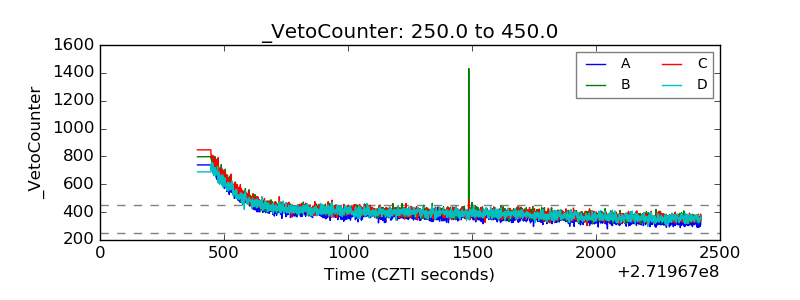 |