| Param | Original file | Final file |
|---|---|---|
| Filename | modeM0/AS1T02_083T01_9000002304cztM0_level2.fits | modeM0/AS1T02_083T01_9000002304cztM0_level2_quad_clean.evt |
| Size (bytes) | 184,835,520 | 127,745,280 |
| Size | 176.3 MB | 121.8 MB |
| Events in quadrant A | 1,181,174 | 706,102 |
| Events in quadrant B | 1,121,282 | 701,939 |
| Events in quadrant C | 1,155,020 | 680,471 |
| Events in quadrant D | 991,392 | 629,992 |
| Mode M9 | |||
|---|---|---|---|
| Quadrant | BADHDUFLAG | Total packets | Discarded packets |
| A | 0 | 51 | 0 |
| B | 0 | 51 | 0 |
| C | 0 | 51 | 0 |
| D | 0 | 51 | 0 |
| Mode SS | |||
|---|---|---|---|
| Quadrant | BADHDUFLAG | Total packets | Discarded packets |
| A | 0 | 342 | 0 |
| B | 0 | 342 | 0 |
| C | 0 | 342 | 0 |
| D | 0 | 342 | 0 |
| Mode M0 | |||
|---|---|---|---|
| Quadrant | BADHDUFLAG | Total packets | Discarded packets |
| A | 0 | 35979 | 0 |
| B | 0 | 37371 | 0 |
| C | 0 | 37201 | 0 |
| D | 0 | 41467 | 0 |
| Quadrant | Total seconds | Saturated seconds | Saturation percentage |
|---|---|---|---|
| A | 16658 | 291 | 1.746908% |
| B | 16658 | 344 | 2.065074% |
| C | 16658 | 476 | 2.857486% |
| D | 16658 | 935 | 5.612919% |
Noise dominated data is calculated using 1-second bins in cleaned event files. If a bin has >2000 counts, and if more than 50% of those come from <1% of pixels, then it is considered to be noise-dominated and hence unusable.
| Quadrant | # 1 sec bins | Bins with >0 counts | Bins with >2000 counts | High rate bins dominated by noise | Noise dominated (total time) | Noise dominated (detector-on time) | Marked lightcurve |
|---|---|---|---|---|---|---|---|
| A | 21798 | 16655 | 0 | 0 | 0.00% | 0.00% | 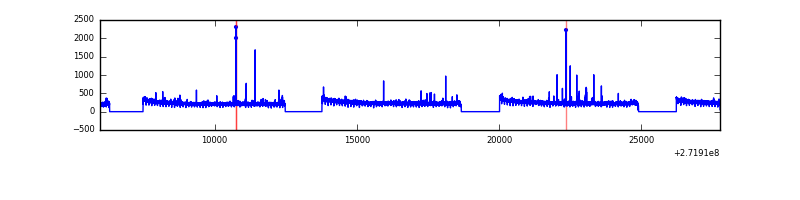 |
| B | 21798 | 16654 | 0 | 0 | 0.00% | 0.00% | 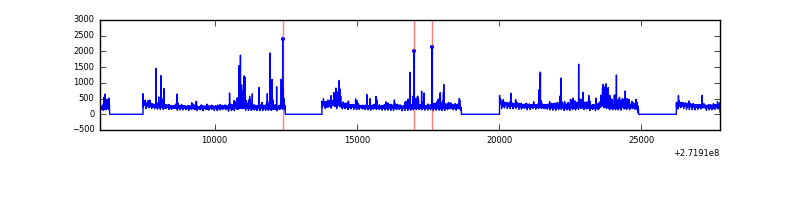 |
| C | 21798 | 16654 | 0 | 0 | 0.00% | 0.00% | 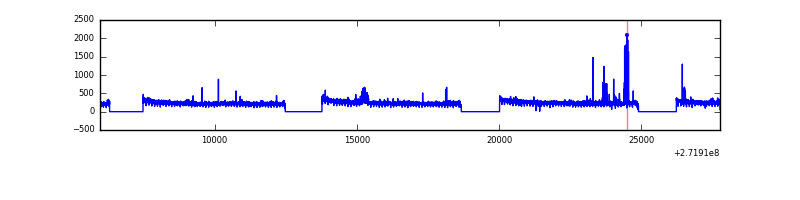 |
| D | 21798 | 16640 | 0 | 0 | 0.00% | 0.00% | 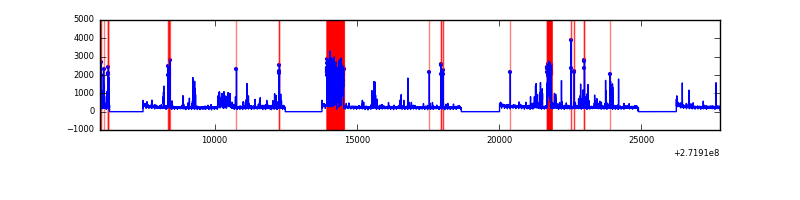 |
Top three noisy pixels from each quadrant. If the there are fewer than three noisy pixels in the level2.evt file, extra rows are filled as -1
| Pixel properties | Quadrant properties | ||||||
|---|---|---|---|---|---|---|---|
| Quadrant | DetID | PixID | Counts | Sigma | Mean | Median | Sigma |
| A | 0 | 29 | 1048 | 9.99 | 309 | 293 | 75.5 |
| A | 7 | 110 | 884 | 7.82 | 309 | 293 | 75.5 |
| A | 0 | 30 | 850 | 7.37 | 309 | 293 | 75.5 |
| B | 2 | 9 | 930 | 10.57 | 298 | 287 | 60.8 |
| B | 5 | 128 | 761 | 7.79 | 298 | 287 | 60.8 |
| B | 2 | 8 | 715 | 7.04 | 298 | 287 | 60.8 |
| C | 1 | 81 | 848 | 7.2 | 305 | 289 | 77.6 |
| C | 1 | 80 | 817 | 6.8 | 305 | 289 | 77.6 |
| C | 9 | 188 | 799 | 6.57 | 305 | 289 | 77.6 |
| D | 10 | 189 | 742 | 6.53 | 282 | 259 | 74.0 |
| D | 6 | 231 | 717 | 6.19 | 282 | 259 | 74.0 |
| D | 6 | 38 | 702 | 5.99 | 282 | 259 | 74.0 |
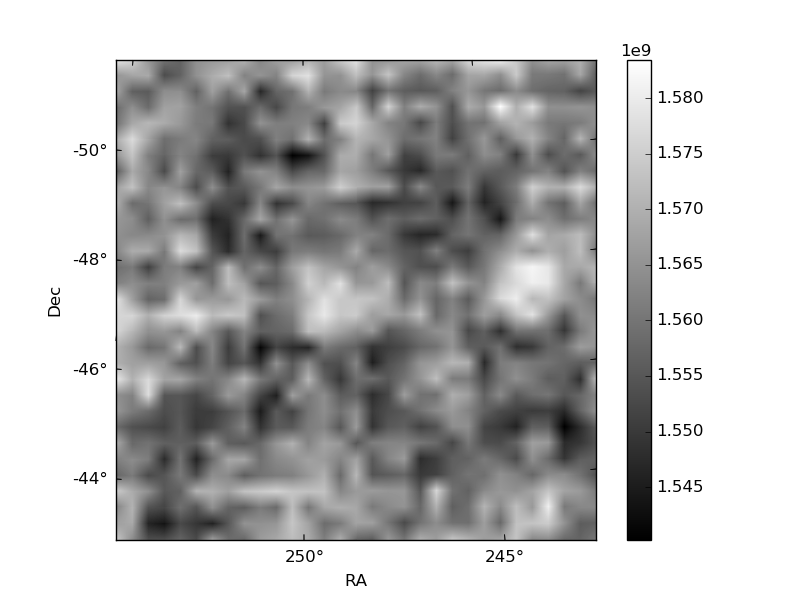
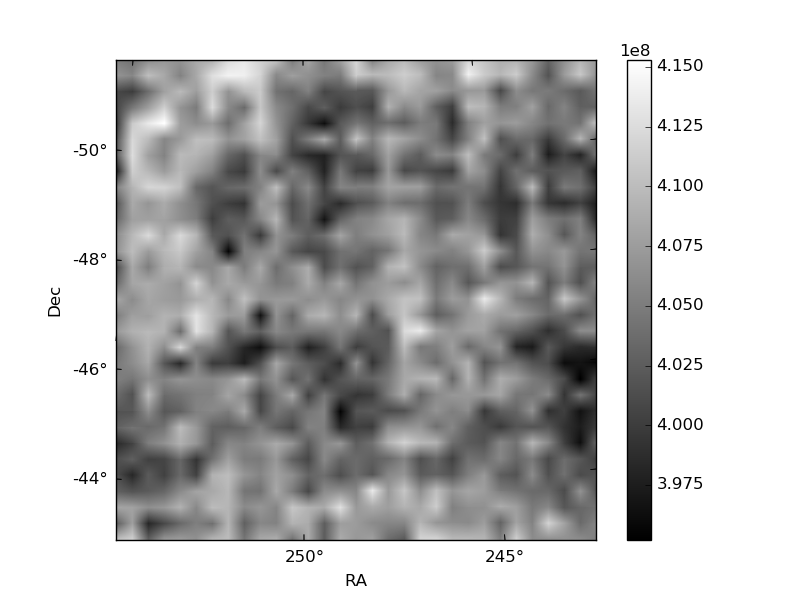
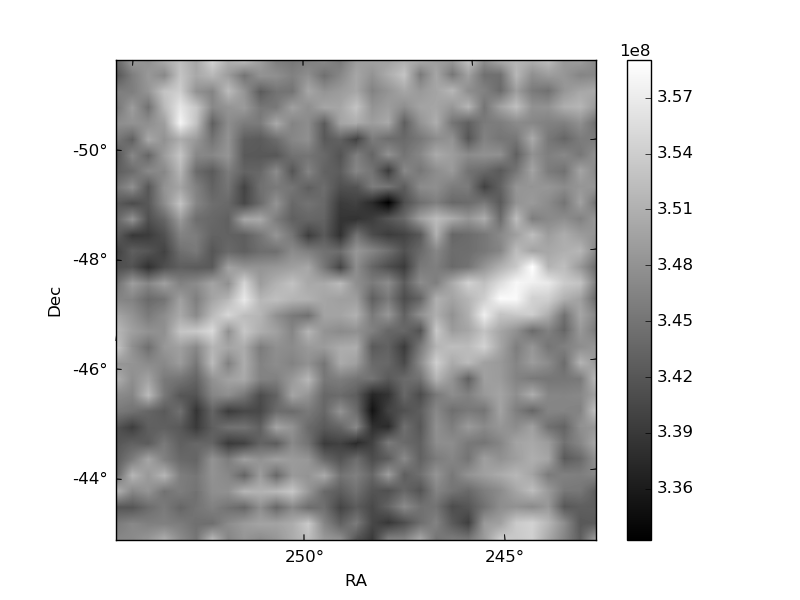
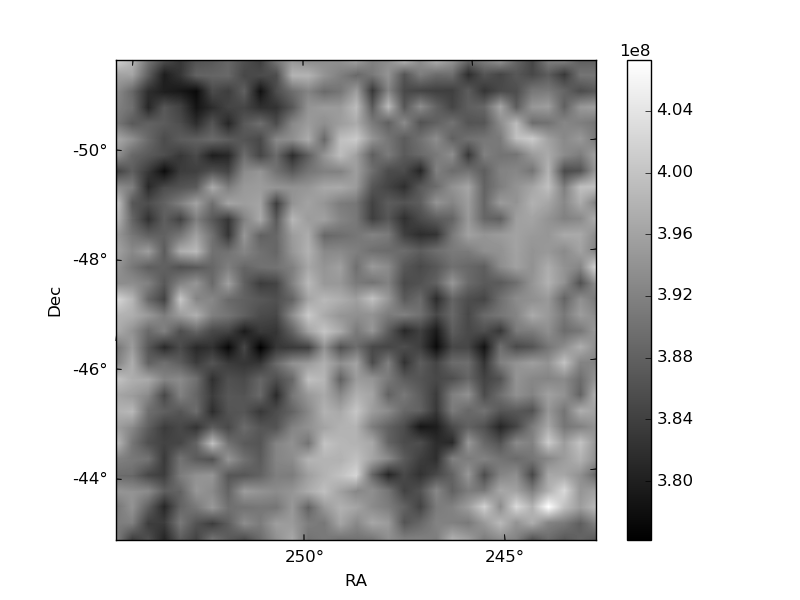
Histogram calculated using DETX and DETY for each event in the final _common_clean file
| Quadrant A | 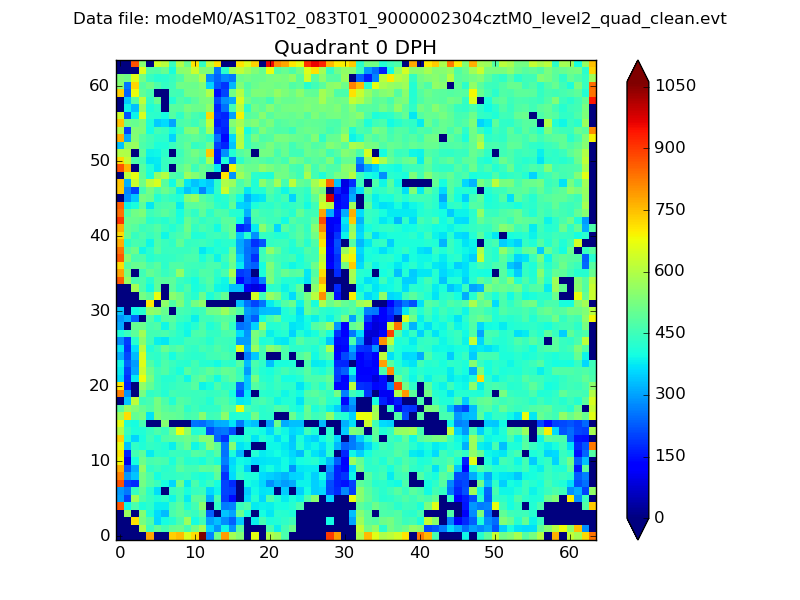 |
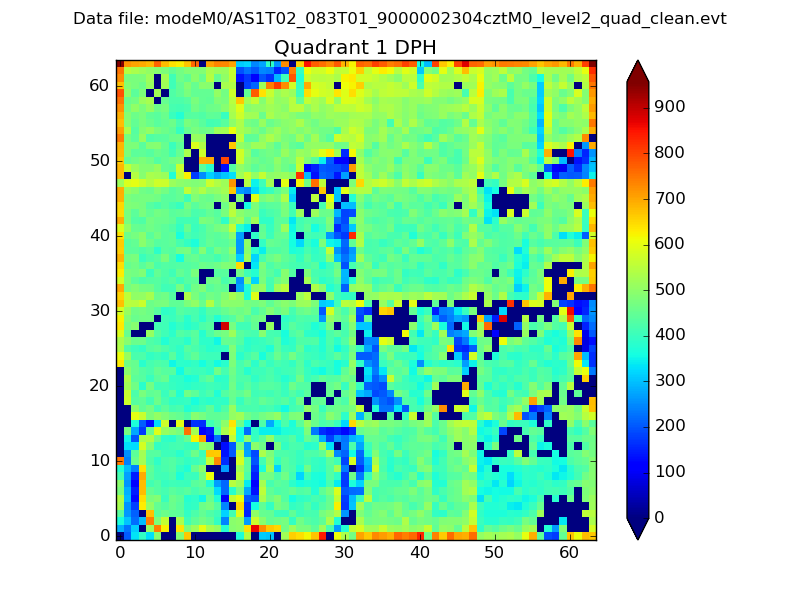 |
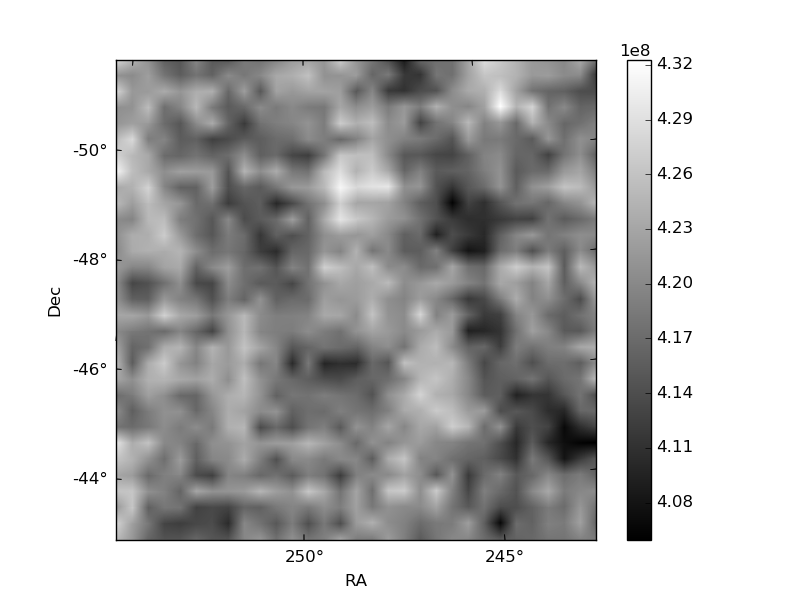
Quadrant B |
|---|---|---|---|
| Quadrant D | 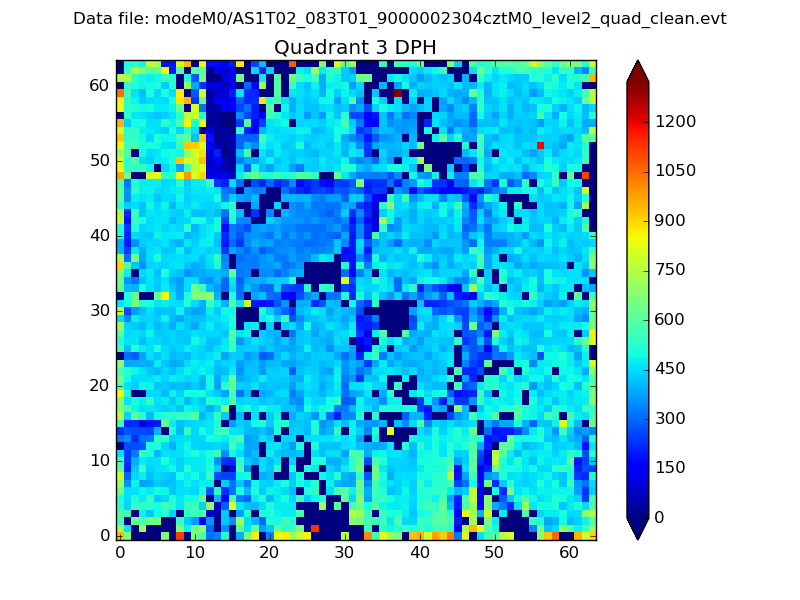 |
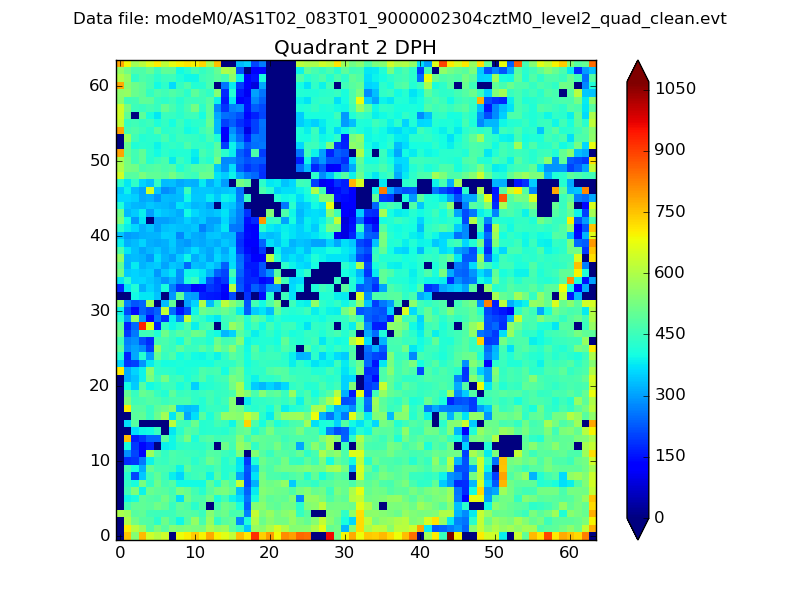 |
Quadrant C |
| Plot type | Count rate plots | Images |
|---|---|---|
| Comparison with Poisson distribution Blue bars denote a histogram of data divided into 1 sec bins. Red curve is a Poisson curve with rate = median count rate of data. |
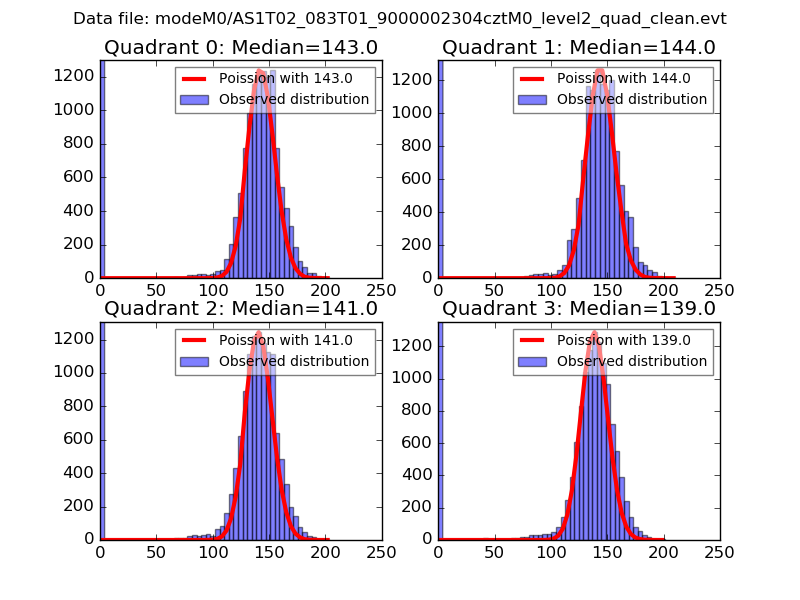 |
 |
| Quadrant-wise count rates Data is divided into 100 sec bins |
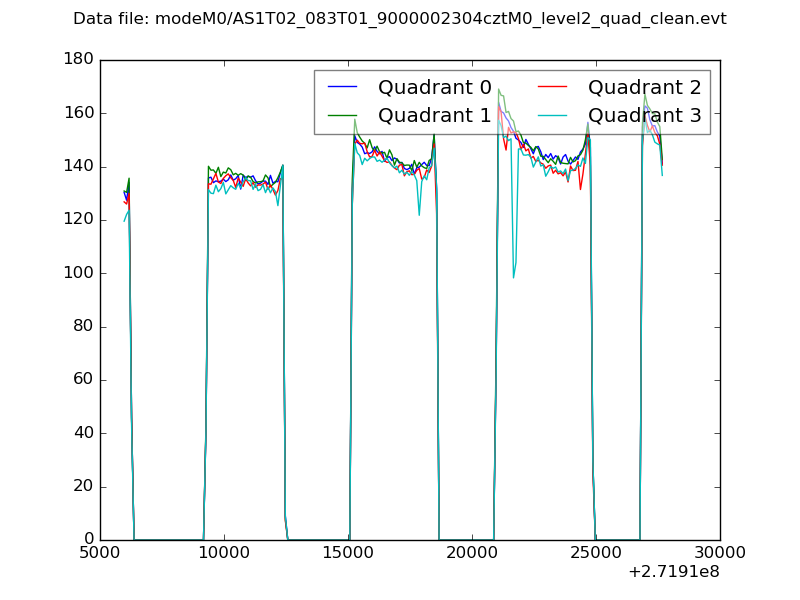 |
|
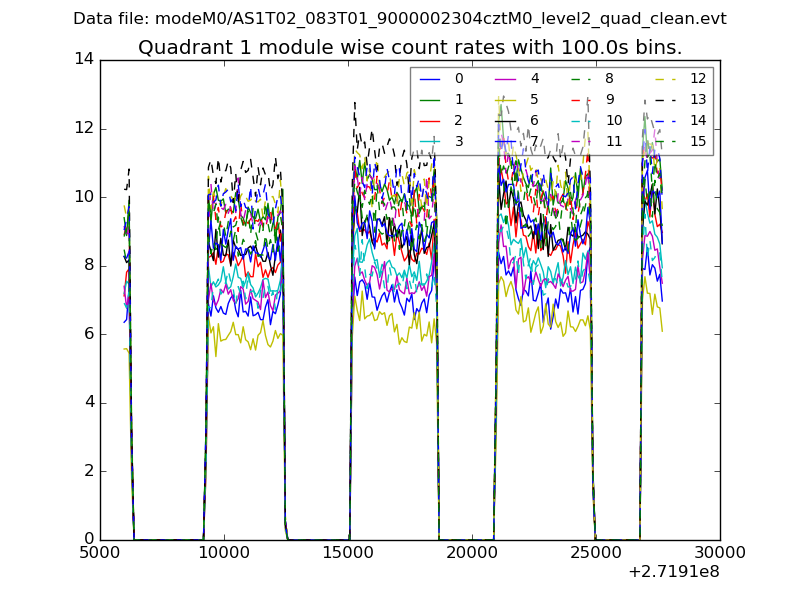
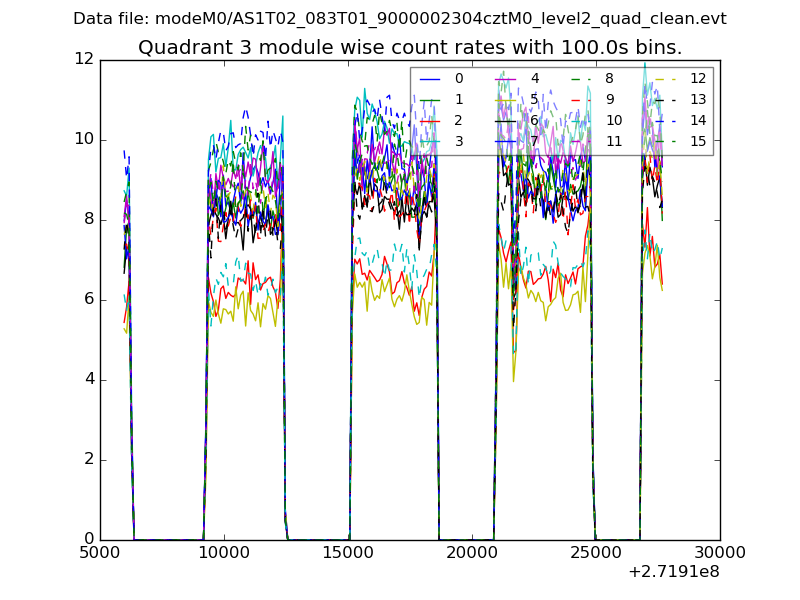
| Module-wise count rates for Quadrant A Data is divided into 100 sec bins |
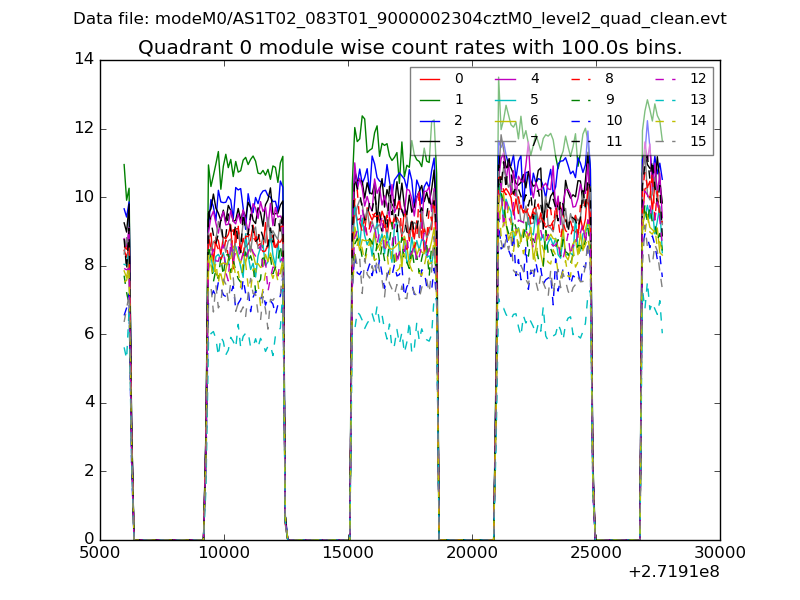 |
 |
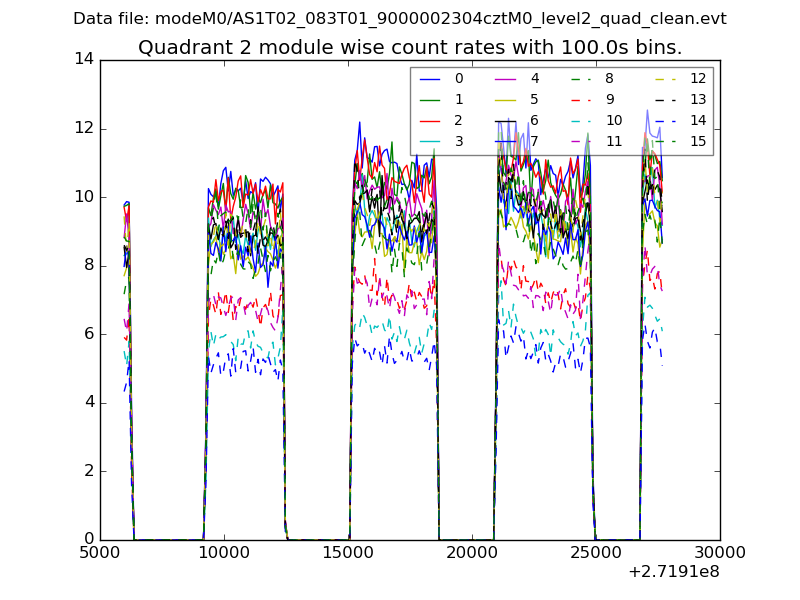
| Module-wise count rates for Quadrant B Data is divided into 100 sec bins |
 |
 |
| Module-wise count rates for Quadrant C Data is divided into 100 sec bins |
 |
 |
| Module-wise count rates for Quadrant D Data is divided into 100 sec bins |
 |
 |
| Parameter | Plot |
|---|---|
| CZT HV Monitor | 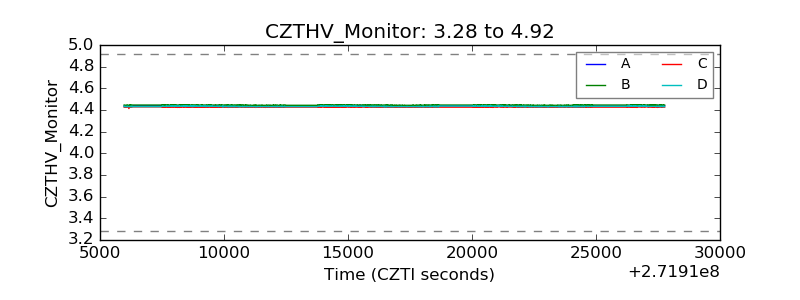 |
| D_VDD | 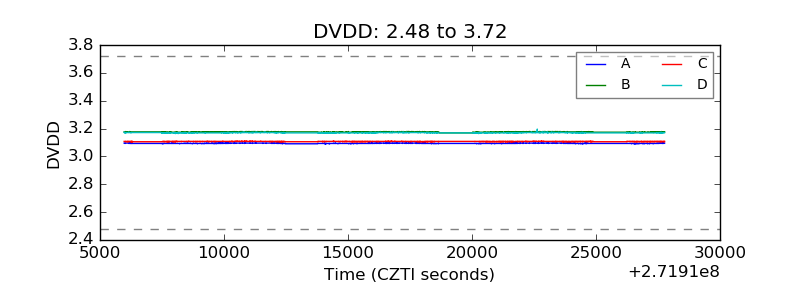 |
| Temperature 1 | 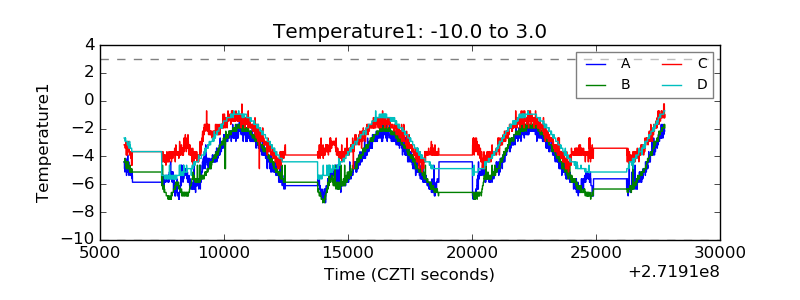 |
| Veto HV Monitor | 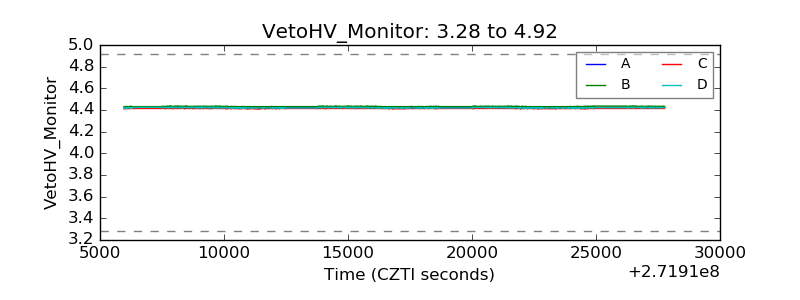 |
| Veto LLD | 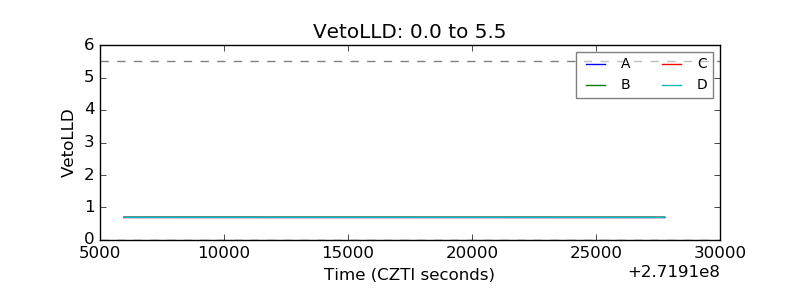 |
| Alpha Counter | 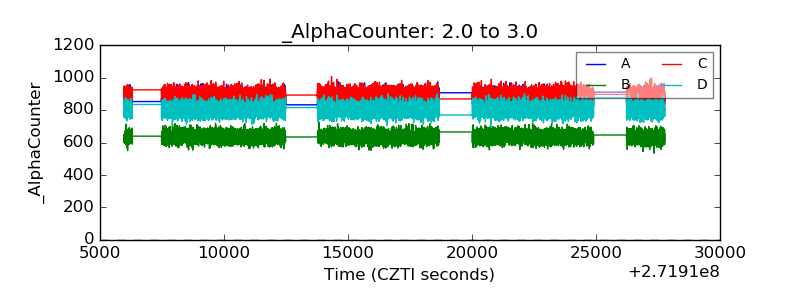 |
| _CPM_Rate | 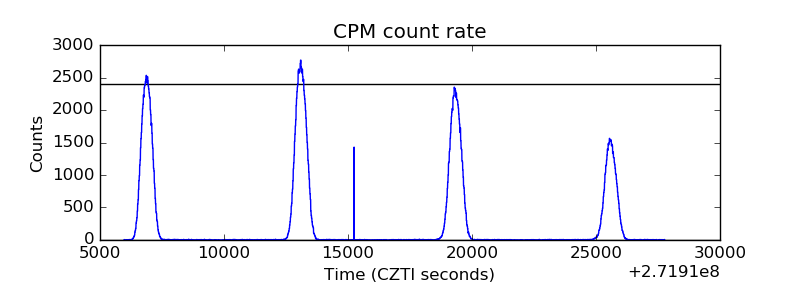 |
| CZT Counter | 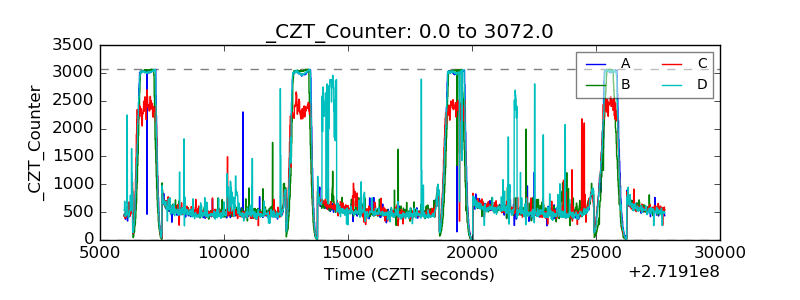 |
| +2.5 Volts monitor | 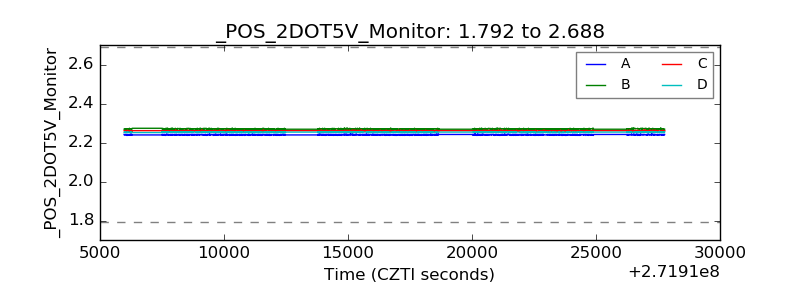 |
| +5 Volts monitor | 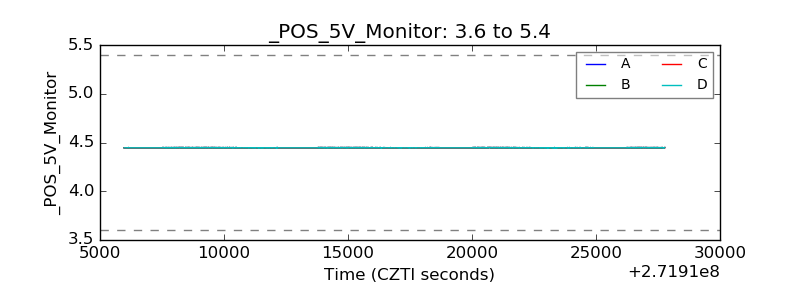 |
| _ROLL_ROT | 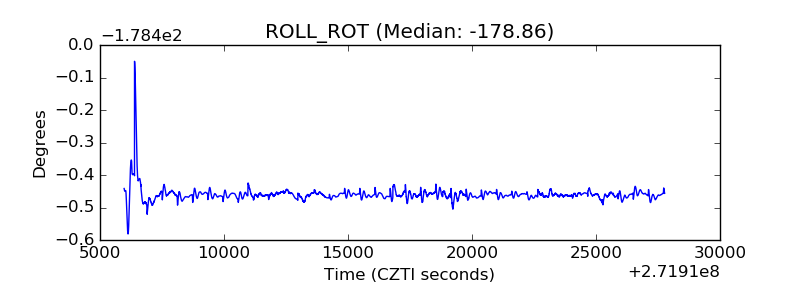 |
| _Roll_DEC | 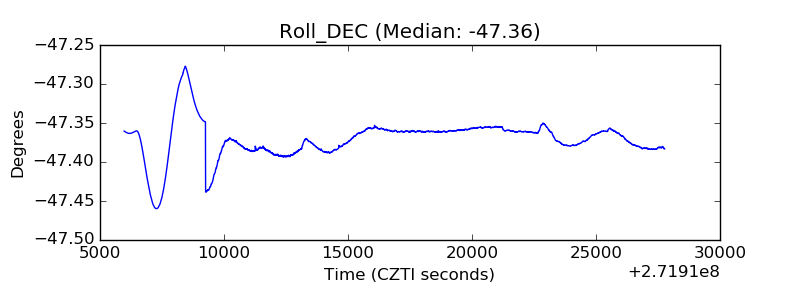 |
| _Roll_RA | 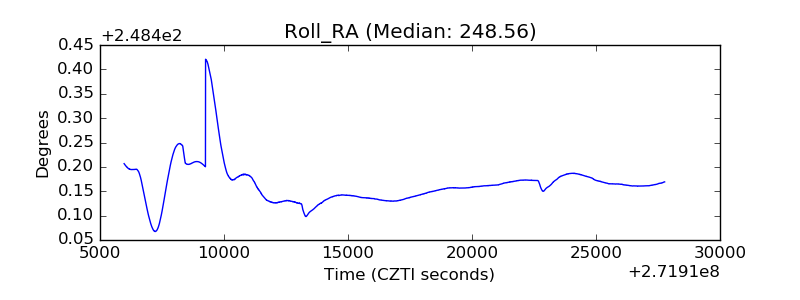 |
| Veto Counter | 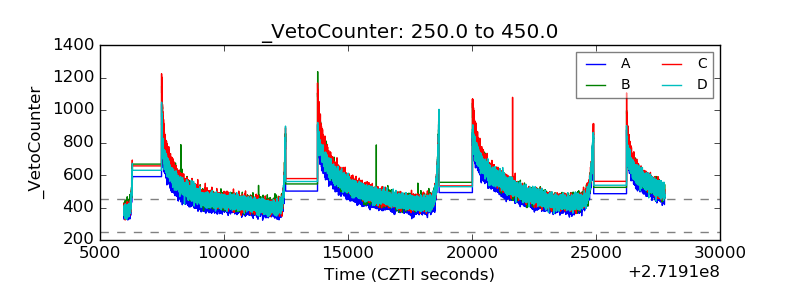 |