| Param | Original file | Final file |
|---|---|---|
| Filename | modeM0/AS1T02_083T01_9000002304_15557cztM0_level2.evt | modeM0/AS1T02_083T01_9000002304_15557cztM0_level2_quad_clean.evt |
| Size (bytes) | 140,569,920 | 10,105,920 |
| Size | 134.1 MB | 9.6 MB |
| Events in quadrant A | 970,546 | 44,151 |
| Events in quadrant B | 1,030,502 | 44,615 |
| Events in quadrant C | 1,015,795 | 43,063 |
| Events in quadrant D | 1,114,971 | 41,098 |
| Mode M9 | |||
|---|---|---|---|
| Quadrant | BADHDUFLAG | Total packets | Discarded packets |
| A | 0 | 11 | 0 |
| B | 0 | 11 | 0 |
| C | 0 | 11 | 0 |
| D | 0 | 11 | 0 |
| Mode SS | |||
|---|---|---|---|
| Quadrant | BADHDUFLAG | Total packets | Discarded packets |
| A | 0 | 40 | 0 |
| B | 0 | 40 | 0 |
| C | 0 | 40 | 0 |
| D | 0 | 40 | 0 |
| Mode M0 | |||
|---|---|---|---|
| Quadrant | BADHDUFLAG | Total packets | Discarded packets |
| A | 0 | 3949 | 2 |
| B | 0 | 4182 | 1 |
| C | 0 | 4113 | 1 |
| D | 0 | 4423 | 1 |
| Quadrant | Total seconds | Saturated seconds | Saturation percentage |
|---|---|---|---|
| A | 1802 | 30 | 1.664817% |
| B | 1802 | 50 | 2.774695% |
| C | 1802 | 59 | 3.274140% |
| D | 1802 | 71 | 3.940067% |
Noise dominated data is calculated using 1-second bins in cleaned event files. If a bin has >2000 counts, and if more than 50% of those come from <1% of pixels, then it is considered to be noise-dominated and hence unusable.
| Quadrant | # 1 sec bins | Bins with >0 counts | Bins with >2000 counts | High rate bins dominated by noise | Noise dominated (total time) | Noise dominated (detector-on time) | Marked lightcurve |
|---|---|---|---|---|---|---|---|
| A | 2978 | 1804 | 0 | 0 | 0.00% | 0.00% | 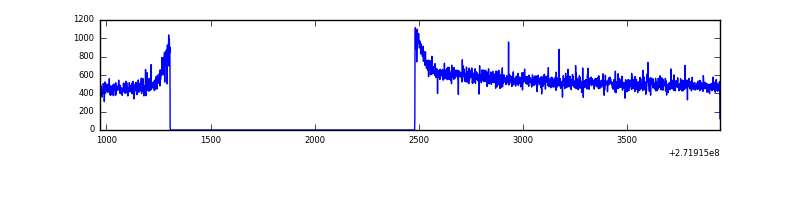 |
| B | 2978 | 1803 | 5 | 5 | 0.17% | 0.28% | 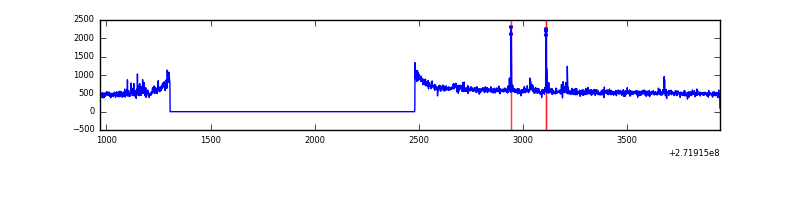 |
| C | 2978 | 1803 | 0 | 0 | 0.00% | 0.00% |  |
| D | 2978 | 1804 | 31 | 31 | 1.04% | 1.72% | 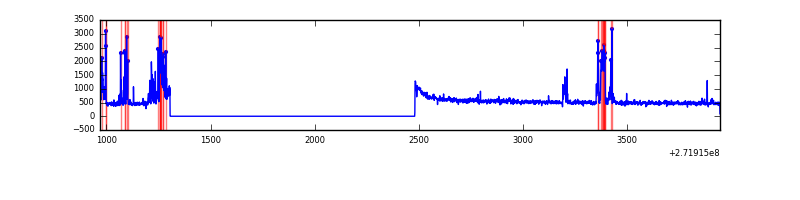 |
Top three noisy pixels from each quadrant. If the there are fewer than three noisy pixels in the level2.evt file, extra rows are filled as -1
| Pixel properties | Quadrant properties | ||||||
|---|---|---|---|---|---|---|---|
| Quadrant | DetID | PixID | Counts | Sigma | Mean | Median | Sigma |
| A | 0 | 226 | 2217 | 37.96 | 252 | 247 | 51.9 |
| A | 12 | 194 | 1860 | 31.08 | 252 | 247 | 51.9 |
| A | 3 | 137 | 1589 | 25.86 | 252 | 247 | 51.9 |
| B | 4 | 173 | 12483 | 248.94 | 255 | 249 | 49.1 |
| B | 4 | 48 | 11847 | 235.99 | 255 | 249 | 49.1 |
| B | 0 | 213 | 7828 | 154.22 | 255 | 249 | 49.1 |
| C | 14 | 238 | 39301 | 674.39 | 248 | 249 | 57.9 |
| C | 3 | 233 | 6718 | 111.71 | 248 | 249 | 57.9 |
| C | 13 | 61 | 1828 | 27.27 | 248 | 249 | 57.9 |
| D | 1 | 52 | 169556 | 2594.85 | 243 | 238 | 65.3 |
| D | 2 | 120 | 10252 | 153.47 | 243 | 238 | 65.3 |
| D | 2 | 234 | 5468 | 80.15 | 243 | 238 | 65.3 |
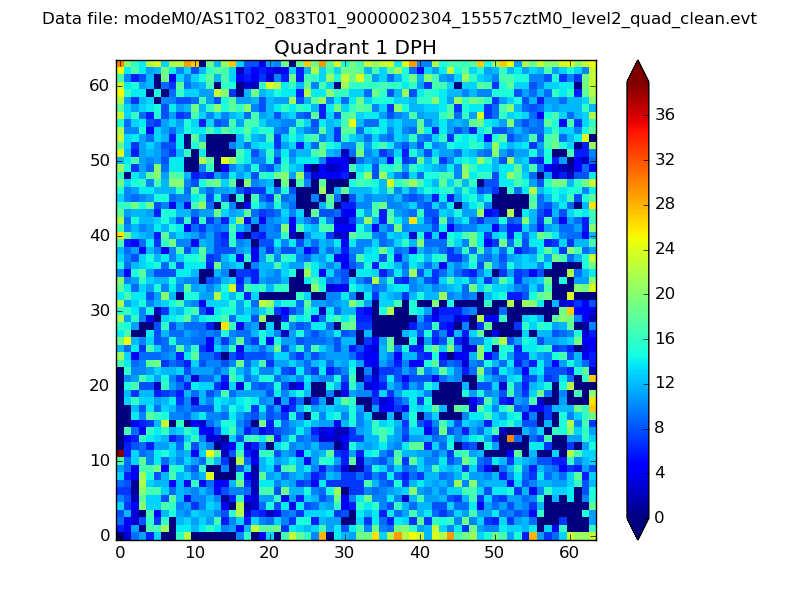
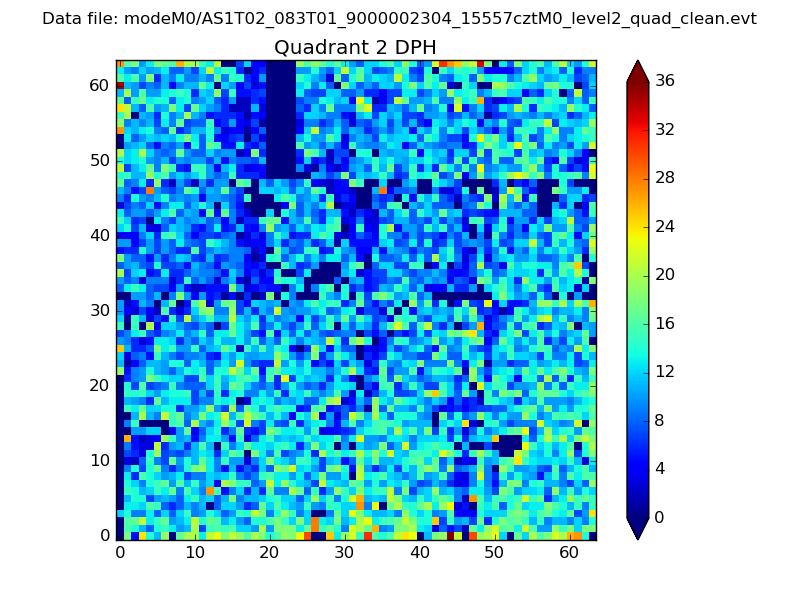
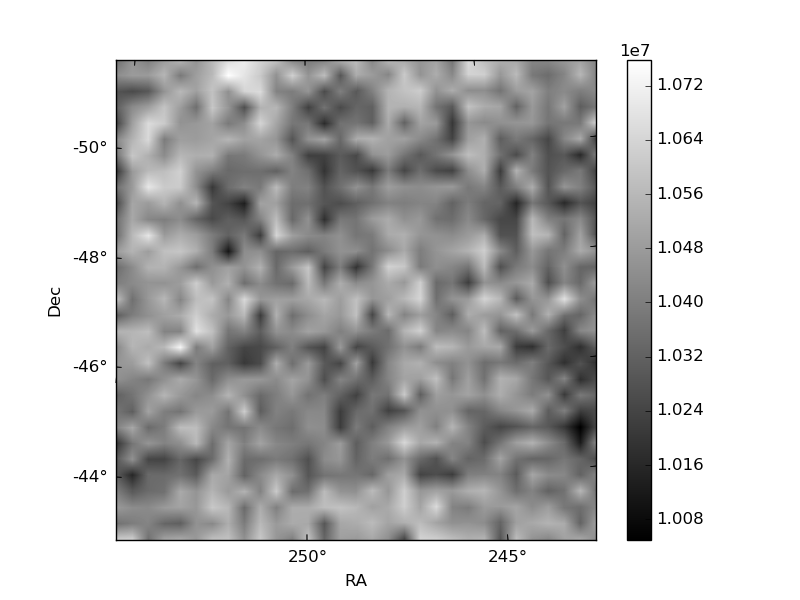
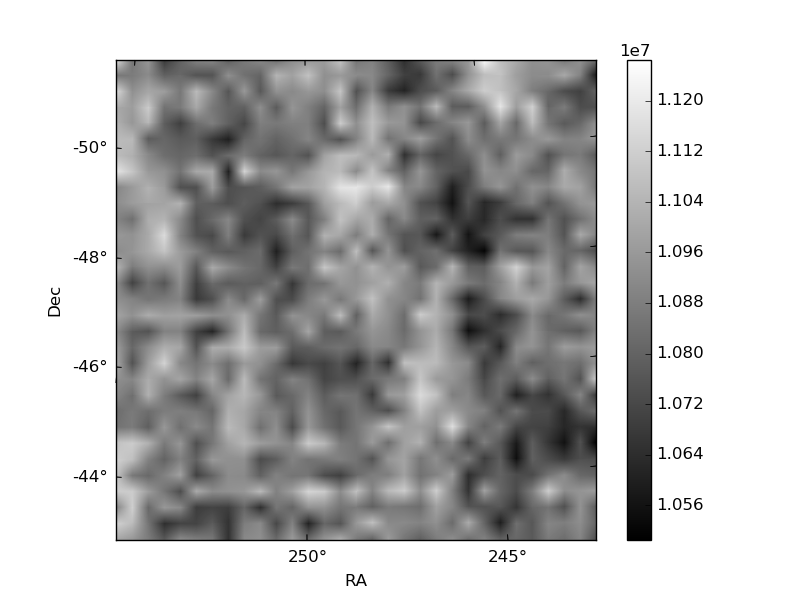
Histogram calculated using DETX and DETY for each event in the final _common_clean file
| Quadrant A | 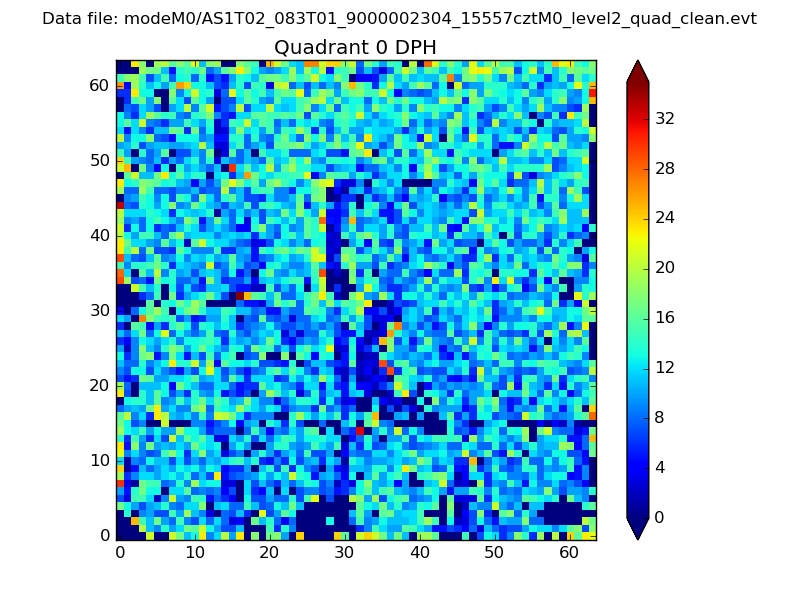 |
 |
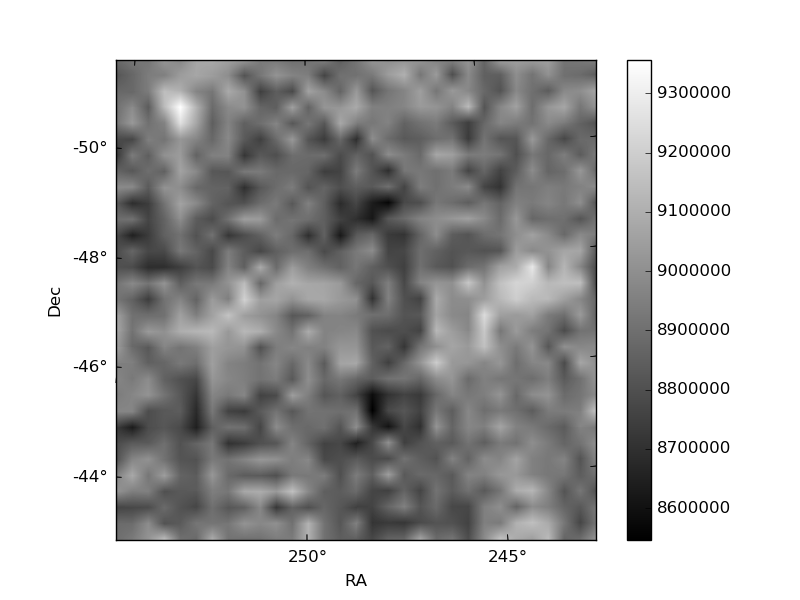
Quadrant B |
|---|---|---|---|
| Quadrant D | 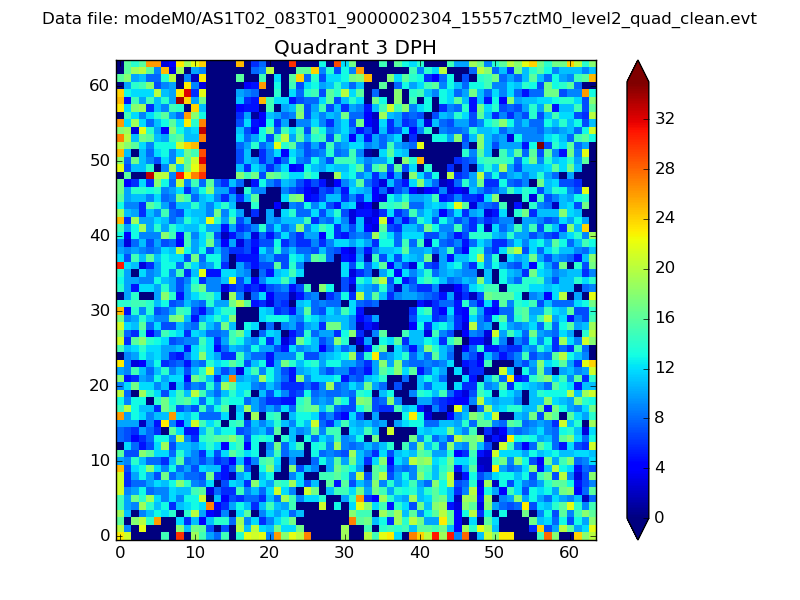 |
 |
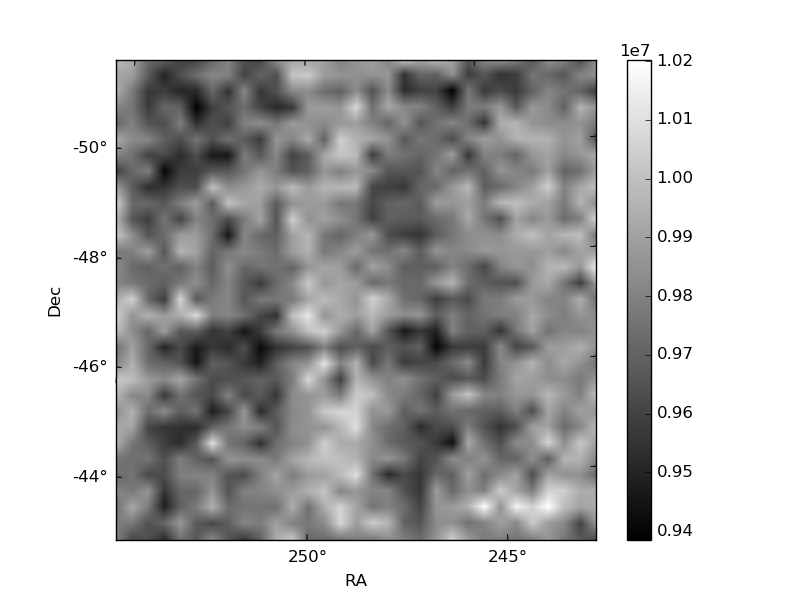
Quadrant C |
| Plot type | Count rate plots | Images |
|---|---|---|
| Comparison with Poisson distribution Blue bars denote a histogram of data divided into 1 sec bins. Red curve is a Poisson curve with rate = median count rate of data. |
 |
 |
| Quadrant-wise count rates Data is divided into 100 sec bins |
 |
|
| Module-wise count rates for Quadrant A Data is divided into 100 sec bins |
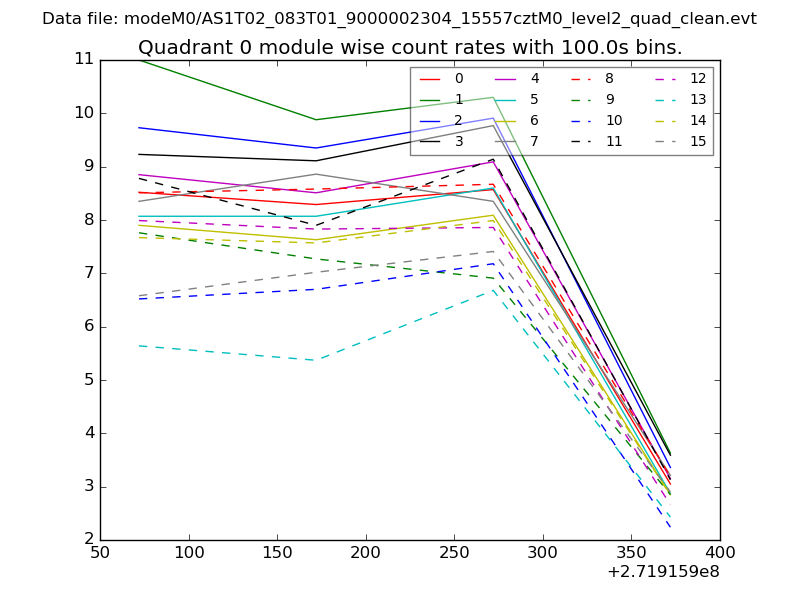 |
 |
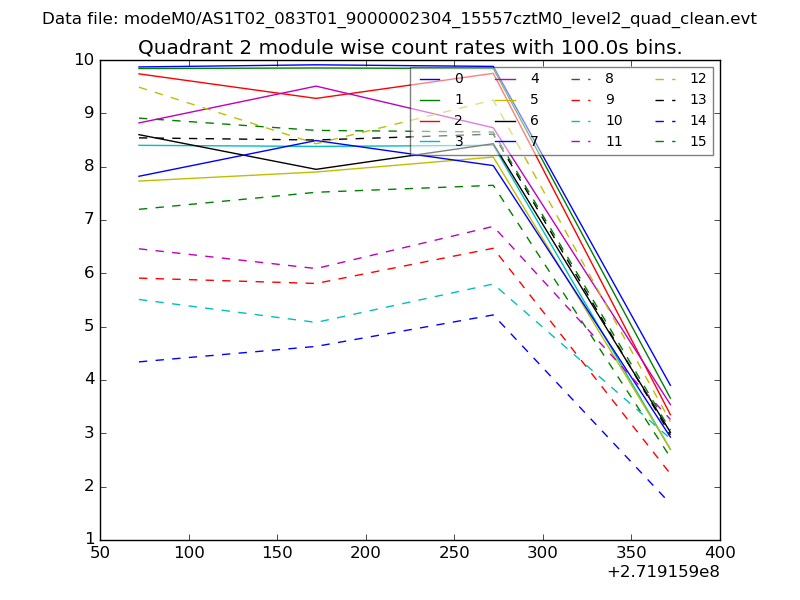
| Module-wise count rates for Quadrant B Data is divided into 100 sec bins |
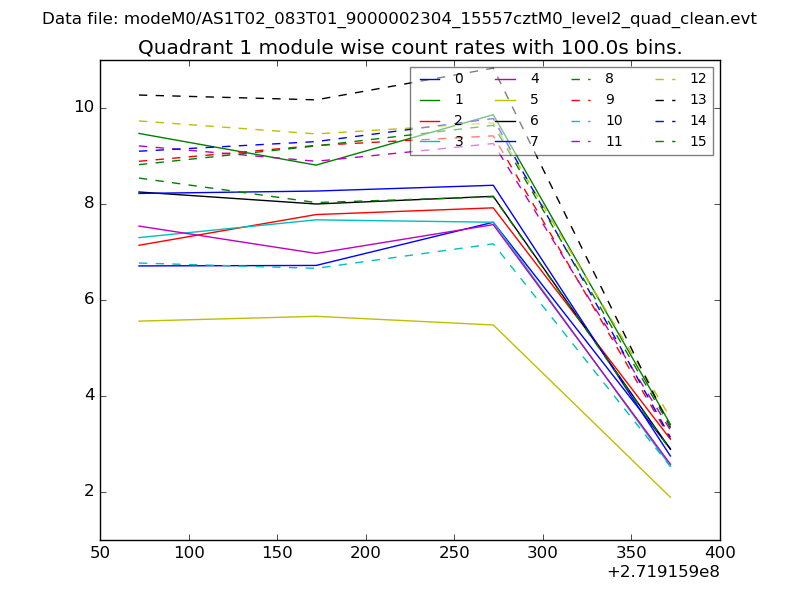 |
 |
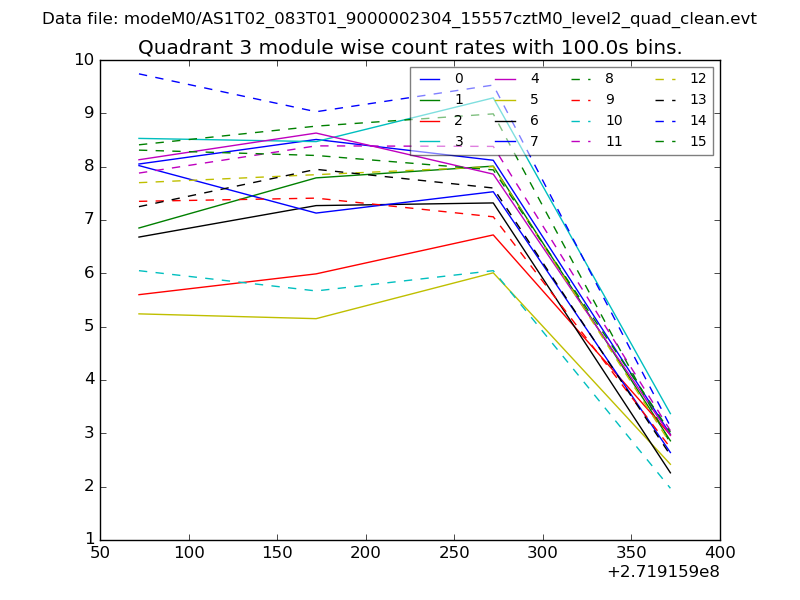
| Module-wise count rates for Quadrant C Data is divided into 100 sec bins |
 |
 |
| Module-wise count rates for Quadrant D Data is divided into 100 sec bins |
 |
 |
| Parameter | Plot |
|---|---|
| CZT HV Monitor | 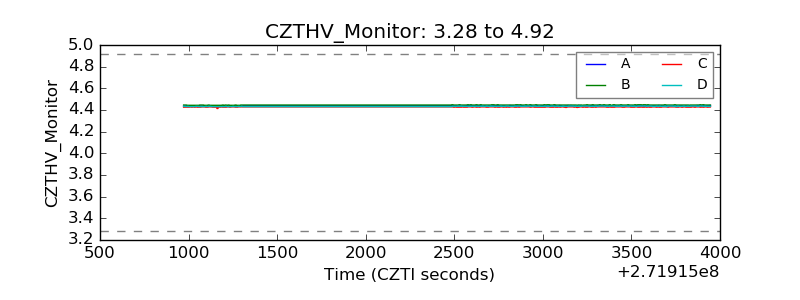 |
| D_VDD | 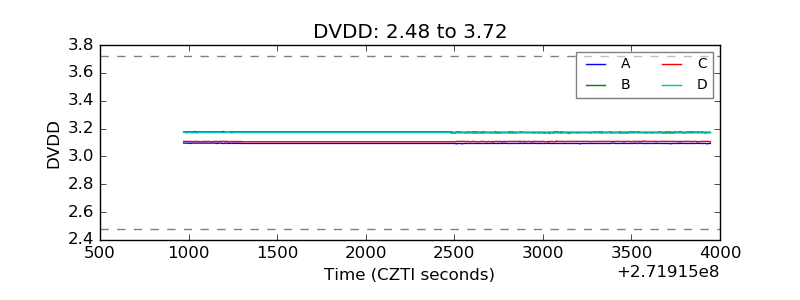 |
| Temperature 1 | 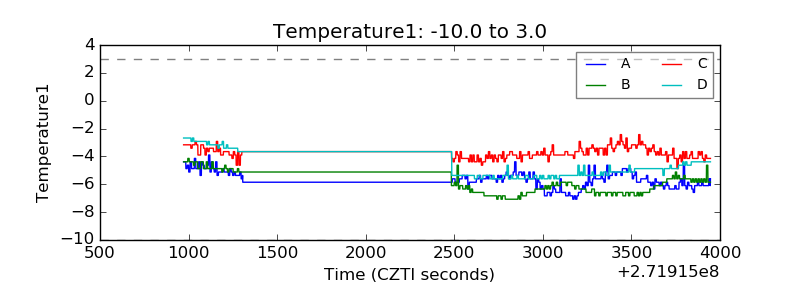 |
| Veto HV Monitor | 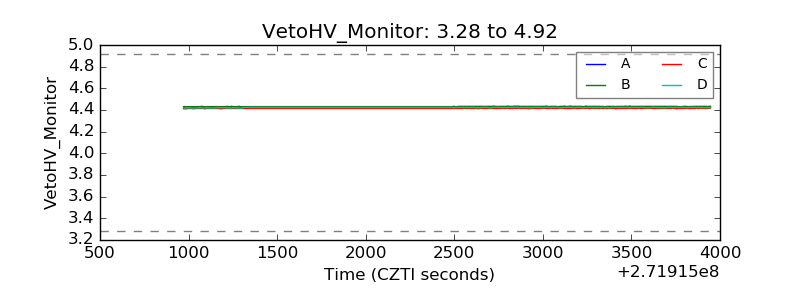 |
| Veto LLD | 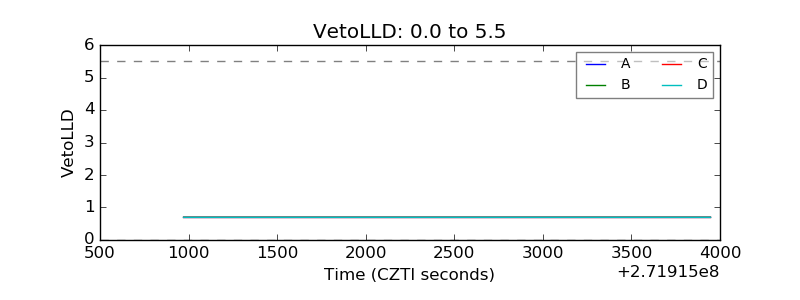 |
| Alpha Counter |  |
| _CPM_Rate |  |
| CZT Counter | 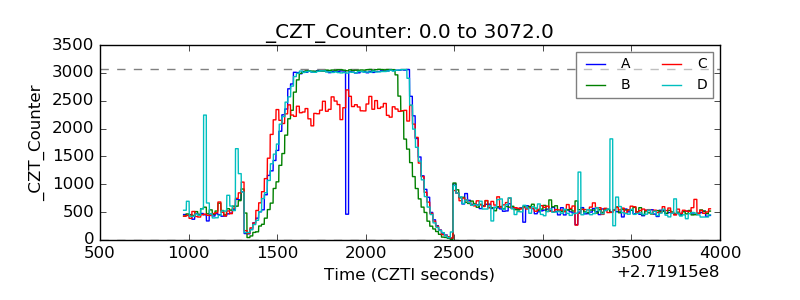 |
| +2.5 Volts monitor |  |
| +5 Volts monitor |  |
| _ROLL_ROT | 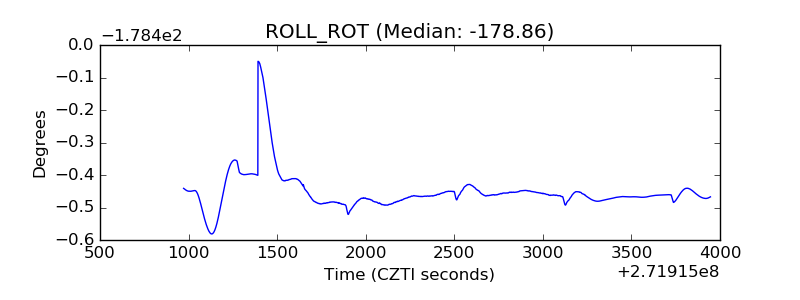 |
| _Roll_DEC | 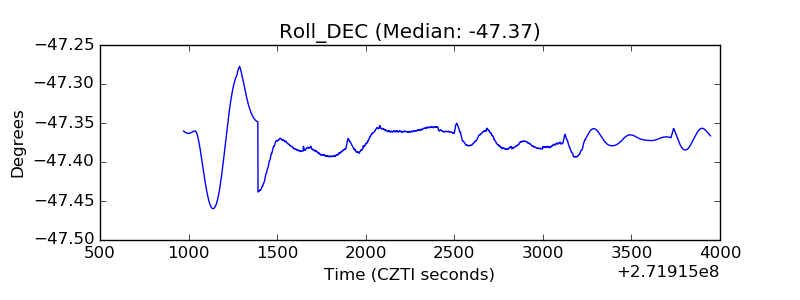 |
| _Roll_RA | 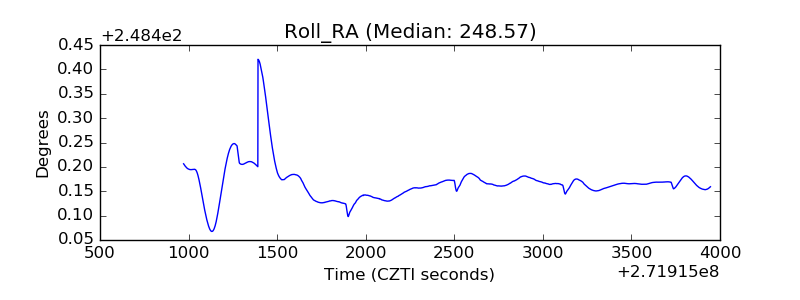 |
| Veto Counter | 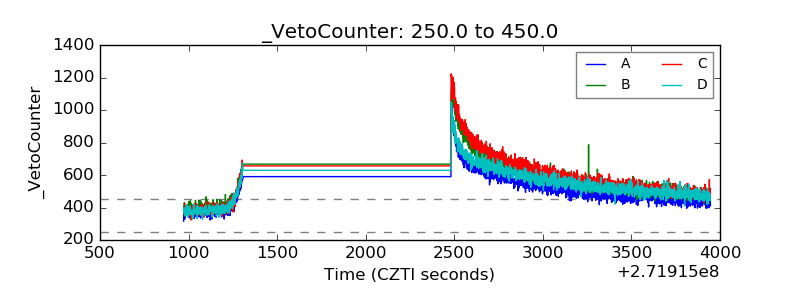 |