| Param | Original file | Final file |
|---|---|---|
| Filename | modeM0/AS1T02_083T01_9000002304_15558cztM0_level2.evt | modeM0/AS1T02_083T01_9000002304_15558cztM0_level2_quad_clean.evt |
| Size (bytes) | 492,747,840 | 70,188,480 |
| Size | 469.9 MB | 66.9 MB |
| Events in quadrant A | 3,257,244 | 425,499 |
| Events in quadrant B | 3,403,452 | 428,971 |
| Events in quadrant C | 3,337,796 | 420,404 |
| Events in quadrant D | 4,500,811 | 414,725 |
| Mode M9 | |||
|---|---|---|---|
| Quadrant | BADHDUFLAG | Total packets | Discarded packets |
| A | 0 | 18 | 0 |
| B | 0 | 18 | 0 |
| C | 0 | 18 | 0 |
| D | 0 | 19 | 0 |
| Mode SS | |||
|---|---|---|---|
| Quadrant | BADHDUFLAG | Total packets | Discarded packets |
| A | 0 | 128 | 0 |
| B | 0 | 128 | 0 |
| C | 0 | 128 | 0 |
| D | 0 | 128 | 0 |
| Mode M0 | |||
|---|---|---|---|
| Quadrant | BADHDUFLAG | Total packets | Discarded packets |
| A | 0 | 13505 | 3 |
| B | 0 | 13991 | 2 |
| C | 0 | 13764 | 2 |
| D | 0 | 17359 | 2 |
| Quadrant | Total seconds | Saturated seconds | Saturation percentage |
|---|---|---|---|
| A | 6234 | 82 | 1.315367% |
| B | 6234 | 101 | 1.620148% |
| C | 6234 | 120 | 1.924928% |
| D | 6234 | 571 | 9.159448% |
Noise dominated data is calculated using 1-second bins in cleaned event files. If a bin has >2000 counts, and if more than 50% of those come from <1% of pixels, then it is considered to be noise-dominated and hence unusable.
| Quadrant | # 1 sec bins | Bins with >0 counts | Bins with >2000 counts | High rate bins dominated by noise | Noise dominated (total time) | Noise dominated (detector-on time) | Marked lightcurve |
|---|---|---|---|---|---|---|---|
| A | 7525 | 6235 | 15 | 15 | 0.20% | 0.24% | 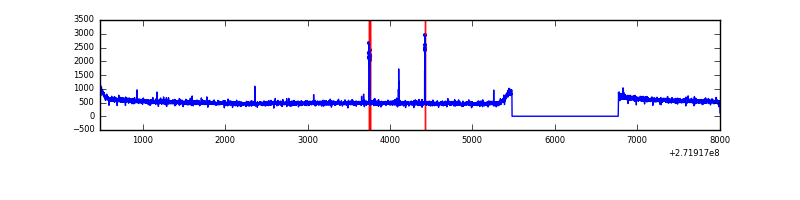 |
| B | 7525 | 6235 | 9 | 9 | 0.12% | 0.14% | 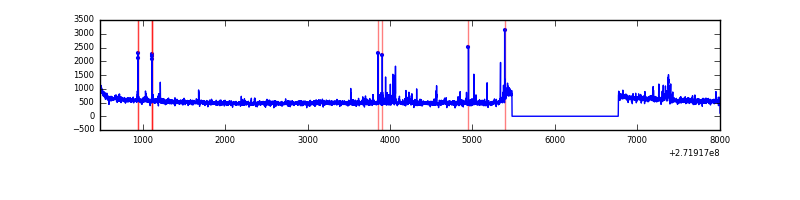 |
| C | 7525 | 6235 | 0 | 0 | 0.00% | 0.00% | 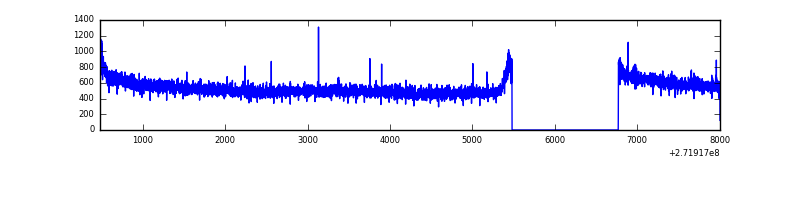 |
| D | 7525 | 6235 | 485 | 485 | 6.45% | 7.78% | 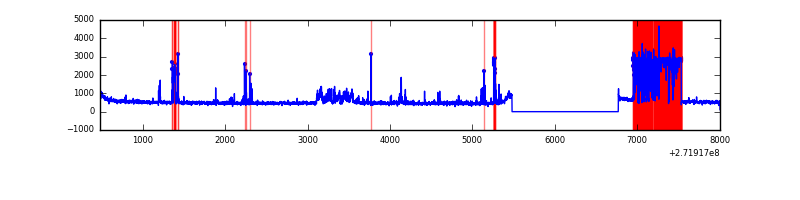 |
Top three noisy pixels from each quadrant. If the there are fewer than three noisy pixels in the level2.evt file, extra rows are filled as -1
| Pixel properties | Quadrant properties | ||||||
|---|---|---|---|---|---|---|---|
| Quadrant | DetID | PixID | Counts | Sigma | Mean | Median | Sigma |
| A | 0 | 253 | 27341 | 161.1 | 834 | 820 | 164.6 |
| A | 15 | 223 | 10436 | 58.41 | 834 | 820 | 164.6 |
| A | 0 | 226 | 7362 | 39.74 | 834 | 820 | 164.6 |
| B | 4 | 48 | 42222 | 267.95 | 833 | 815 | 154.5 |
| B | 3 | 64 | 38858 | 246.18 | 833 | 815 | 154.5 |
| B | 12 | 111 | 17073 | 105.21 | 833 | 815 | 154.5 |
| C | 14 | 238 | 128943 | 699.22 | 808 | 813 | 183.2 |
| C | 3 | 233 | 44514 | 238.48 | 808 | 813 | 183.2 |
| C | 7 | 247 | 6345 | 30.19 | 808 | 813 | 183.2 |
| D | 1 | 52 | 1464898 | 7255.03 | 769 | 752 | 201.8 |
| D | 13 | 172 | 45566 | 222.06 | 769 | 752 | 201.8 |
| D | 2 | 234 | 20392 | 97.32 | 769 | 752 | 201.8 |
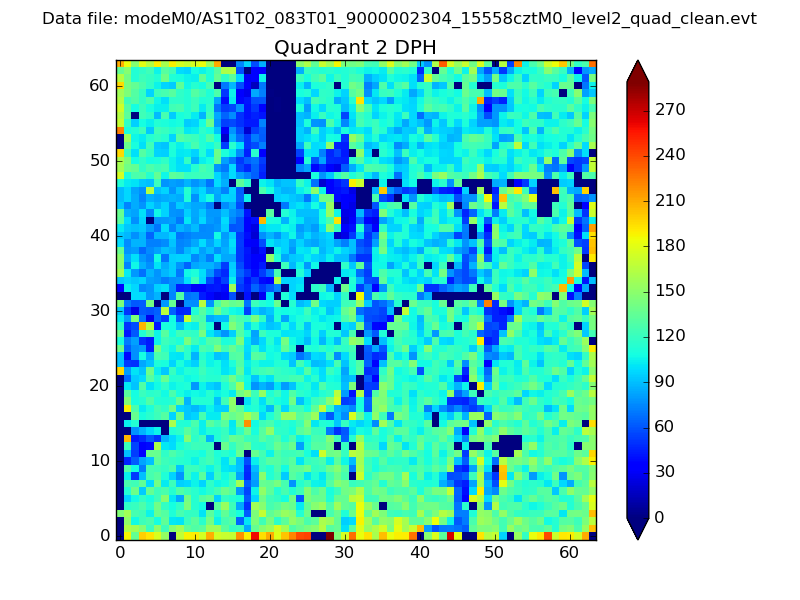
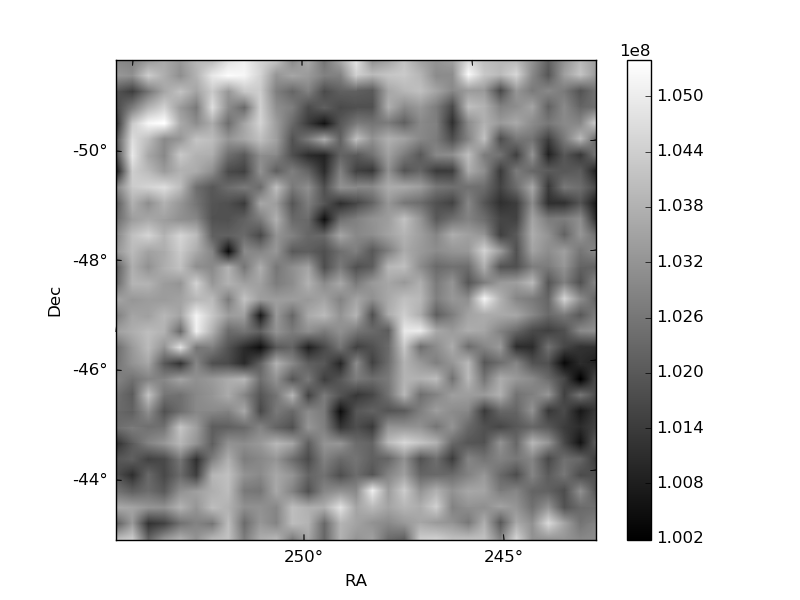
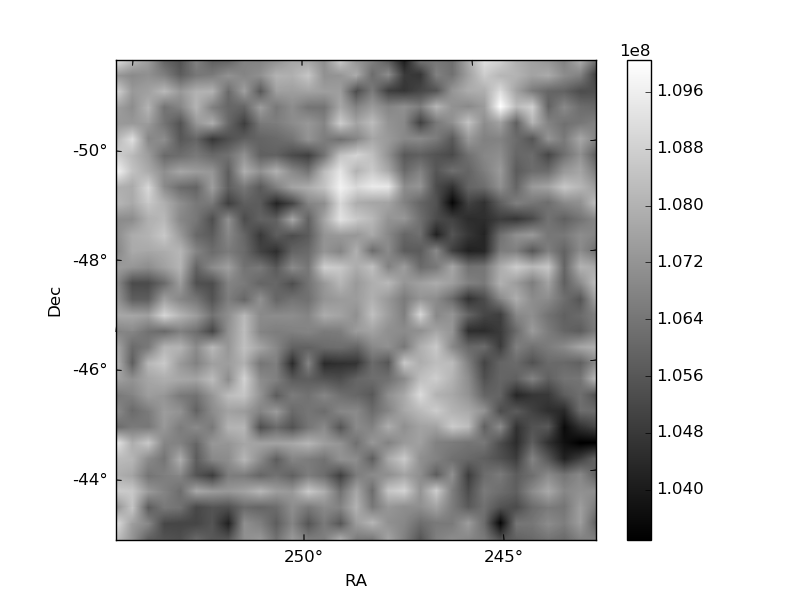
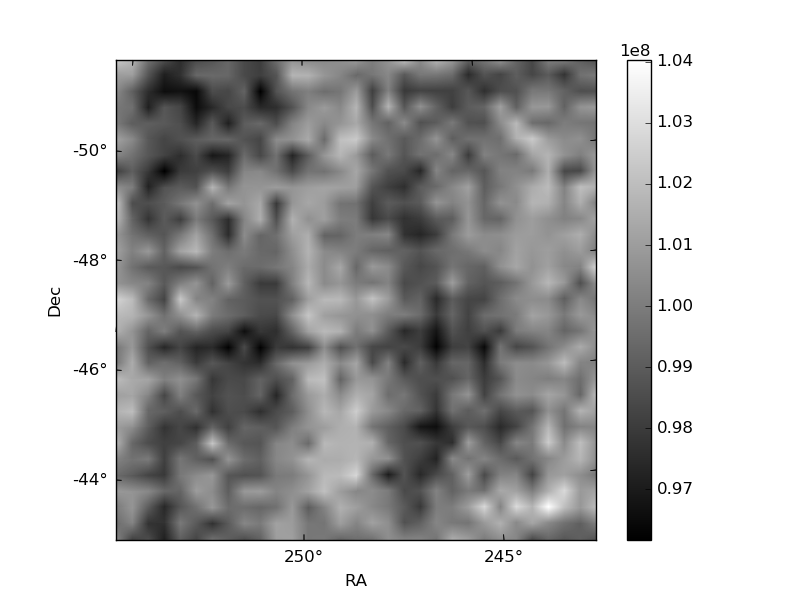
Histogram calculated using DETX and DETY for each event in the final _common_clean file
| Quadrant A |  |
 |
Quadrant B |
|---|---|---|---|
| Quadrant D | 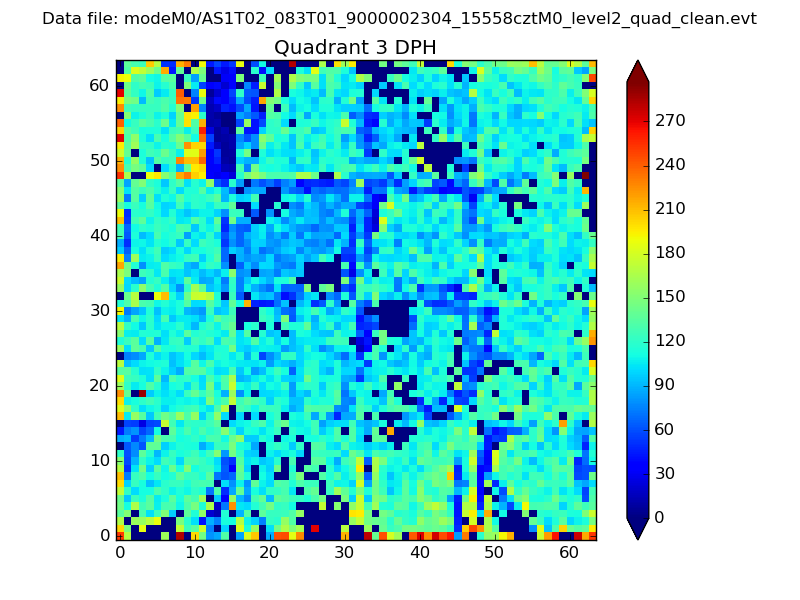 |
 |
Quadrant C |
| Plot type | Count rate plots | Images |
|---|---|---|
| Comparison with Poisson distribution Blue bars denote a histogram of data divided into 1 sec bins. Red curve is a Poisson curve with rate = median count rate of data. |
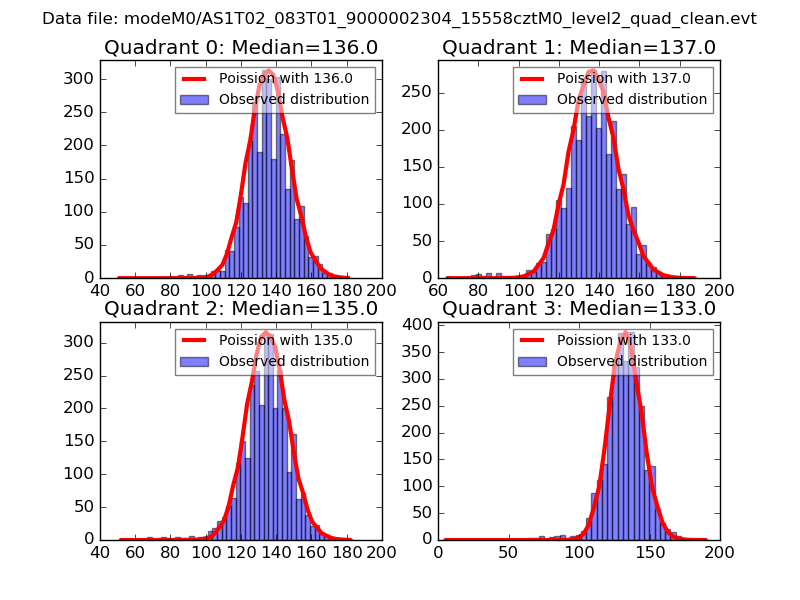 |
 |
| Quadrant-wise count rates Data is divided into 100 sec bins |
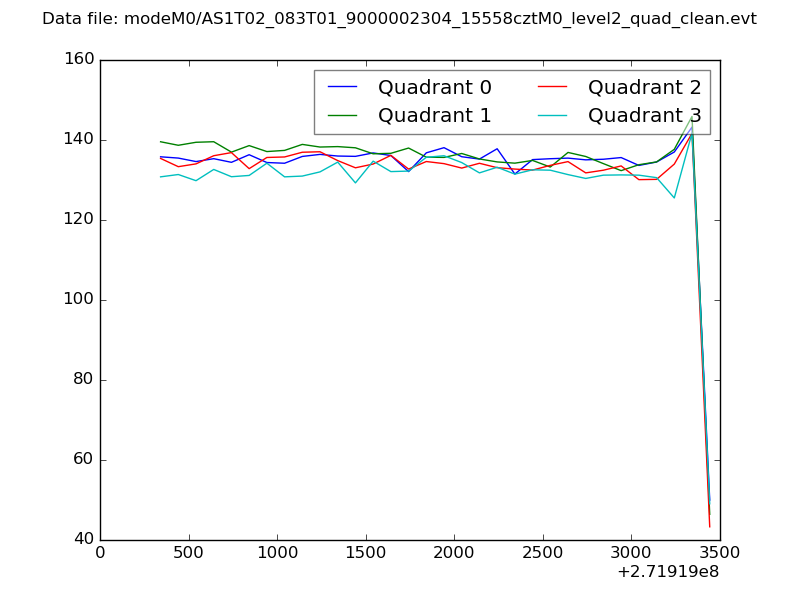 |
|
| Module-wise count rates for Quadrant A Data is divided into 100 sec bins |
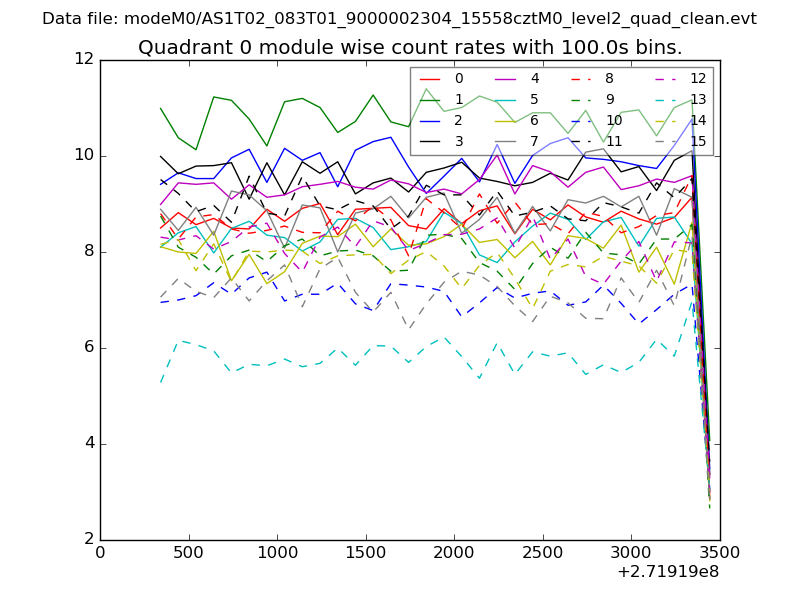 |
 |
| Module-wise count rates for Quadrant B Data is divided into 100 sec bins |
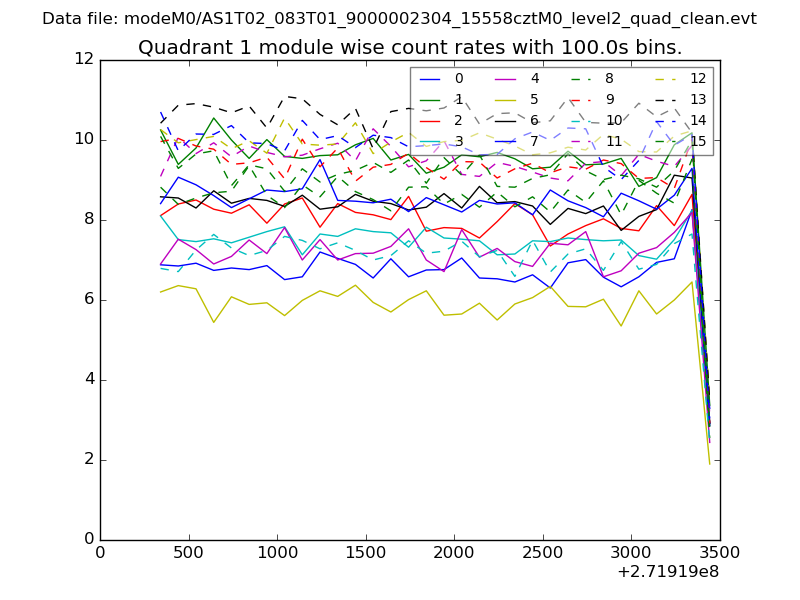 |
 |
| Module-wise count rates for Quadrant C Data is divided into 100 sec bins |
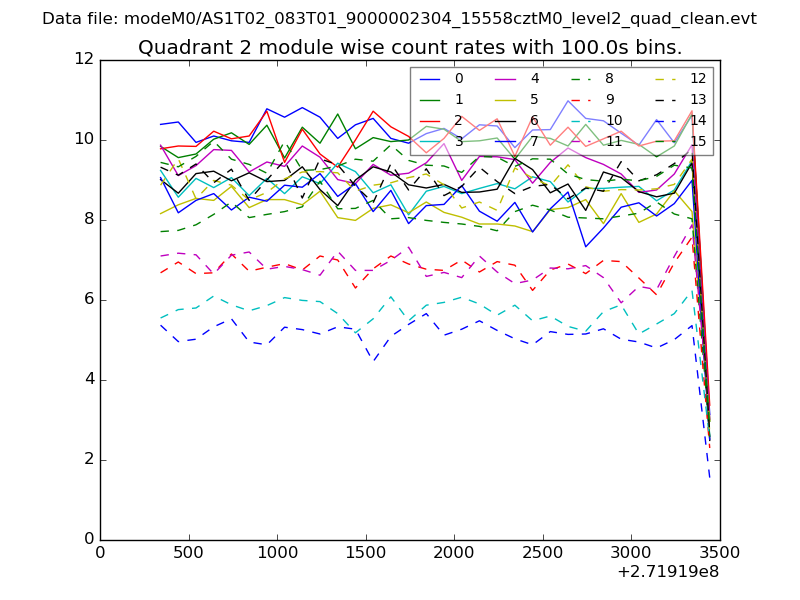 |
 |
| Module-wise count rates for Quadrant D Data is divided into 100 sec bins |
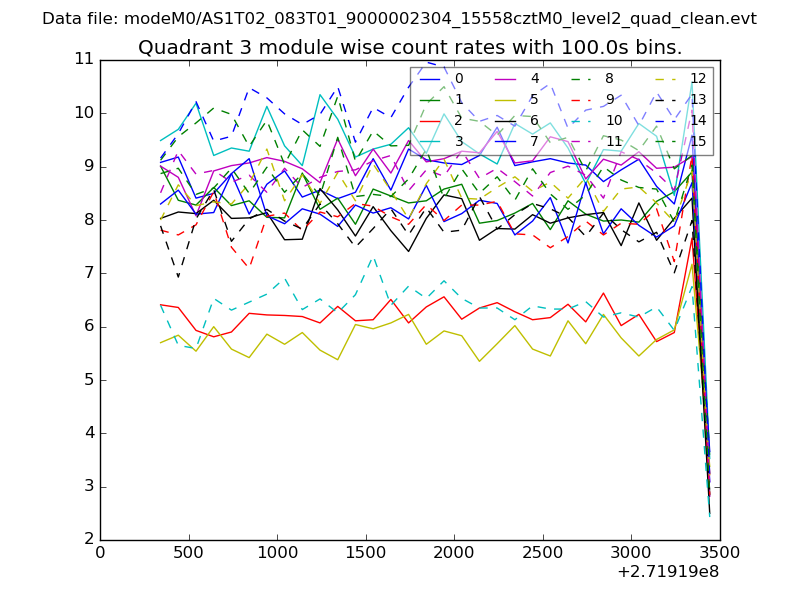 |
 |
| Parameter | Plot |
|---|---|
| CZT HV Monitor | 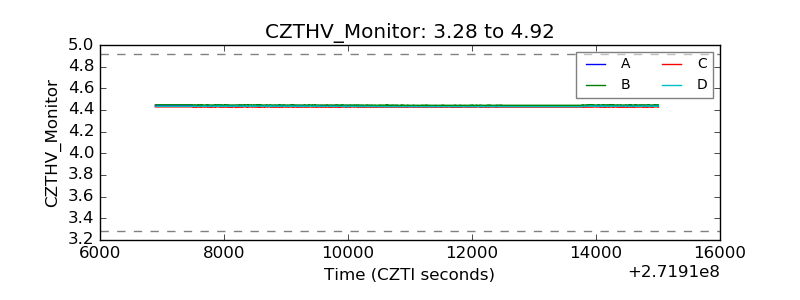 |
| D_VDD | 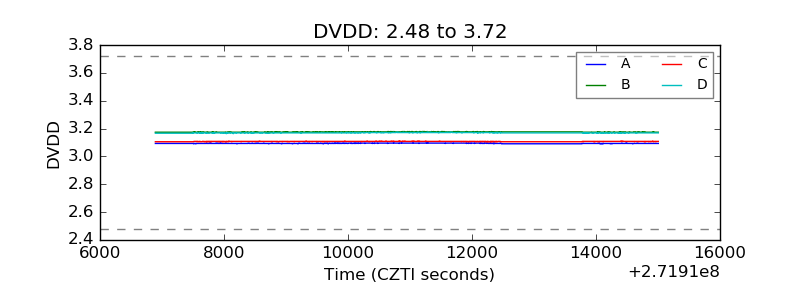 |
| Temperature 1 | 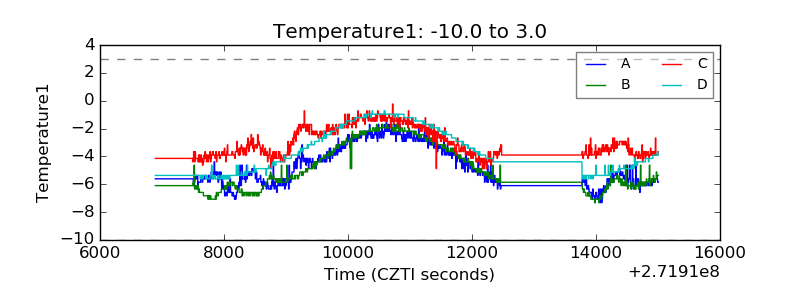 |
| Veto HV Monitor | 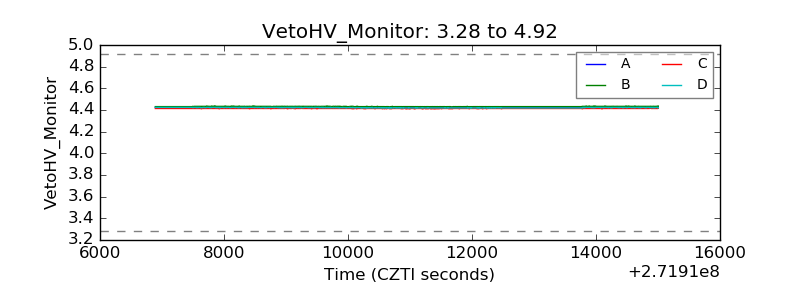 |
| Veto LLD |  |
| Alpha Counter | 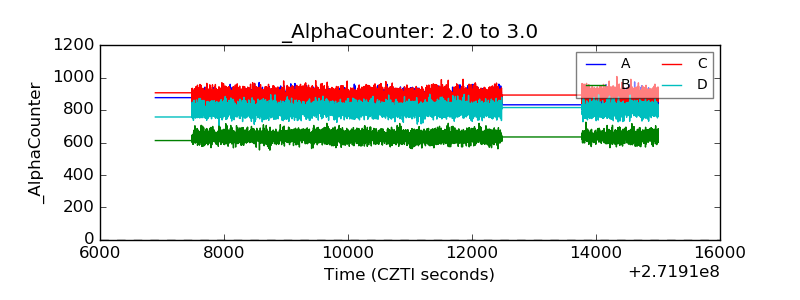 |
| _CPM_Rate | 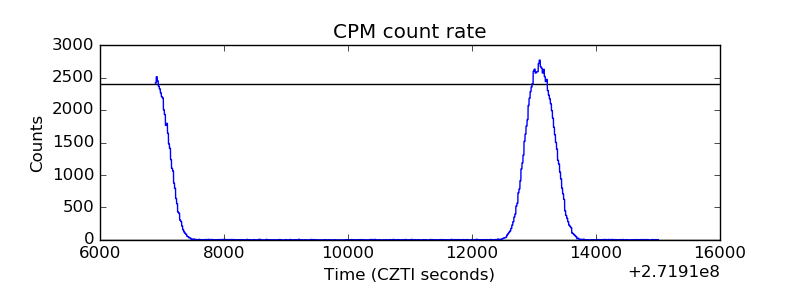 |
| CZT Counter | 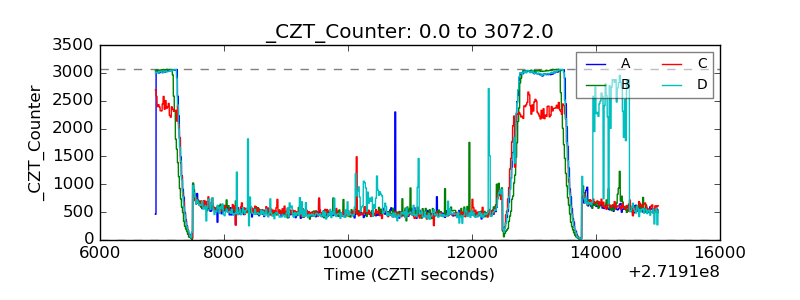 |
| +2.5 Volts monitor |  |
| +5 Volts monitor | 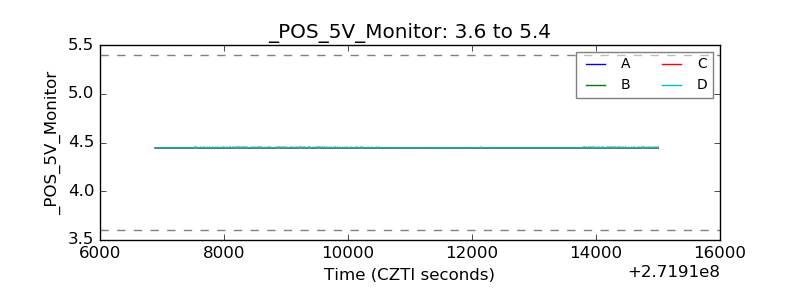 |
| _ROLL_ROT | 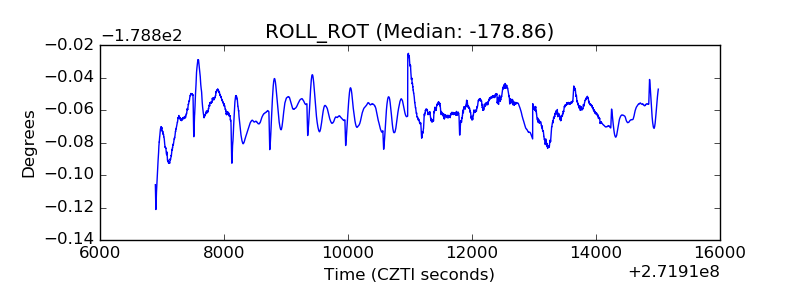 |
| _Roll_DEC | 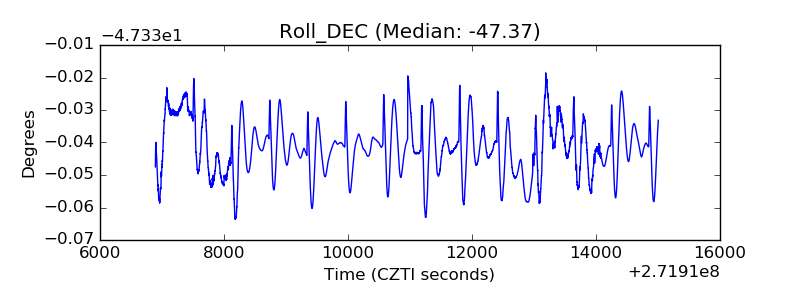 |
| _Roll_RA |  |
| Veto Counter | 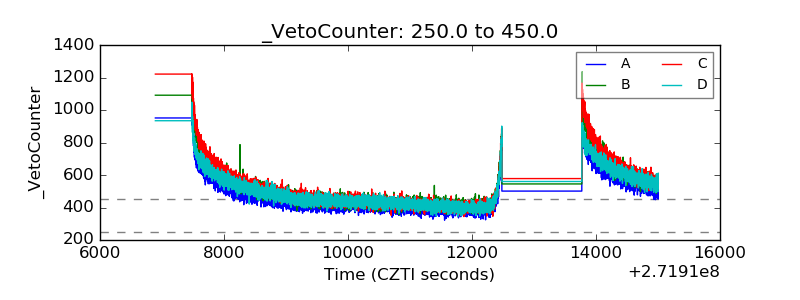 |