| Param | Original file | Final file |
|---|---|---|
| Filename | modeM0/AS1T02_083T01_9000002304_15560cztM0_level2.evt | modeM0/AS1T02_083T01_9000002304_15560cztM0_level2_quad_clean.evt |
| Size (bytes) | 481,685,760 | 102,974,400 |
| Size | 459.4 MB | 98.2 MB |
| Events in quadrant A | 3,363,818 | 683,262 |
| Events in quadrant B | 3,560,496 | 688,149 |
| Events in quadrant C | 3,536,004 | 663,435 |
| Events in quadrant D | 3,705,180 | 649,326 |
| Mode M9 | |||
|---|---|---|---|
| Quadrant | BADHDUFLAG | Total packets | Discarded packets |
| A | 0 | 20 | 0 |
| B | 0 | 20 | 0 |
| C | 0 | 20 | 0 |
| D | 0 | 21 | 0 |
| Mode SS | |||
|---|---|---|---|
| Quadrant | BADHDUFLAG | Total packets | Discarded packets |
| A | 0 | 126 | 0 |
| B | 0 | 126 | 0 |
| C | 0 | 126 | 0 |
| D | 0 | 126 | 0 |
| Mode M0 | |||
|---|---|---|---|
| Quadrant | BADHDUFLAG | Total packets | Discarded packets |
| A | 0 | 13802 | 3 |
| B | 0 | 14455 | 2 |
| C | 0 | 14489 | 2 |
| D | 0 | 14841 | 2 |
| Quadrant | Total seconds | Saturated seconds | Saturation percentage |
|---|---|---|---|
| A | 6224 | 115 | 1.847686% |
| B | 6224 | 130 | 2.088689% |
| C | 6224 | 228 | 3.663239% |
| D | 6224 | 240 | 3.856041% |
Noise dominated data is calculated using 1-second bins in cleaned event files. If a bin has >2000 counts, and if more than 50% of those come from <1% of pixels, then it is considered to be noise-dominated and hence unusable.
| Quadrant | # 1 sec bins | Bins with >0 counts | Bins with >2000 counts | High rate bins dominated by noise | Noise dominated (total time) | Noise dominated (detector-on time) | Marked lightcurve |
|---|---|---|---|---|---|---|---|
| A | 7555 | 6225 | 2 | 2 | 0.03% | 0.03% | 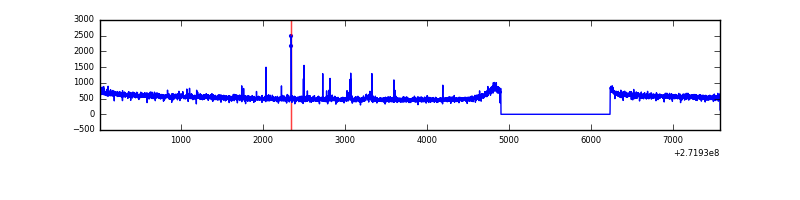 |
| B | 7555 | 6225 | 2 | 2 | 0.03% | 0.03% | 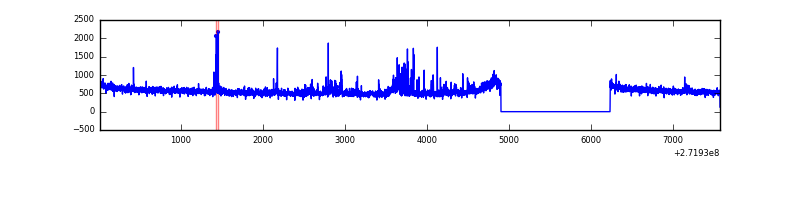 |
| C | 7555 | 6225 | 20 | 20 | 0.26% | 0.32% | 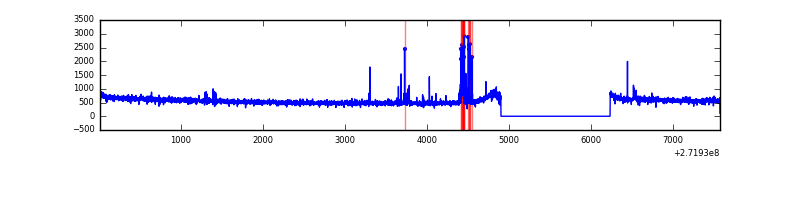 |
| D | 7555 | 6225 | 132 | 132 | 1.75% | 2.12% | 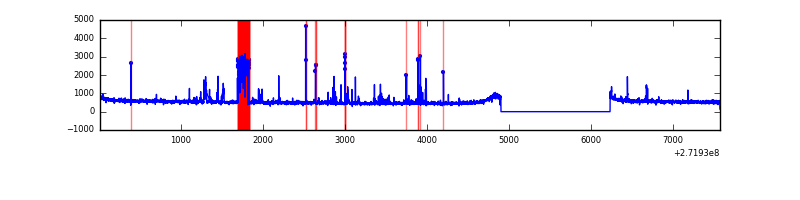 |
Top three noisy pixels from each quadrant. If the there are fewer than three noisy pixels in the level2.evt file, extra rows are filled as -1
| Pixel properties | Quadrant properties | ||||||
|---|---|---|---|---|---|---|---|
| Quadrant | DetID | PixID | Counts | Sigma | Mean | Median | Sigma |
| A | 15 | 222 | 10645 | 57.04 | 867 | 851 | 171.7 |
| A | 13 | 248 | 8641 | 45.37 | 867 | 851 | 171.7 |
| A | 0 | 253 | 8353 | 43.69 | 867 | 851 | 171.7 |
| B | 0 | 189 | 92781 | 581.64 | 855 | 838 | 158.1 |
| B | 3 | 64 | 50146 | 311.93 | 855 | 838 | 158.1 |
| B | 4 | 48 | 18891 | 114.21 | 855 | 838 | 158.1 |
| C | 14 | 238 | 137059 | 726.57 | 825 | 832 | 187.5 |
| C | 3 | 233 | 126341 | 669.41 | 825 | 832 | 187.5 |
| C | 10 | 22 | 31983 | 166.15 | 825 | 832 | 187.5 |
| D | 1 | 52 | 346106 | 1586.26 | 835 | 818 | 217.7 |
| D | 12 | 110 | 69032 | 313.38 | 835 | 818 | 217.7 |
| D | 7 | 38 | 39218 | 176.41 | 835 | 818 | 217.7 |
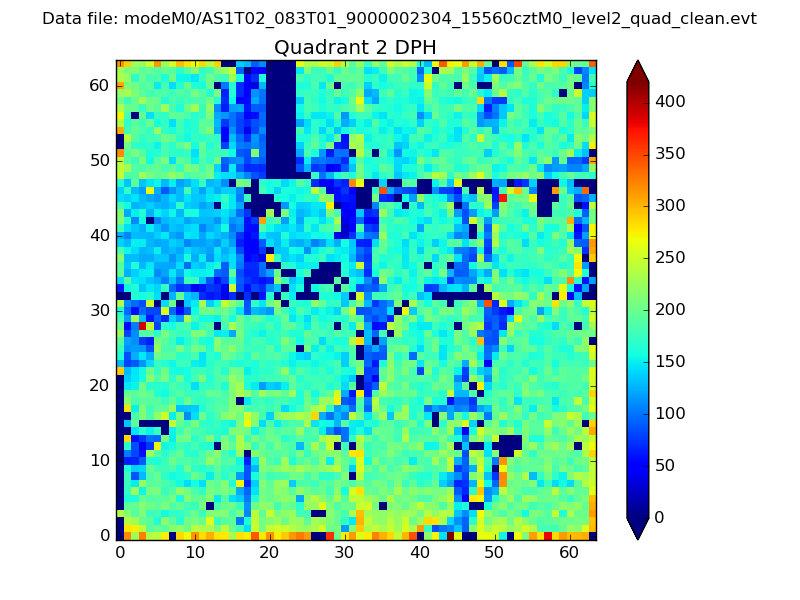
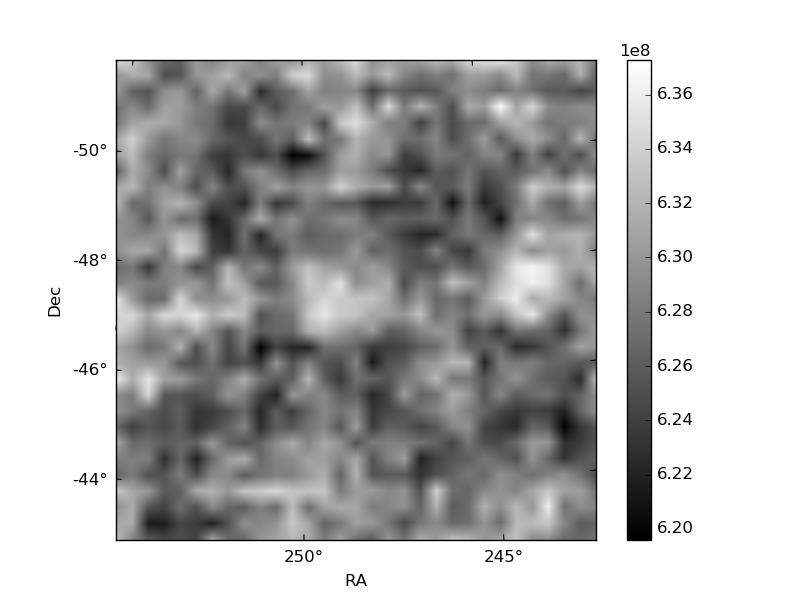
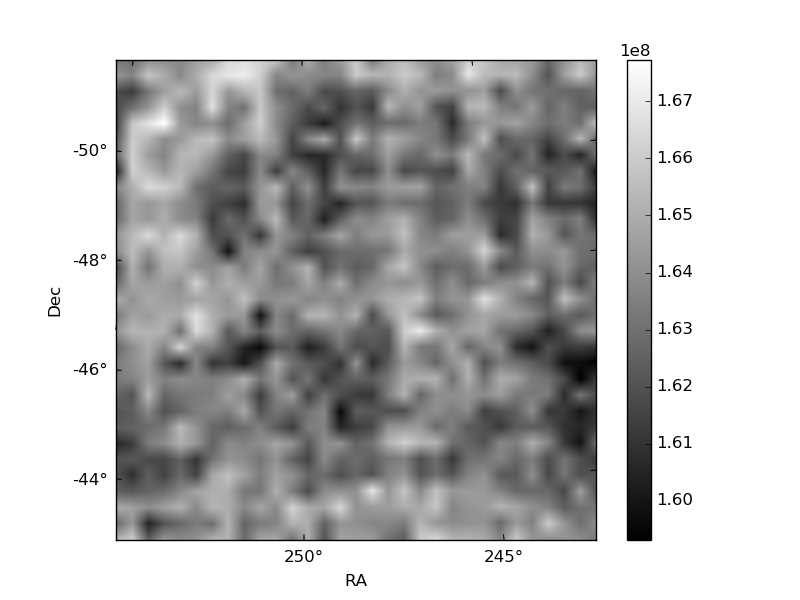
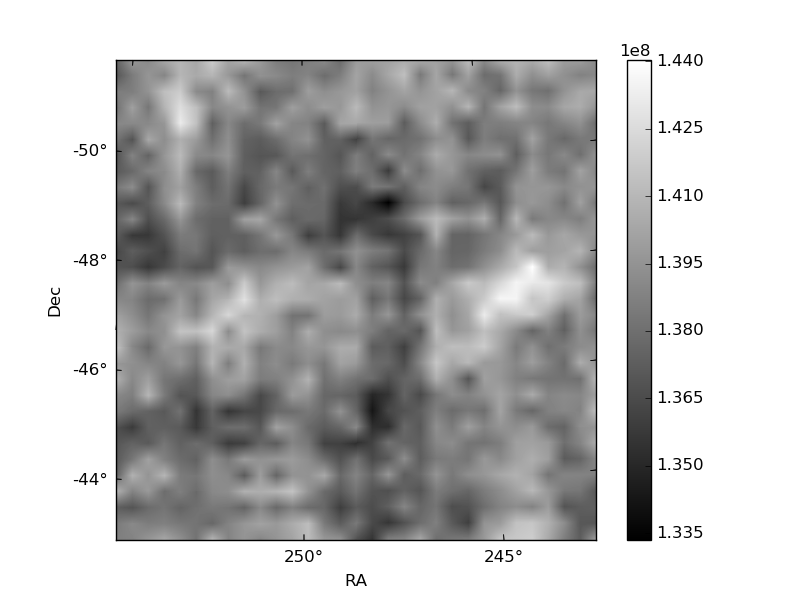
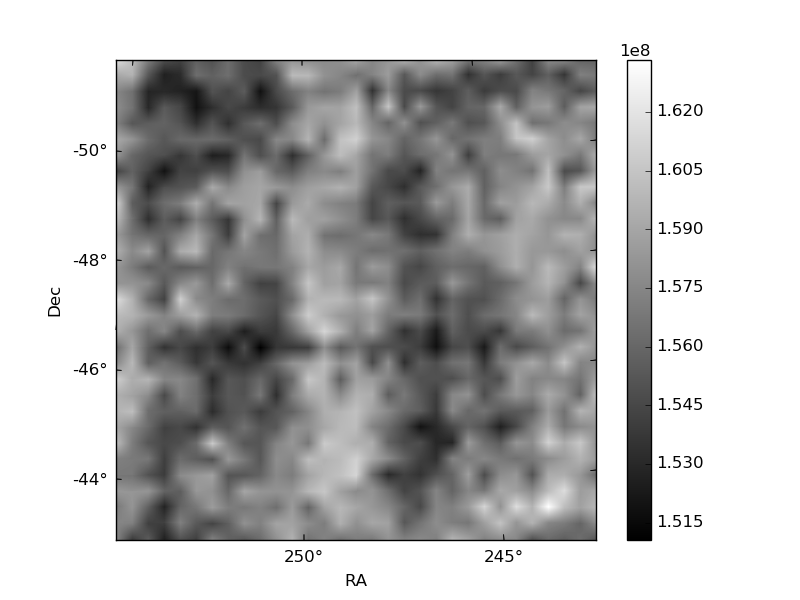
Histogram calculated using DETX and DETY for each event in the final _common_clean file
| Quadrant A | 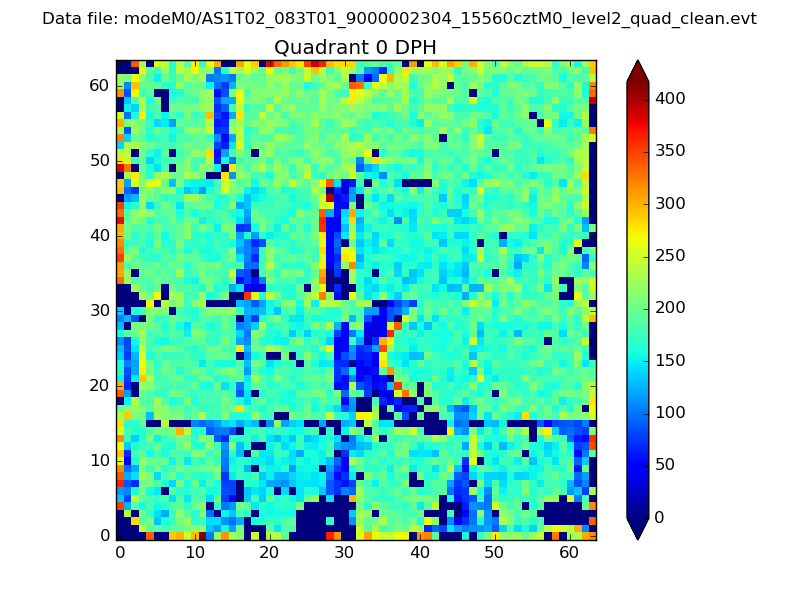 |
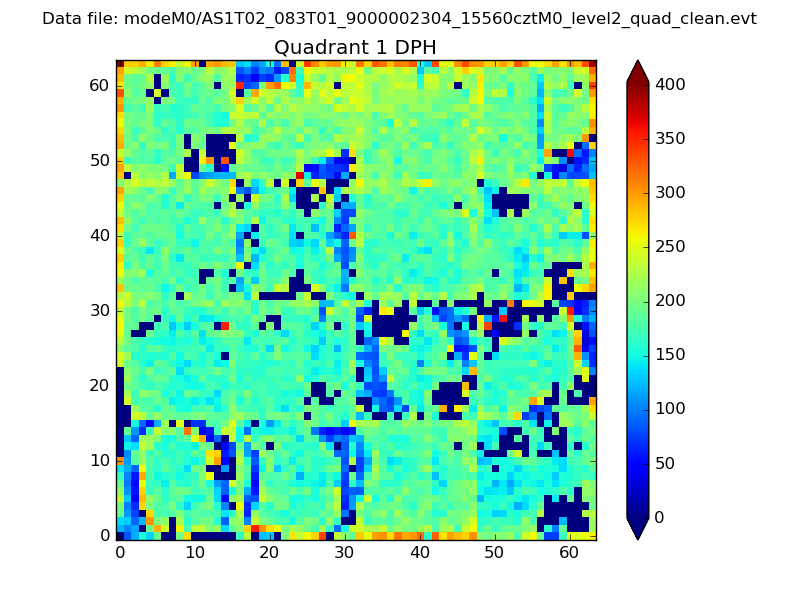 |
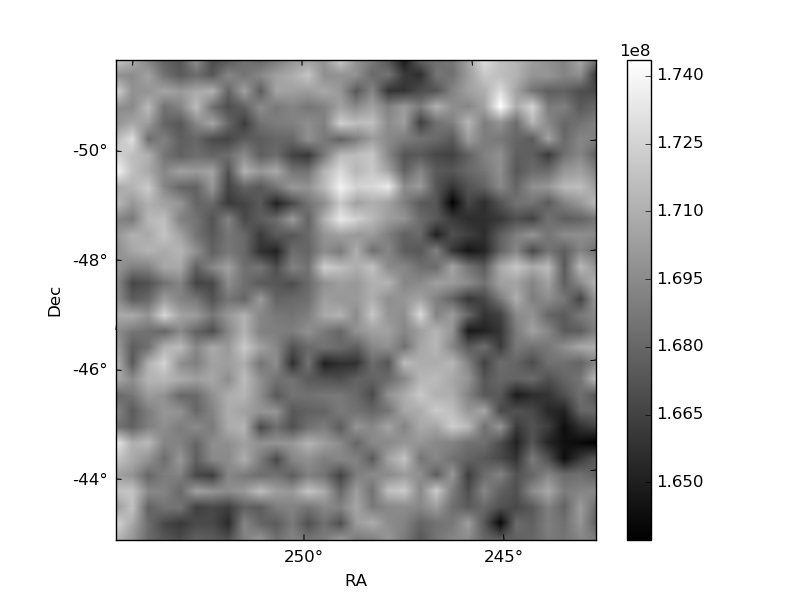
Quadrant B |
|---|---|---|---|
| Quadrant D | 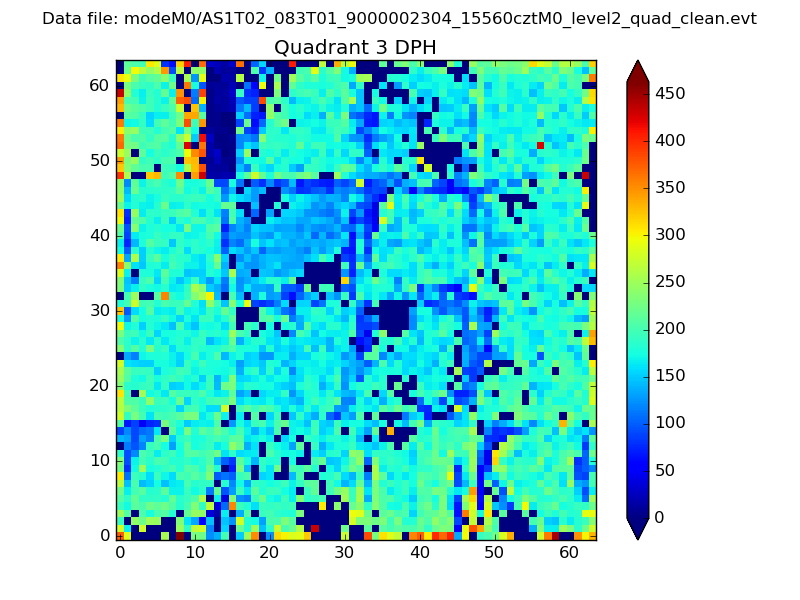 |
 |
Quadrant C |
| Plot type | Count rate plots | Images |
|---|---|---|
| Comparison with Poisson distribution Blue bars denote a histogram of data divided into 1 sec bins. Red curve is a Poisson curve with rate = median count rate of data. |
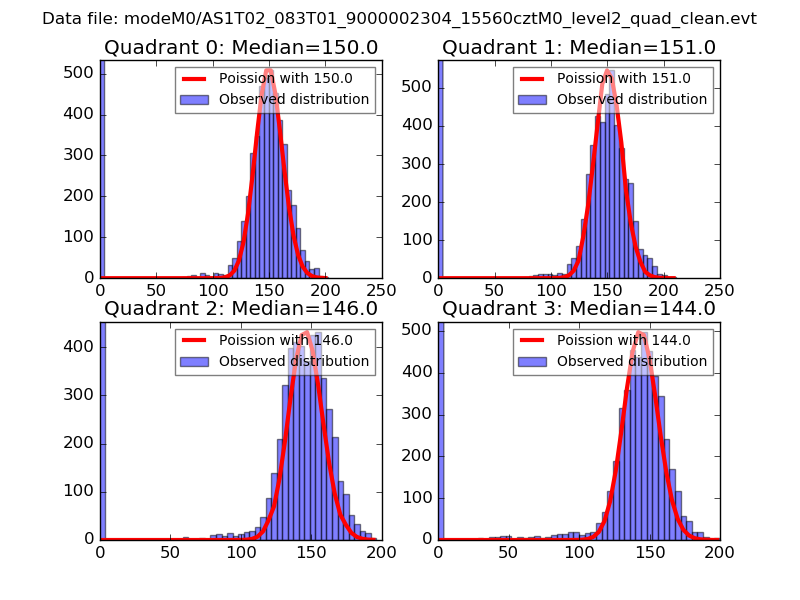 |
 |
| Quadrant-wise count rates Data is divided into 100 sec bins |
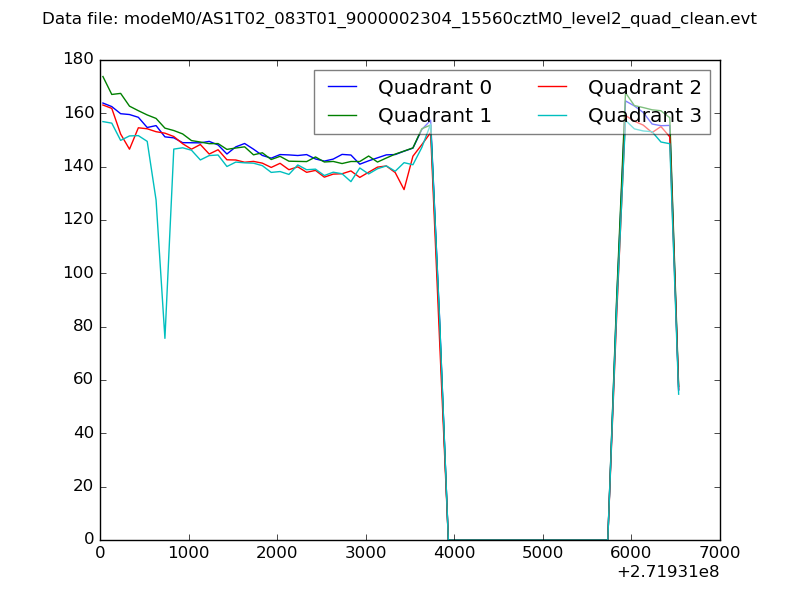 |
|
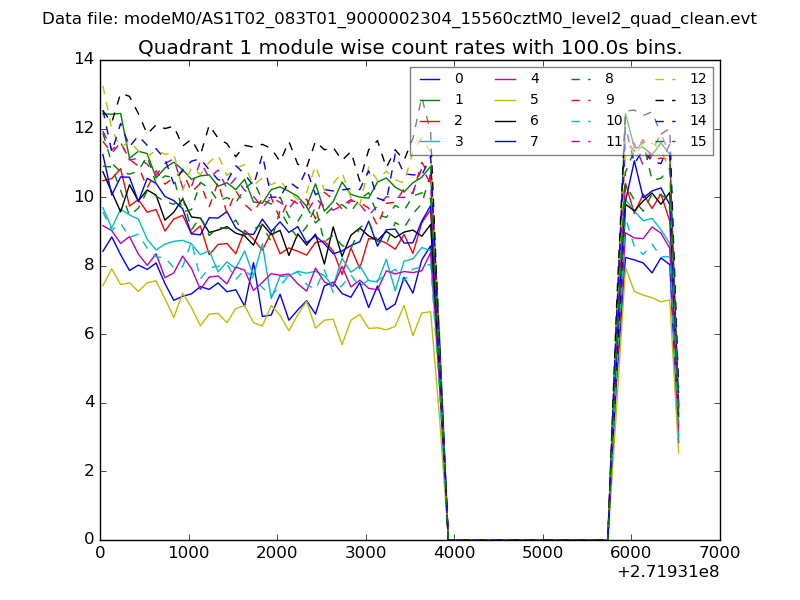
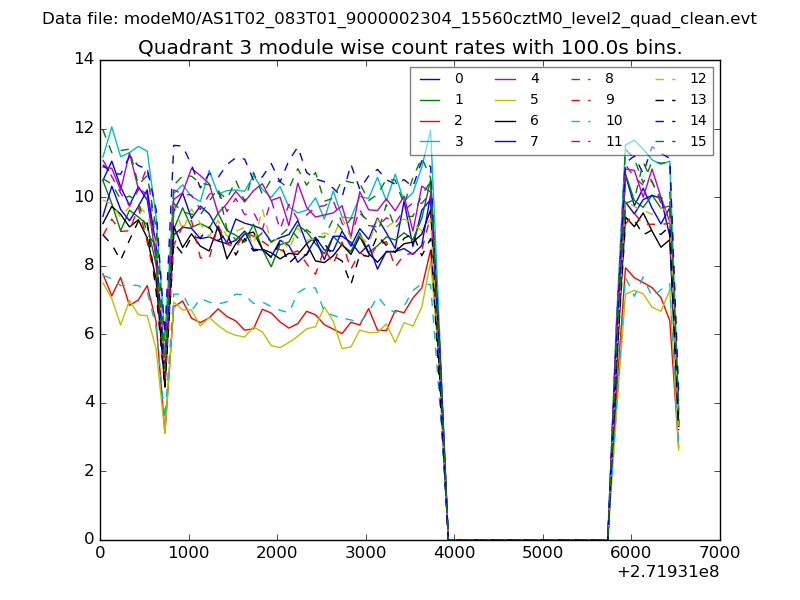
| Module-wise count rates for Quadrant A Data is divided into 100 sec bins |
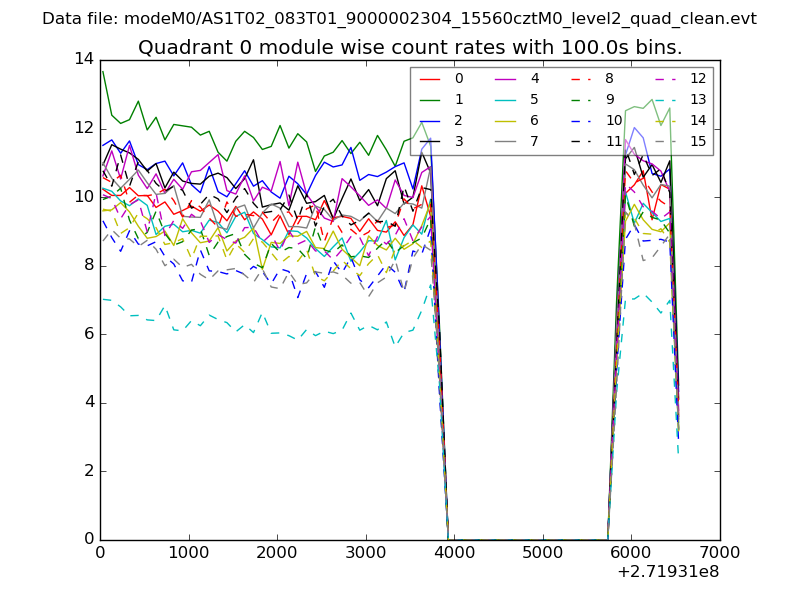 |
 |
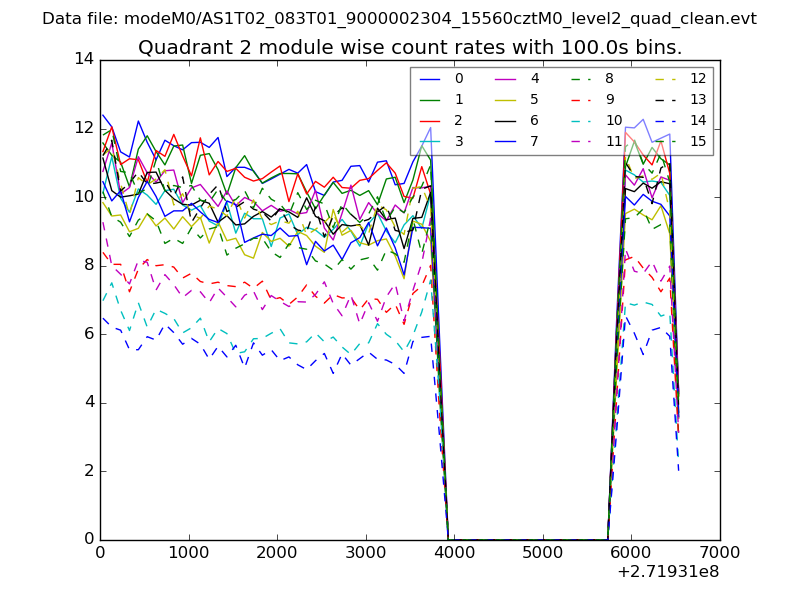
| Module-wise count rates for Quadrant B Data is divided into 100 sec bins |
 |
 |
| Module-wise count rates for Quadrant C Data is divided into 100 sec bins |
 |
 |
| Module-wise count rates for Quadrant D Data is divided into 100 sec bins |
 |
 |
| Parameter | Plot |
|---|---|
| CZT HV Monitor | 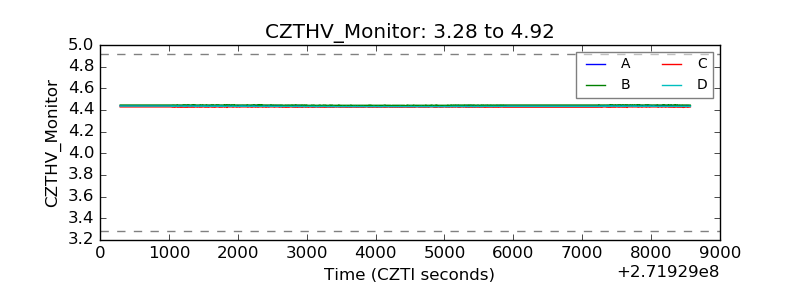 |
| D_VDD | 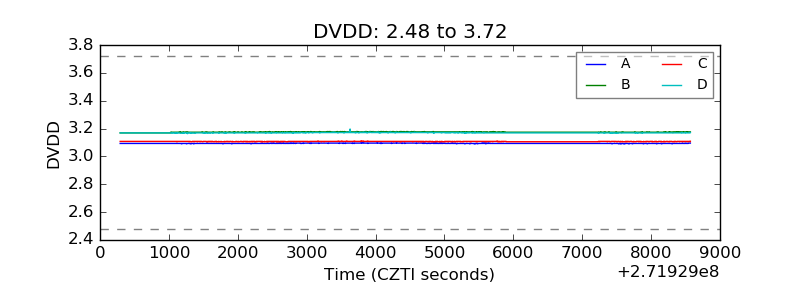 |
| Temperature 1 | 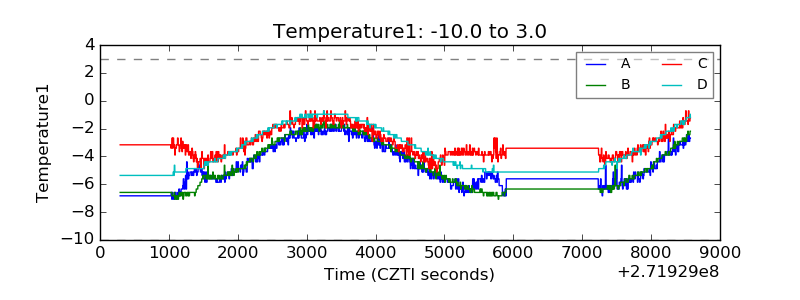 |
| Veto HV Monitor | 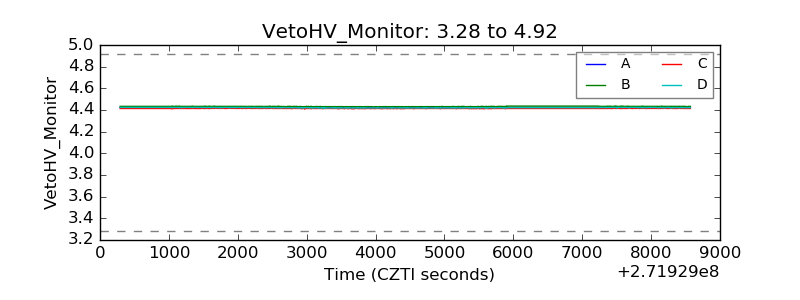 |
| Veto LLD | 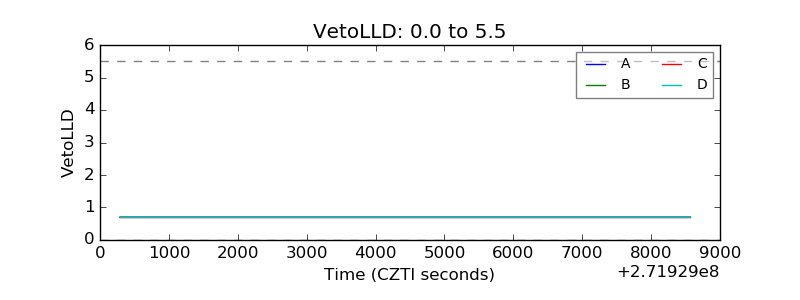 |
| Alpha Counter | 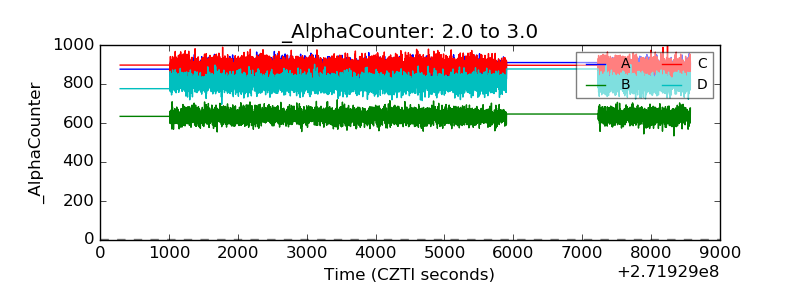 |
| _CPM_Rate | 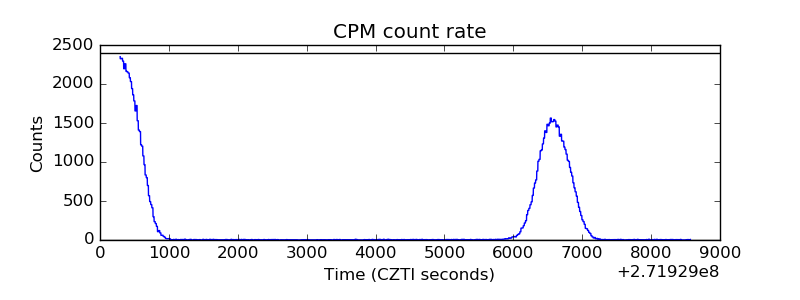 |
| CZT Counter | 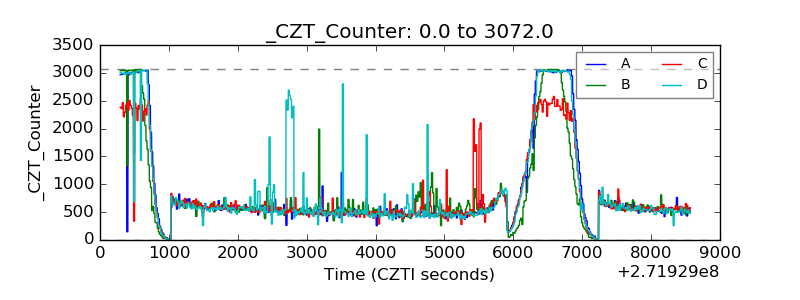 |
| +2.5 Volts monitor |  |
| +5 Volts monitor |  |
| _ROLL_ROT | 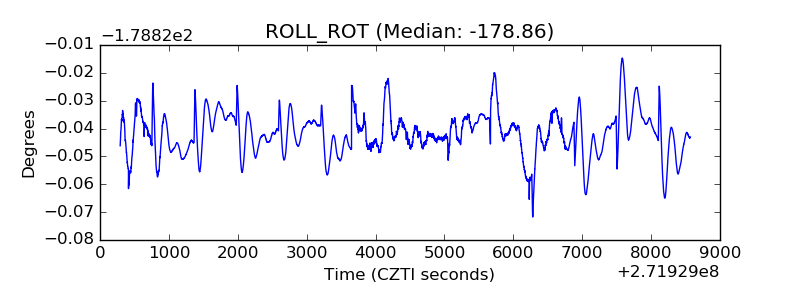 |
| _Roll_DEC | 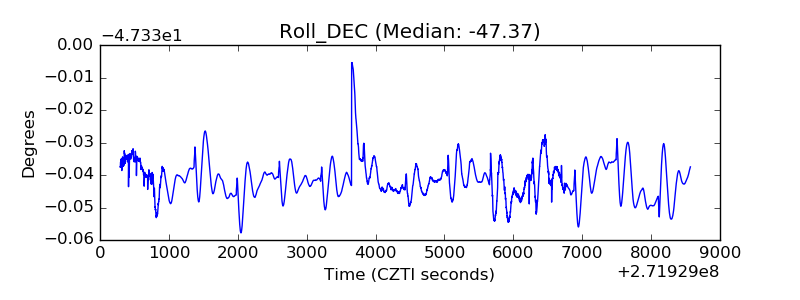 |
| _Roll_RA | 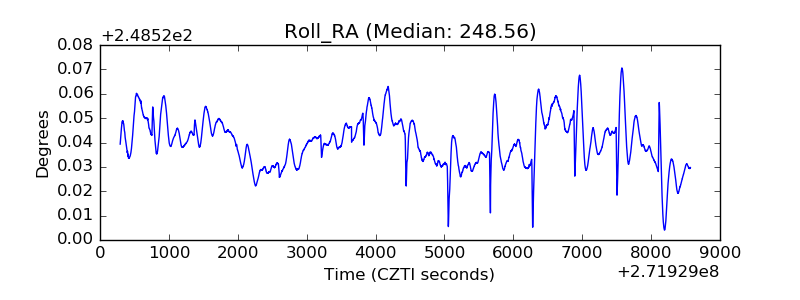 |
| Veto Counter | 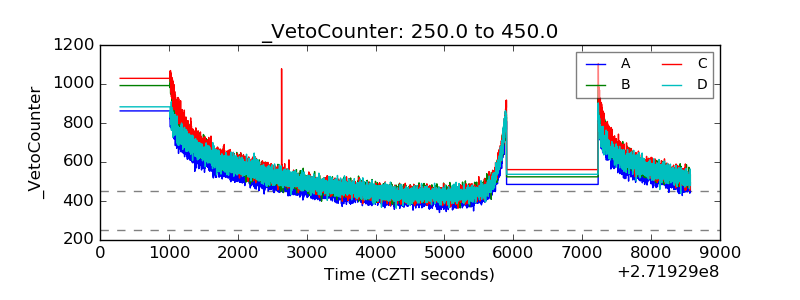 |