| Param | Original file | Final file |
|---|---|---|
| Filename | modeM0/AS1T02_083T01_9000002304_15561cztM0_level2.evt | modeM0/AS1T02_083T01_9000002304_15561cztM0_level2_quad_clean.evt |
| Size (bytes) | 97,352,640 | 21,484,800 |
| Size | 92.8 MB | 20.5 MB |
| Events in quadrant A | 710,682 | 139,738 |
| Events in quadrant B | 715,035 | 142,431 |
| Events in quadrant C | 734,023 | 136,510 |
| Events in quadrant D | 698,171 | 134,715 |
| Mode SS | |||
|---|---|---|---|
| Quadrant | BADHDUFLAG | Total packets | Discarded packets |
| A | 0 | 26 | 0 |
| B | 0 | 26 | 0 |
| C | 0 | 26 | 0 |
| D | 0 | 26 | 0 |
| Mode M0 | |||
|---|---|---|---|
| Quadrant | BADHDUFLAG | Total packets | Discarded packets |
| A | 0 | 2802 | 0 |
| B | 0 | 2825 | 0 |
| C | 0 | 2929 | 0 |
| D | 0 | 2743 | 0 |
| Quadrant | Total seconds | Saturated seconds | Saturation percentage |
|---|---|---|---|
| A | 1286 | 1 | 0.077760% |
| B | 1286 | 0 | 0.000000% |
| C | 1286 | 8 | 0.622084% |
| D | 1286 | 2 | 0.155521% |
Noise dominated data is calculated using 1-second bins in cleaned event files. If a bin has >2000 counts, and if more than 50% of those come from <1% of pixels, then it is considered to be noise-dominated and hence unusable.
| Quadrant | # 1 sec bins | Bins with >0 counts | Bins with >2000 counts | High rate bins dominated by noise | Noise dominated (total time) | Noise dominated (detector-on time) | Marked lightcurve |
|---|---|---|---|---|---|---|---|
| A | 1287 | 1287 | 0 | 0 | 0.00% | 0.00% | 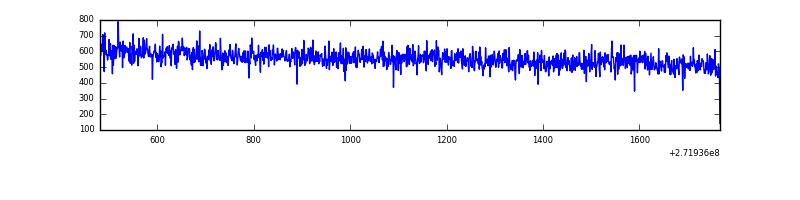 |
| B | 1287 | 1287 | 0 | 0 | 0.00% | 0.00% | 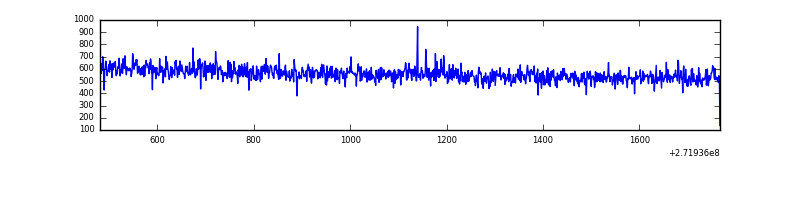 |
| C | 1287 | 1287 | 0 | 0 | 0.00% | 0.00% | 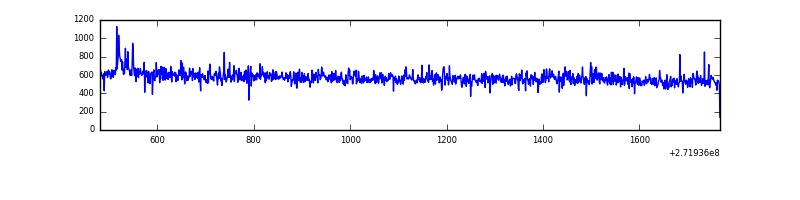 |
| D | 1287 | 1287 | 1 | 1 | 0.08% | 0.08% | 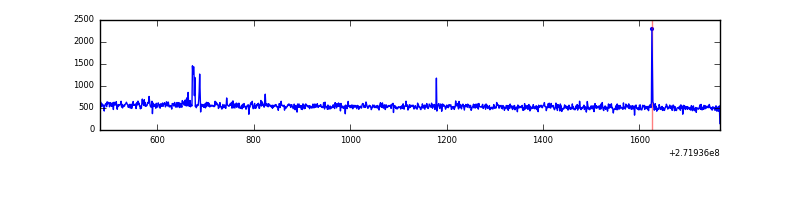 |
Top three noisy pixels from each quadrant. If the there are fewer than three noisy pixels in the level2.evt file, extra rows are filled as -1
| Pixel properties | Quadrant properties | ||||||
|---|---|---|---|---|---|---|---|
| Quadrant | DetID | PixID | Counts | Sigma | Mean | Median | Sigma |
| A | 0 | 226 | 1615 | 37.91 | 184 | 180 | 37.9 |
| A | 12 | 194 | 1366 | 31.33 | 184 | 180 | 37.9 |
| A | 15 | 222 | 1190 | 26.68 | 184 | 180 | 37.9 |
| B | 3 | 64 | 5625 | 153.71 | 181 | 177 | 35.4 |
| B | 12 | 111 | 3844 | 103.46 | 181 | 177 | 35.4 |
| B | 11 | 111 | 3245 | 86.56 | 181 | 177 | 35.4 |
| C | 14 | 238 | 28386 | 668.98 | 177 | 178 | 42.2 |
| C | 3 | 233 | 9095 | 211.47 | 177 | 178 | 42.2 |
| C | 10 | 22 | 5741 | 131.93 | 177 | 178 | 42.2 |
| D | 1 | 52 | 9030 | 196.93 | 181 | 176 | 45.0 |
| D | 2 | 234 | 4310 | 91.95 | 181 | 176 | 45.0 |
| D | 5 | 51 | 3698 | 78.34 | 181 | 176 | 45.0 |
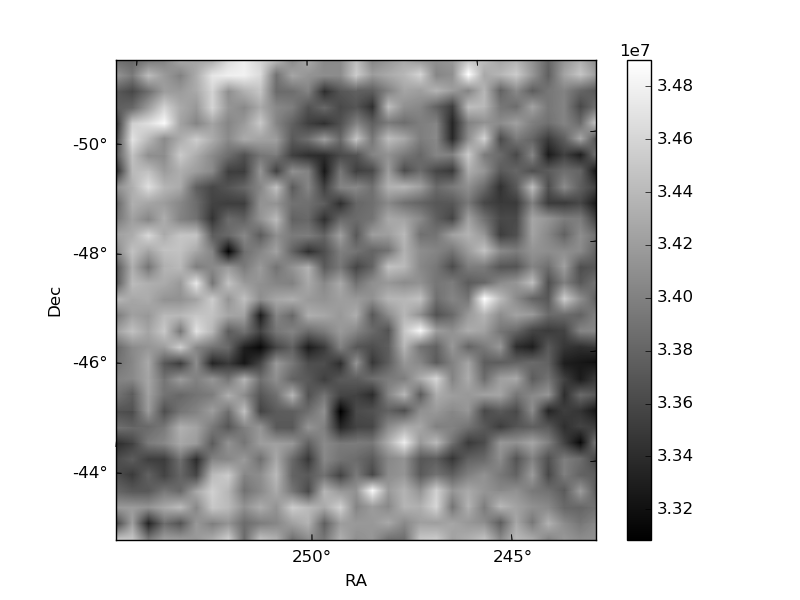
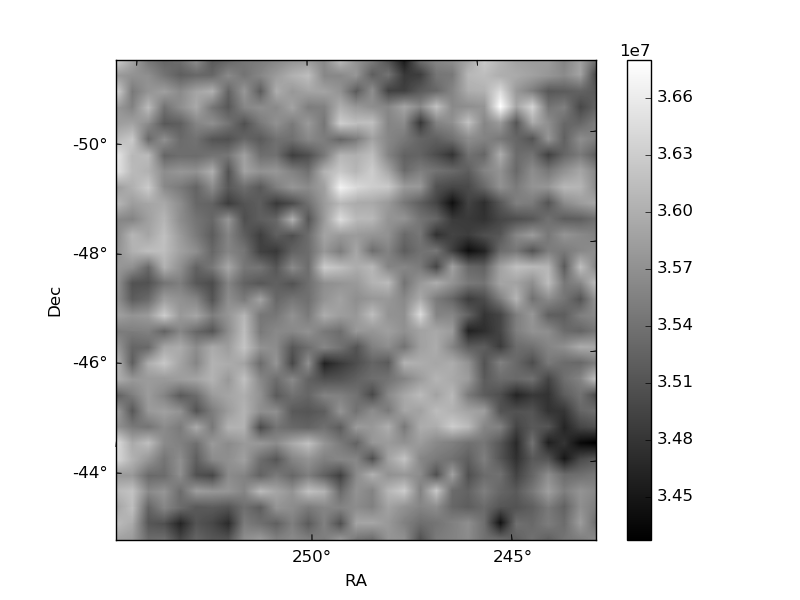
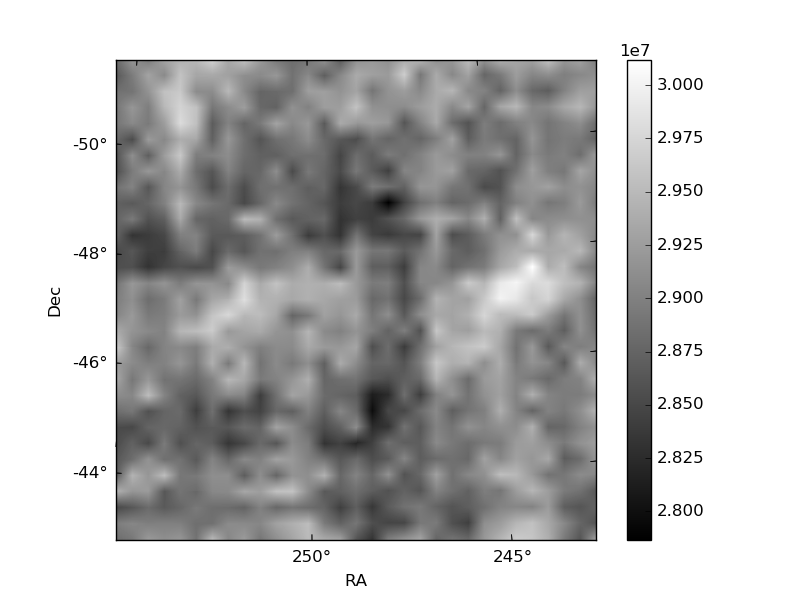
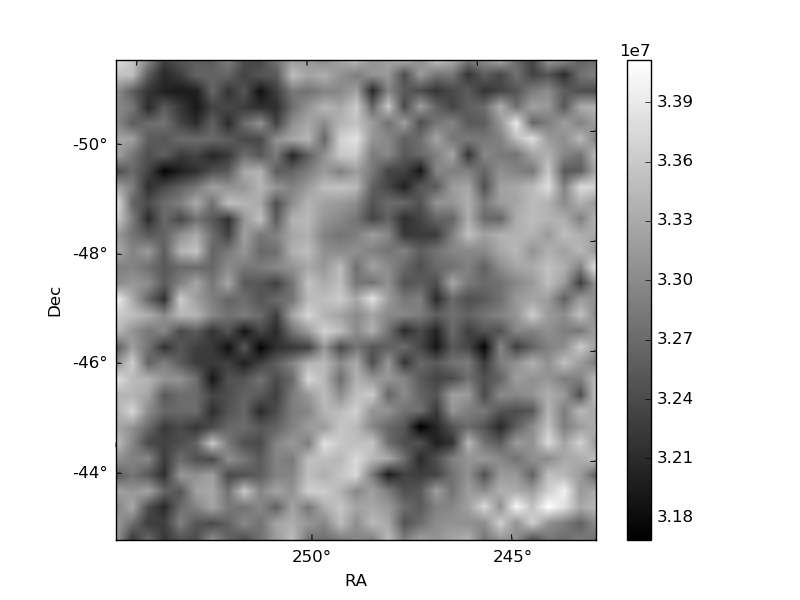
Histogram calculated using DETX and DETY for each event in the final _common_clean file
| Quadrant A | 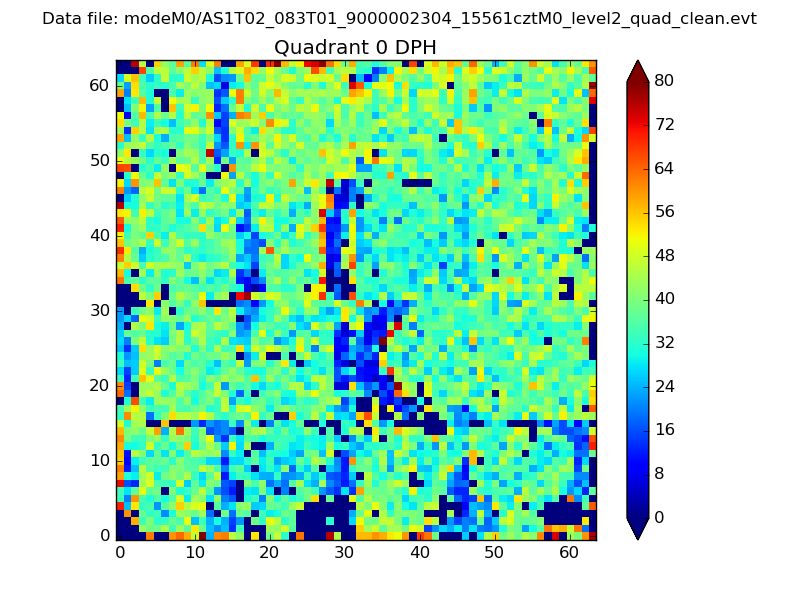 |
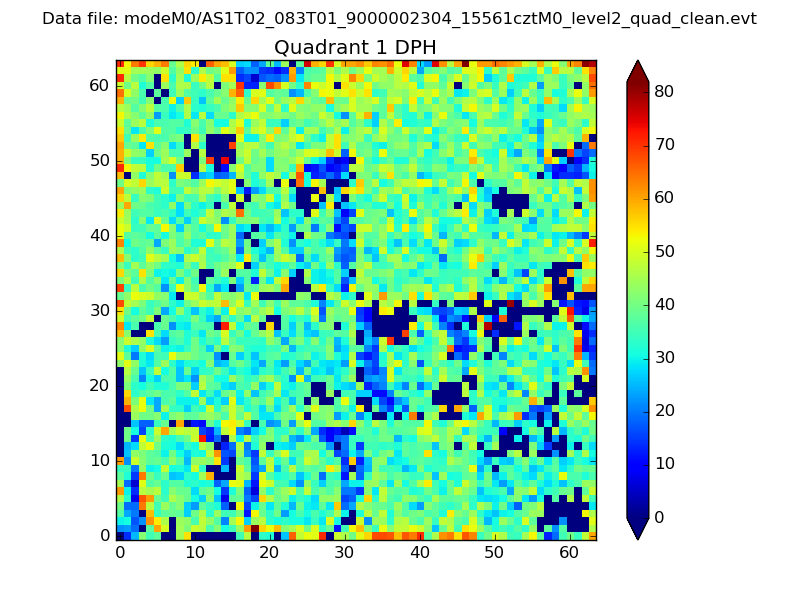 |
Quadrant B |
|---|---|---|---|
| Quadrant D | 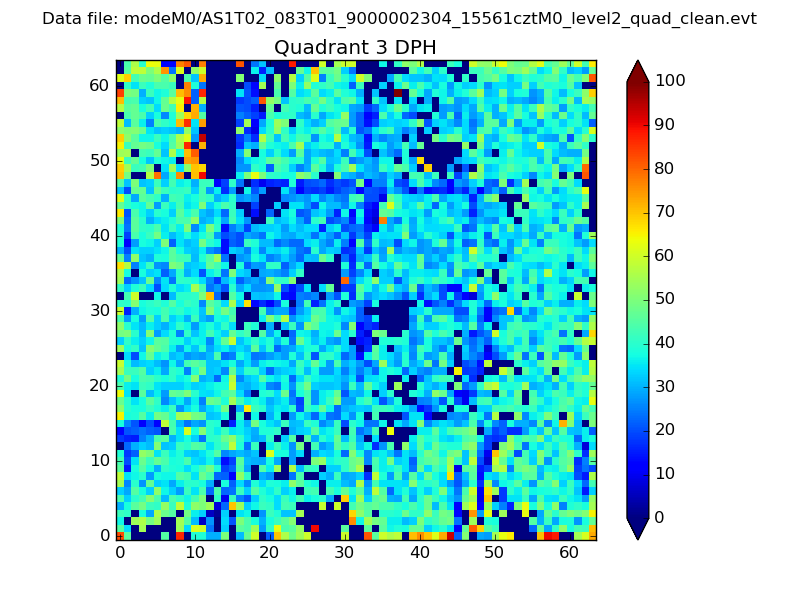 |
 |
Quadrant C |
| Plot type | Count rate plots | Images |
|---|---|---|
| Comparison with Poisson distribution Blue bars denote a histogram of data divided into 1 sec bins. Red curve is a Poisson curve with rate = median count rate of data. |
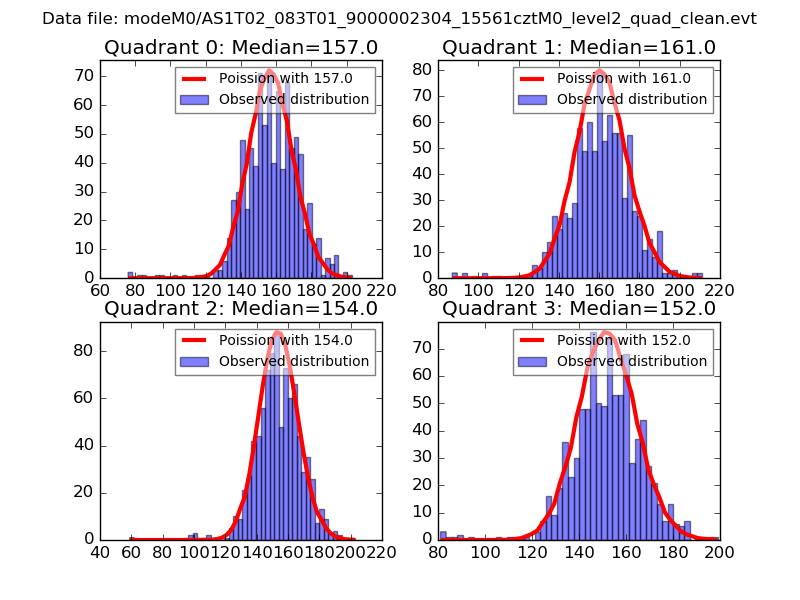 |
 |
| Quadrant-wise count rates Data is divided into 100 sec bins |
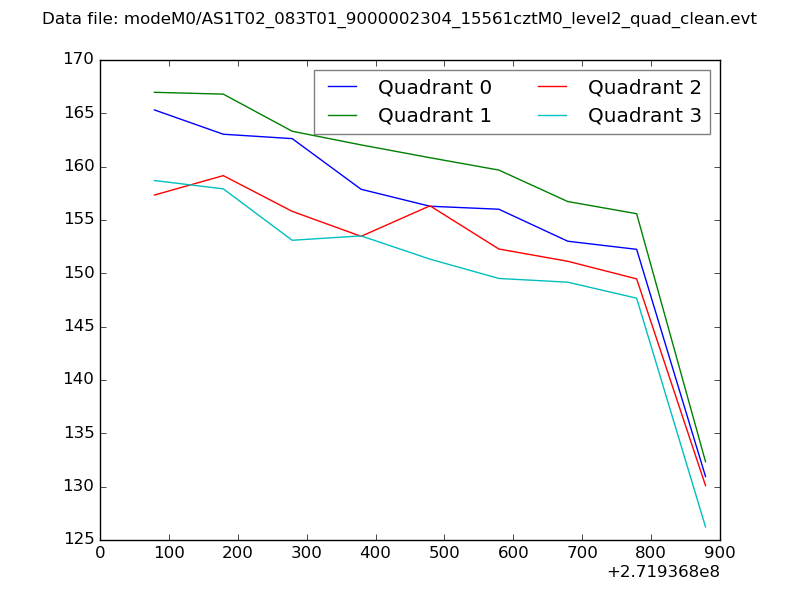 |
|
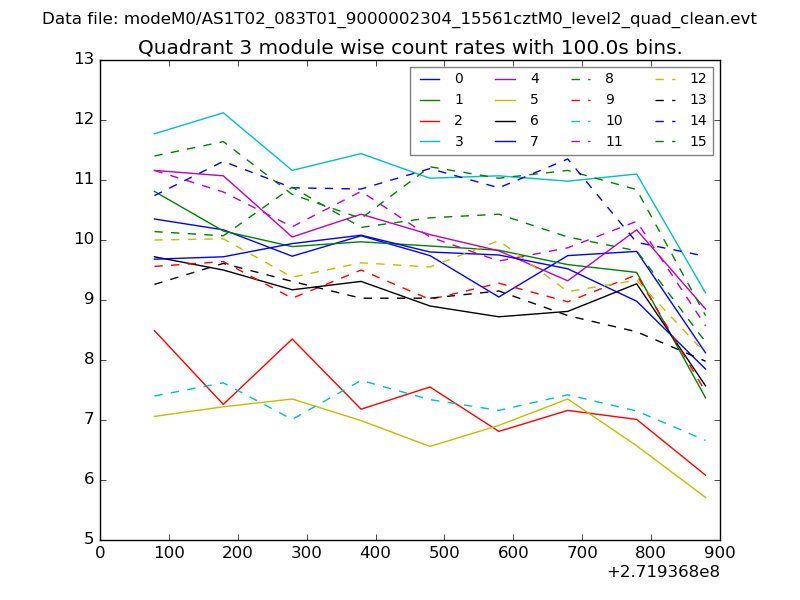
| Module-wise count rates for Quadrant A Data is divided into 100 sec bins |
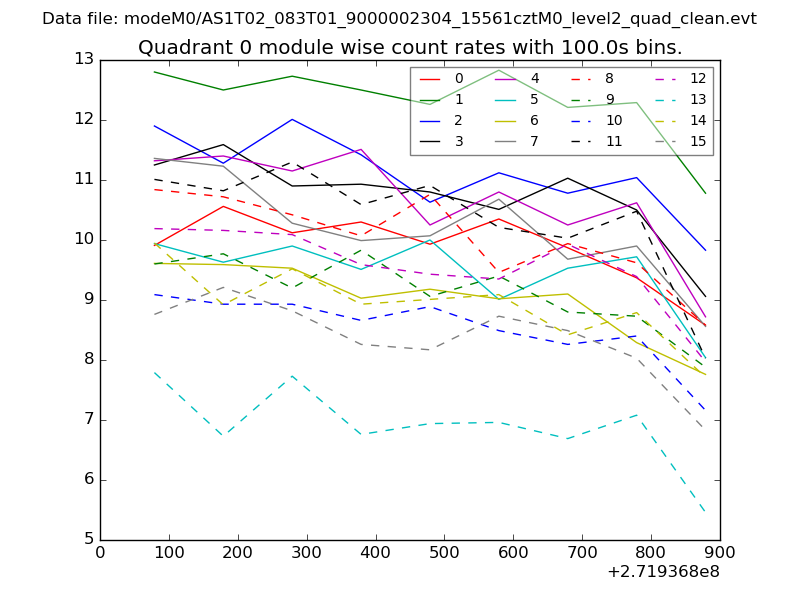 |
 |
| Module-wise count rates for Quadrant B Data is divided into 100 sec bins |
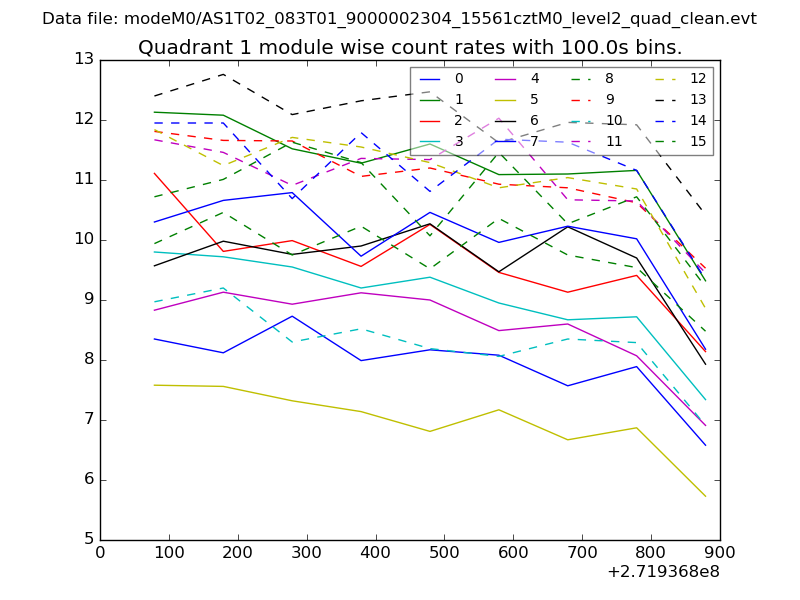 |
 |
| Module-wise count rates for Quadrant C Data is divided into 100 sec bins |
 |
 |
| Module-wise count rates for Quadrant D Data is divided into 100 sec bins |
 |
 |
| Parameter | Plot |
|---|---|
| CZT HV Monitor | 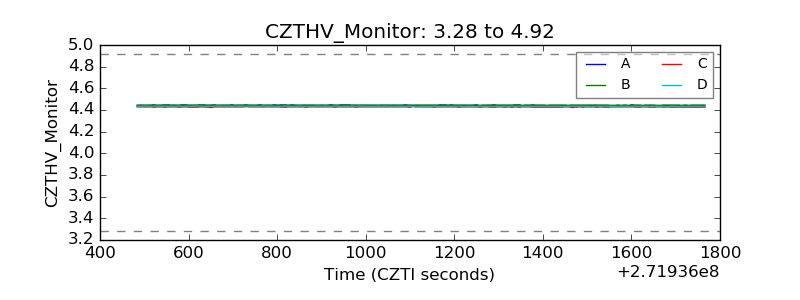 |
| D_VDD | 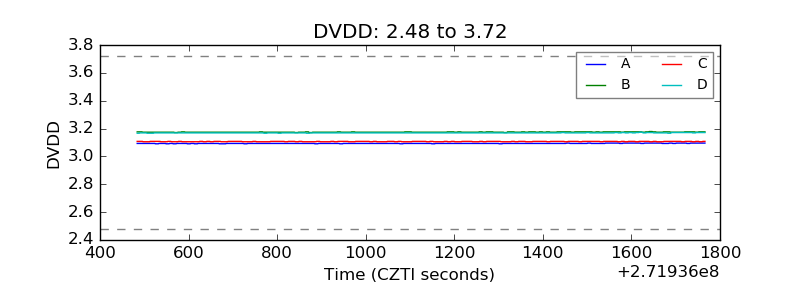 |
| Temperature 1 |  |
| Veto HV Monitor | 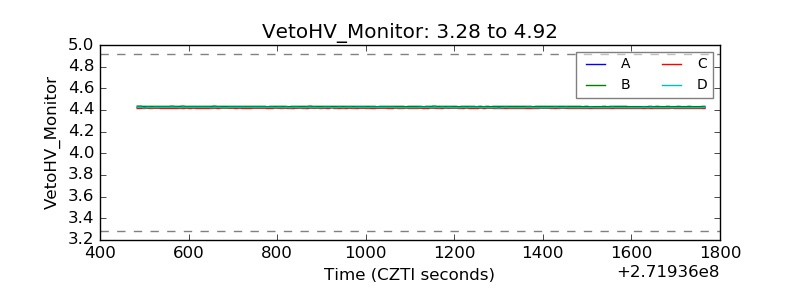 |
| Veto LLD | 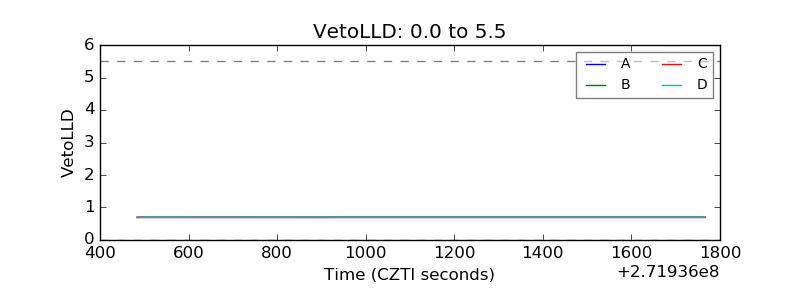 |
| Alpha Counter | 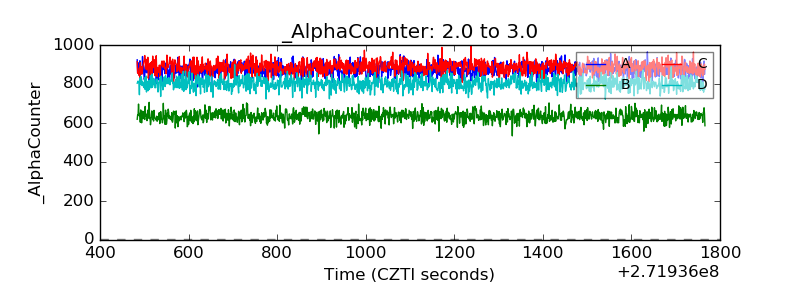 |
| _CPM_Rate | 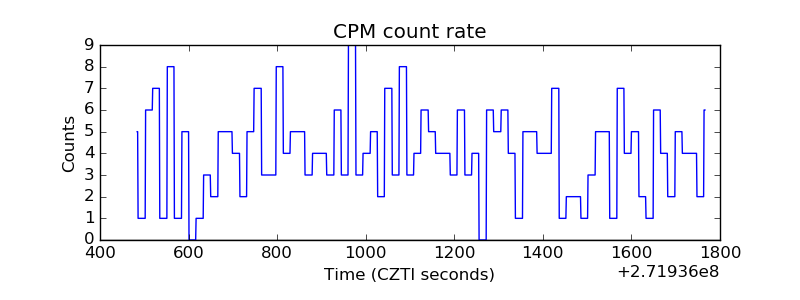 |
| CZT Counter |  |
| +2.5 Volts monitor |  |
| +5 Volts monitor | 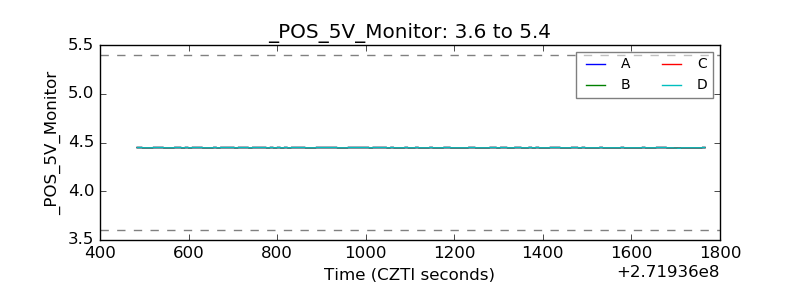 |
| _ROLL_ROT | 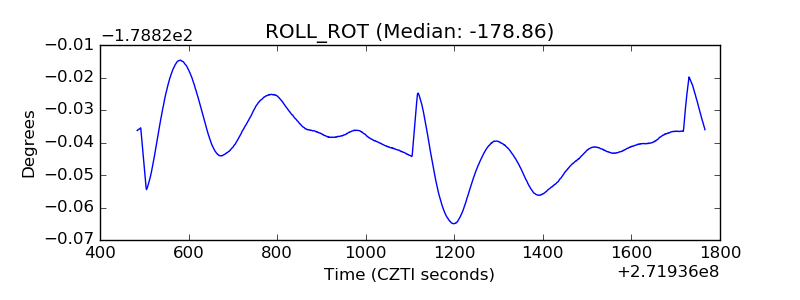 |
| _Roll_DEC | 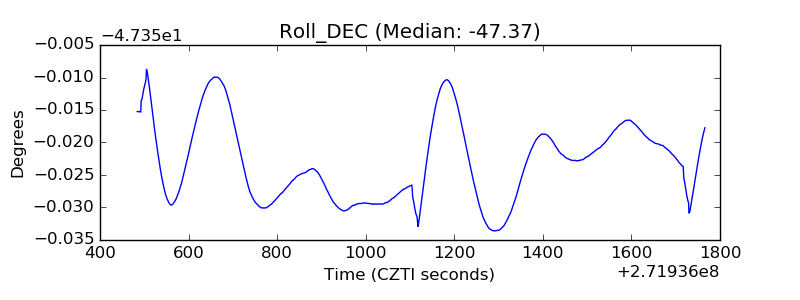 |
| _Roll_RA |  |
| Veto Counter | 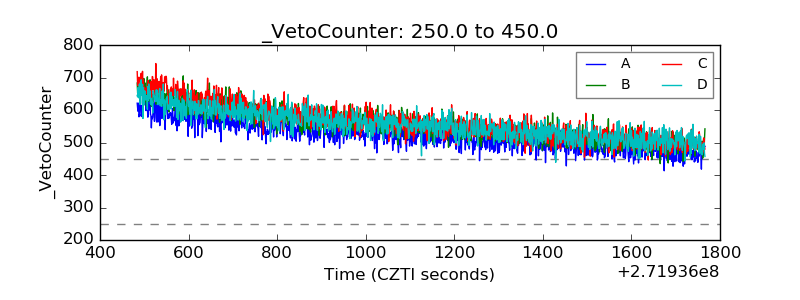 |