| Param | Original file | Final file |
|---|---|---|
| Filename | modeM0/AS1A04_037T02_9000002310cztM0_level2.fits | modeM0/AS1A04_037T02_9000002310cztM0_level2_quad_clean.evt |
| Size (bytes) | 669,337,920 | 514,391,040 |
| Size | 638.3 MB | 490.6 MB |
| Events in quadrant A | 4,102,662 | 2,838,604 |
| Events in quadrant B | 3,952,244 | 2,871,411 |
| Events in quadrant C | 4,035,302 | 2,717,258 |
| Events in quadrant D | 3,524,828 | 2,493,858 |
| Mode SS | |||
|---|---|---|---|
| Quadrant | BADHDUFLAG | Total packets | Discarded packets |
| A | 0 | 1384 | 0 |
| B | 0 | 1384 | 0 |
| C | 0 | 1384 | 0 |
| D | 0 | 1384 | 0 |
| Mode M0 | |||
|---|---|---|---|
| Quadrant | BADHDUFLAG | Total packets | Discarded packets |
| A | 0 | 155199 | 0 |
| B | 0 | 144164 | 0 |
| C | 0 | 142701 | 0 |
| D | 0 | 163783 | 0 |
| Mode M9 | |||
|---|---|---|---|
| Quadrant | BADHDUFLAG | Total packets | Discarded packets |
| A | 0 | 113 | 0 |
| B | 0 | 113 | 0 |
| C | 0 | 113 | 0 |
| D | 0 | 113 | 0 |
| Quadrant | Total seconds | Saturated seconds | Saturation percentage |
|---|---|---|---|
| A | 67883 | 1547 | 2.278921% |
| B | 67883 | 1041 | 1.533521% |
| C | 67883 | 1081 | 1.592446% |
| D | 67883 | 1895 | 2.791568% |
Noise dominated data is calculated using 1-second bins in cleaned event files. If a bin has >2000 counts, and if more than 50% of those come from <1% of pixels, then it is considered to be noise-dominated and hence unusable.
| Quadrant | # 1 sec bins | Bins with >0 counts | Bins with >2000 counts | High rate bins dominated by noise | Noise dominated (total time) | Noise dominated (detector-on time) | Marked lightcurve |
|---|---|---|---|---|---|---|---|
| A | 79263 | 67874 | 0 | 0 | 0.00% | 0.00% |  |
| B | 79263 | 67871 | 0 | 0 | 0.00% | 0.00% |  |
| C | 79263 | 67873 | 0 | 0 | 0.00% | 0.00% | 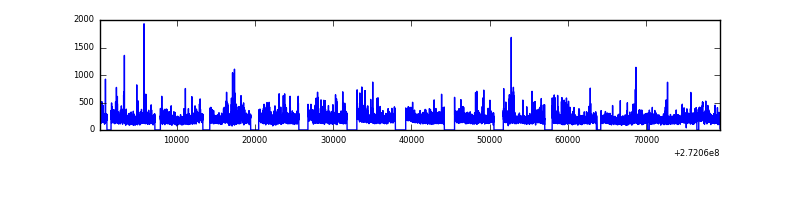 |
| D | 79263 | 67856 | 0 | 0 | 0.00% | 0.00% |  |
Top three noisy pixels from each quadrant. If the there are fewer than three noisy pixels in the level2.evt file, extra rows are filled as -1
| Pixel properties | Quadrant properties | ||||||
|---|---|---|---|---|---|---|---|
| Quadrant | DetID | PixID | Counts | Sigma | Mean | Median | Sigma |
| A | 0 | 29 | 3804 | 10.73 | 1068 | 1000 | 261.3 |
| A | 7 | 110 | 3263 | 8.66 | 1068 | 1000 | 261.3 |
| A | 9 | 19 | 3002 | 7.66 | 1068 | 1000 | 261.3 |
| B | 2 | 9 | 3253 | 10.9 | 1044 | 995 | 207.1 |
| B | 2 | 8 | 2708 | 8.27 | 1044 | 995 | 207.1 |
| B | 3 | 17 | 2655 | 8.02 | 1044 | 995 | 207.1 |
| C | 1 | 81 | 3099 | 7.73 | 1063 | 992 | 272.6 |
| C | 1 | 80 | 3078 | 7.65 | 1063 | 992 | 272.6 |
| C | 12 | 241 | 2802 | 6.64 | 1063 | 992 | 272.6 |
| D | 6 | 231 | 2539 | 6.08 | 1007 | 918 | 266.5 |
| D | 3 | 14 | 2510 | 5.97 | 1007 | 918 | 266.5 |
| D | 6 | 38 | 2426 | 5.66 | 1007 | 918 | 266.5 |
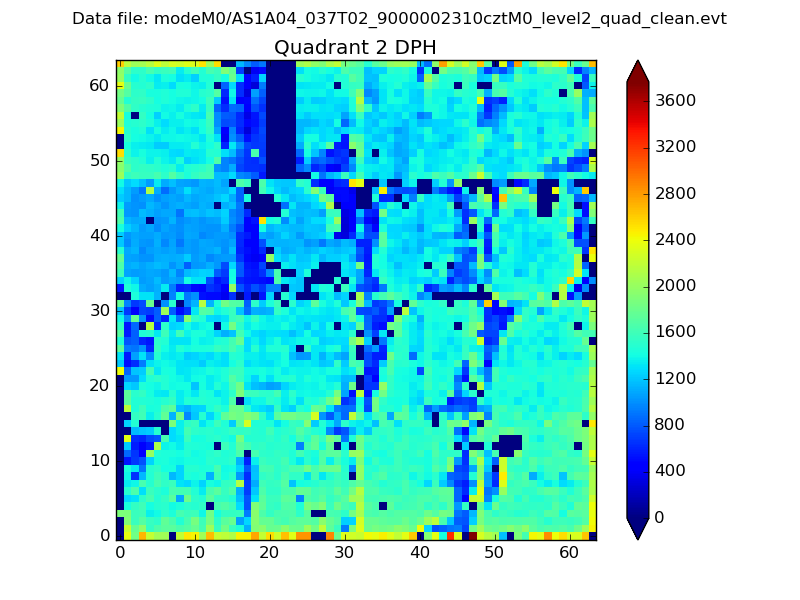
Histogram calculated using DETX and DETY for each event in the final _common_clean file
| Quadrant A | 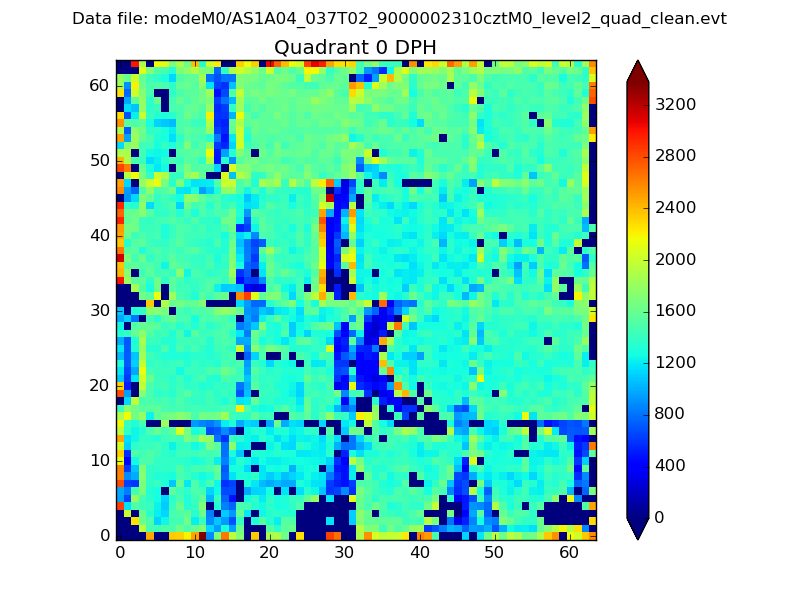 |
 |
Quadrant B |
|---|---|---|---|
| Quadrant D |  |
 |
Quadrant C |
| Plot type | Count rate plots | Images |
|---|---|---|
| Comparison with Poisson distribution Blue bars denote a histogram of data divided into 1 sec bins. Red curve is a Poisson curve with rate = median count rate of data. |
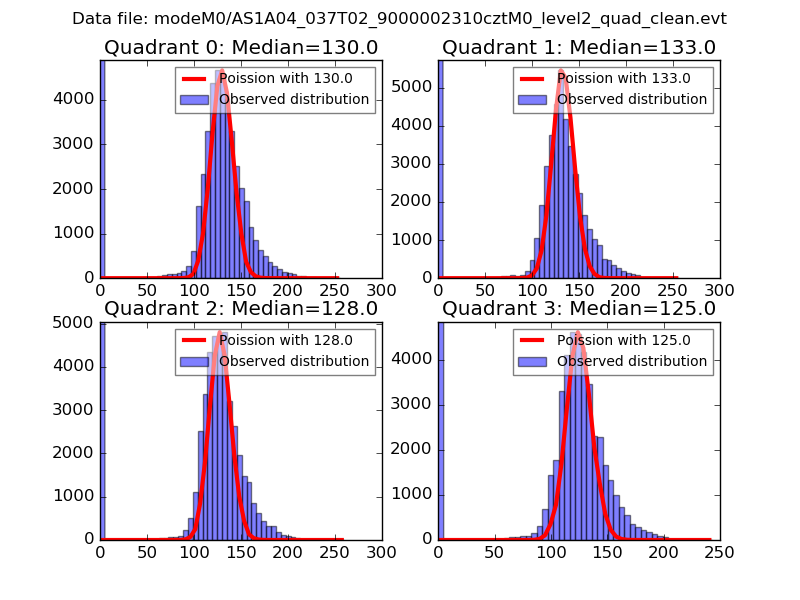 |
 |
| Quadrant-wise count rates Data is divided into 100 sec bins |
 |
|
| Module-wise count rates for Quadrant A Data is divided into 100 sec bins |
 |
 |
| Module-wise count rates for Quadrant B Data is divided into 100 sec bins |
 |
 |
| Module-wise count rates for Quadrant C Data is divided into 100 sec bins |
 |
 |
| Module-wise count rates for Quadrant D Data is divided into 100 sec bins |
 |
 |
| Parameter | Plot |
|---|---|
| CZT HV Monitor |  |
| D_VDD |  |
| Temperature 1 |  |
| Veto HV Monitor | 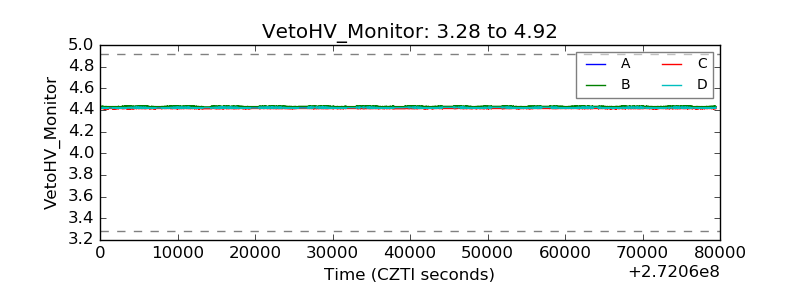 |
| Veto LLD | 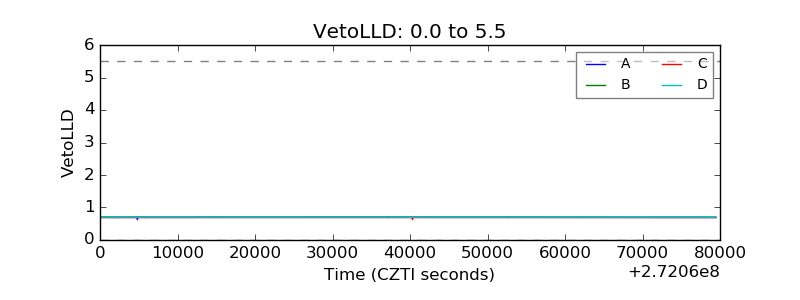 |
| Alpha Counter |  |
| _CPM_Rate |  |
| CZT Counter | 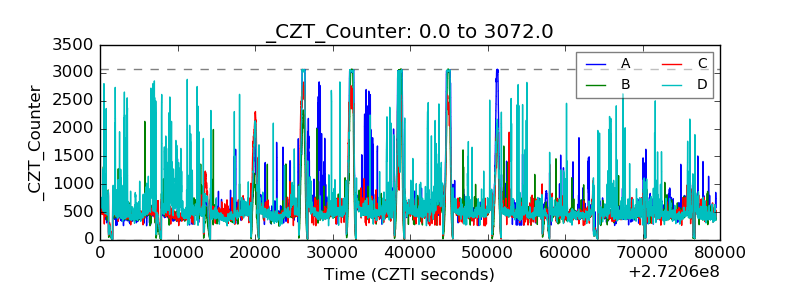 |
| +2.5 Volts monitor |  |
| +5 Volts monitor |  |
| _ROLL_ROT | 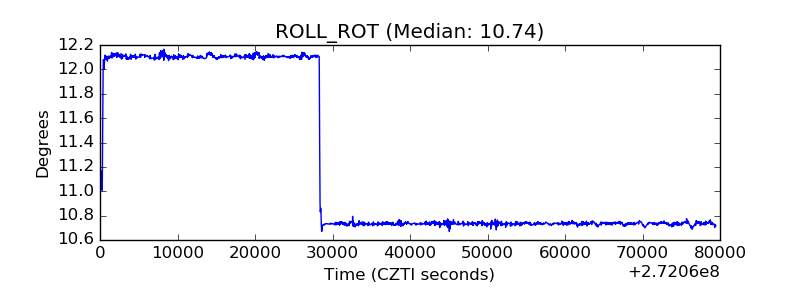 |
| _Roll_DEC |  |
| _Roll_RA |  |
| Veto Counter | 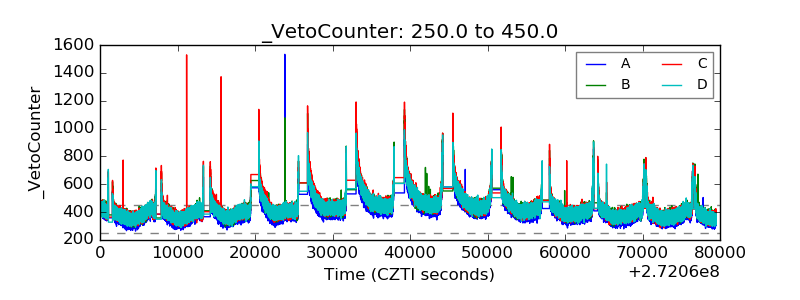 |