| Param | Original file | Final file |
|---|---|---|
| Filename | modeM0/AS1A04_037T02_9000002310_15582cztM0_level2.evt | modeM0/AS1A04_037T02_9000002310_15582cztM0_level2_quad_clean.evt |
| Size (bytes) | 610,116,480 | 96,868,800 |
| Size | 581.9 MB | 92.4 MB |
| Events in quadrant A | 3,778,467 | 607,821 |
| Events in quadrant B | 3,985,442 | 614,882 |
| Events in quadrant C | 3,946,557 | 589,978 |
| Events in quadrant D | 6,225,236 | 565,153 |
| Mode SS | |||
|---|---|---|---|
| Quadrant | BADHDUFLAG | Total packets | Discarded packets |
| A | 0 | 162 | 0 |
| B | 0 | 162 | 0 |
| C | 0 | 162 | 0 |
| D | 0 | 162 | 0 |
| Mode M0 | |||
|---|---|---|---|
| Quadrant | BADHDUFLAG | Total packets | Discarded packets |
| A | 0 | 16388 | 3 |
| B | 0 | 16881 | 2 |
| C | 0 | 16593 | 2 |
| D | 0 | 24020 | 2 |
| Mode M9 | |||
|---|---|---|---|
| Quadrant | BADHDUFLAG | Total packets | Discarded packets |
| A | 0 | 13 | 0 |
| B | 0 | 13 | 0 |
| C | 0 | 13 | 0 |
| D | 0 | 13 | 0 |
| Quadrant | Total seconds | Saturated seconds | Saturation percentage |
|---|---|---|---|
| A | 7999 | 64 | 0.800100% |
| B | 7999 | 90 | 1.125141% |
| C | 7999 | 105 | 1.312664% |
| D | 7999 | 563 | 7.038380% |
Noise dominated data is calculated using 1-second bins in cleaned event files. If a bin has >2000 counts, and if more than 50% of those come from <1% of pixels, then it is considered to be noise-dominated and hence unusable.
| Quadrant | # 1 sec bins | Bins with >0 counts | Bins with >2000 counts | High rate bins dominated by noise | Noise dominated (total time) | Noise dominated (detector-on time) | Marked lightcurve |
|---|---|---|---|---|---|---|---|
| A | 9245 | 8001 | 0 | 0 | 0.00% | 0.00% | 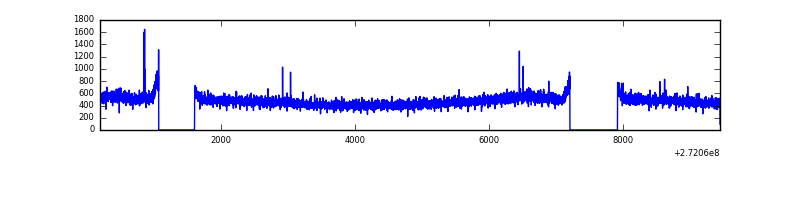 |
| B | 9245 | 8001 | 6 | 6 | 0.06% | 0.07% | 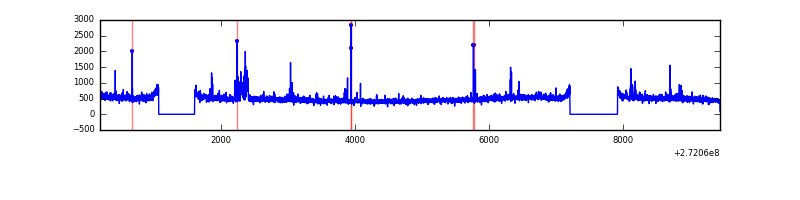 |
| C | 9245 | 8000 | 2 | 2 | 0.02% | 0.03% | 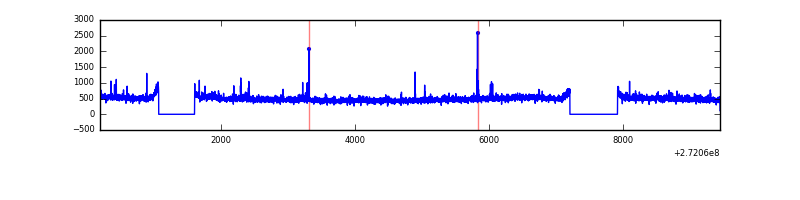 |
| D | 9245 | 8000 | 471 | 471 | 5.09% | 5.89% | 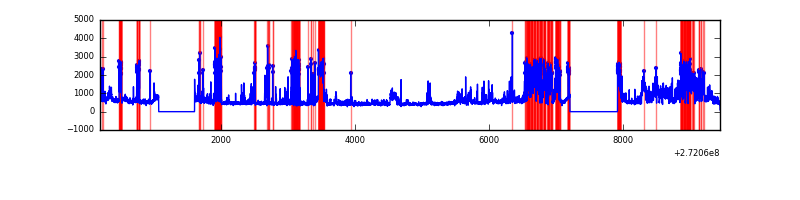 |
Top three noisy pixels from each quadrant. If the there are fewer than three noisy pixels in the level2.evt file, extra rows are filled as -1
| Pixel properties | Quadrant properties | ||||||
|---|---|---|---|---|---|---|---|
| Quadrant | DetID | PixID | Counts | Sigma | Mean | Median | Sigma |
| A | 13 | 248 | 10485 | 47.66 | 977 | 955 | 199.9 |
| A | 0 | 226 | 8838 | 39.43 | 977 | 955 | 199.9 |
| A | 9 | 143 | 7792 | 34.2 | 977 | 955 | 199.9 |
| B | 0 | 189 | 44738 | 232.17 | 978 | 953 | 188.6 |
| B | 4 | 216 | 26306 | 134.43 | 978 | 953 | 188.6 |
| B | 0 | 197 | 22671 | 115.16 | 978 | 953 | 188.6 |
| C | 14 | 238 | 142041 | 643.98 | 938 | 943 | 219.1 |
| C | 3 | 233 | 73343 | 330.44 | 938 | 943 | 219.1 |
| C | 0 | 207 | 38055 | 169.38 | 938 | 943 | 219.1 |
| D | 12 | 110 | 1367018 | 6053.42 | 923 | 895 | 225.7 |
| D | 1 | 52 | 1223150 | 5415.93 | 923 | 895 | 225.7 |
| D | 2 | 234 | 39712 | 172.0 | 923 | 895 | 225.7 |
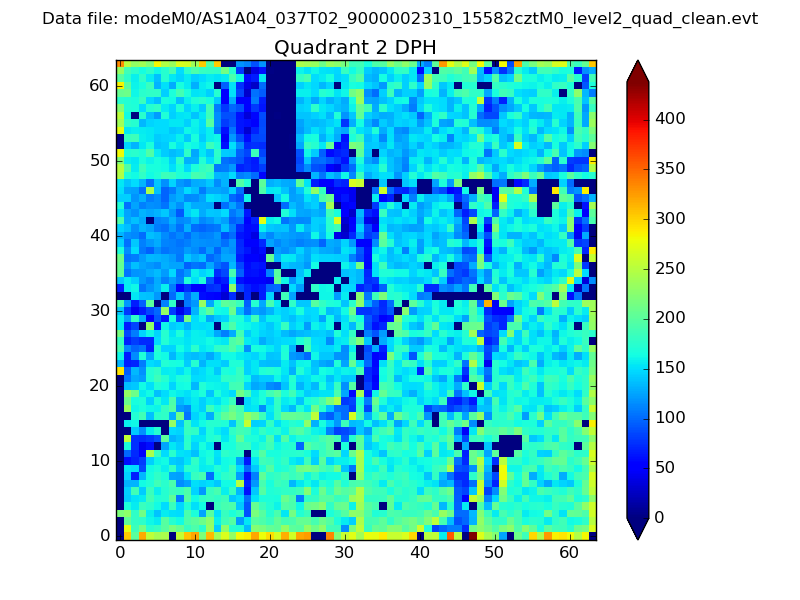
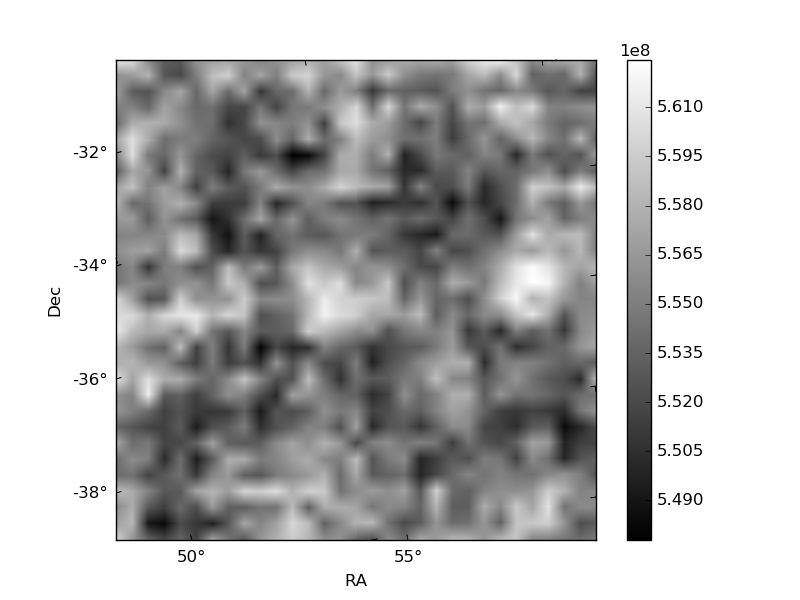
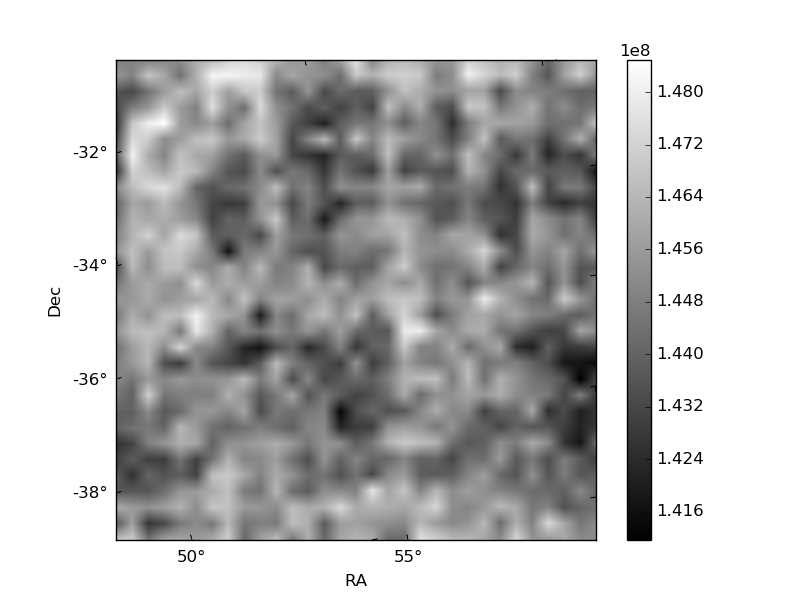
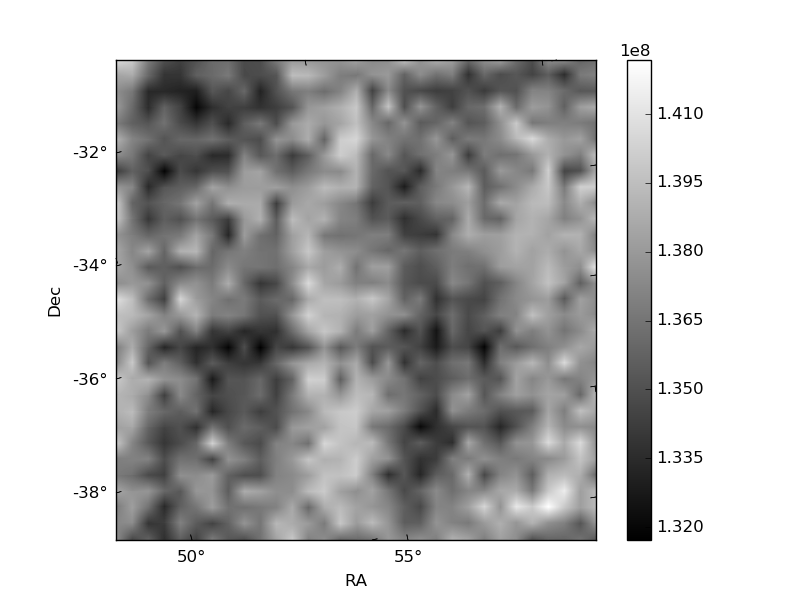
Histogram calculated using DETX and DETY for each event in the final _common_clean file
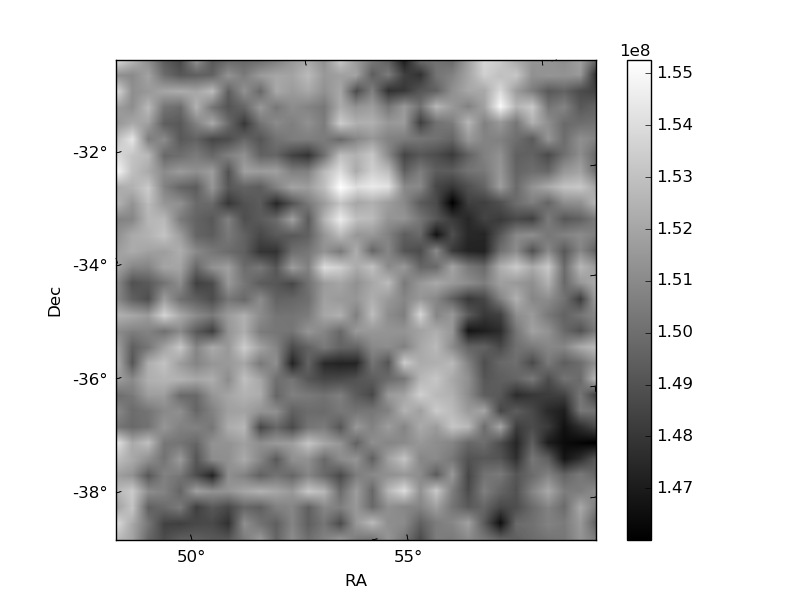
| Quadrant A | 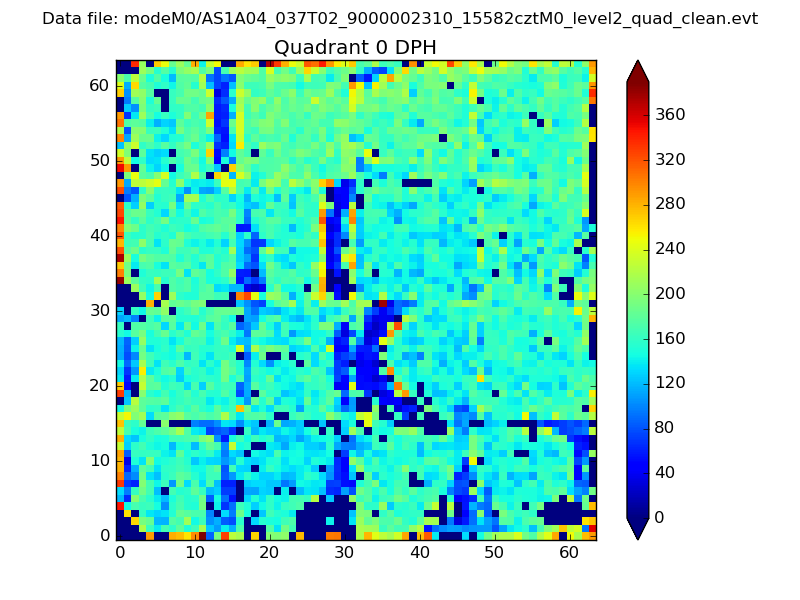 |
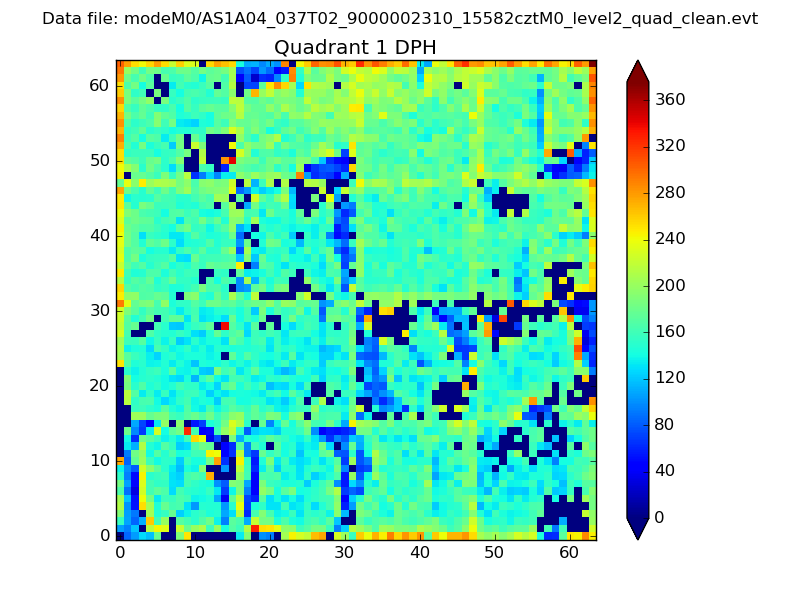 |
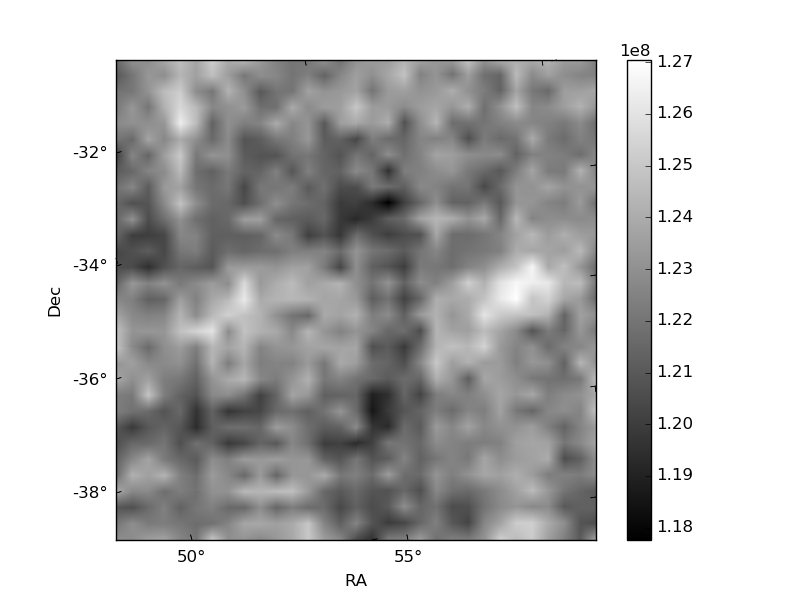
Quadrant B |
|---|---|---|---|
| Quadrant D | 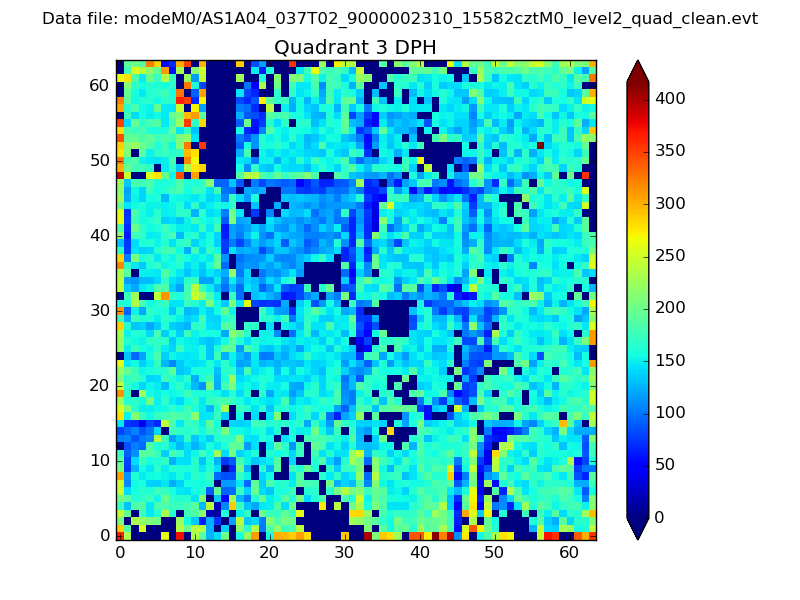 |
 |
Quadrant C |
| Plot type | Count rate plots | Images |
|---|---|---|
| Comparison with Poisson distribution Blue bars denote a histogram of data divided into 1 sec bins. Red curve is a Poisson curve with rate = median count rate of data. |
 |
 |
| Quadrant-wise count rates Data is divided into 100 sec bins |
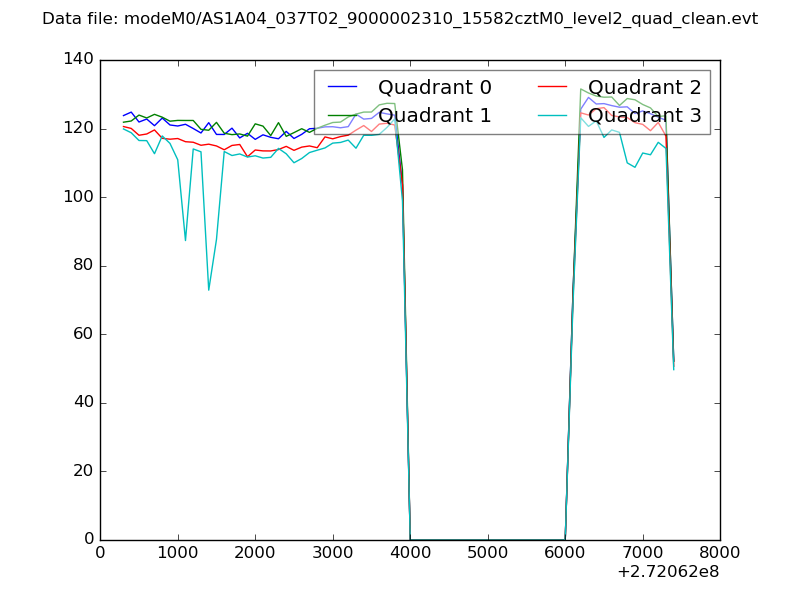 |
|
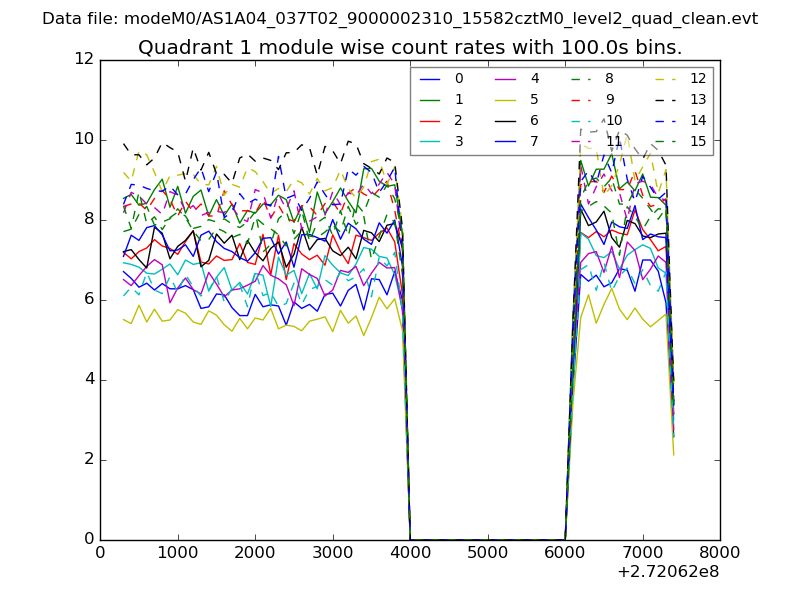
| Module-wise count rates for Quadrant A Data is divided into 100 sec bins |
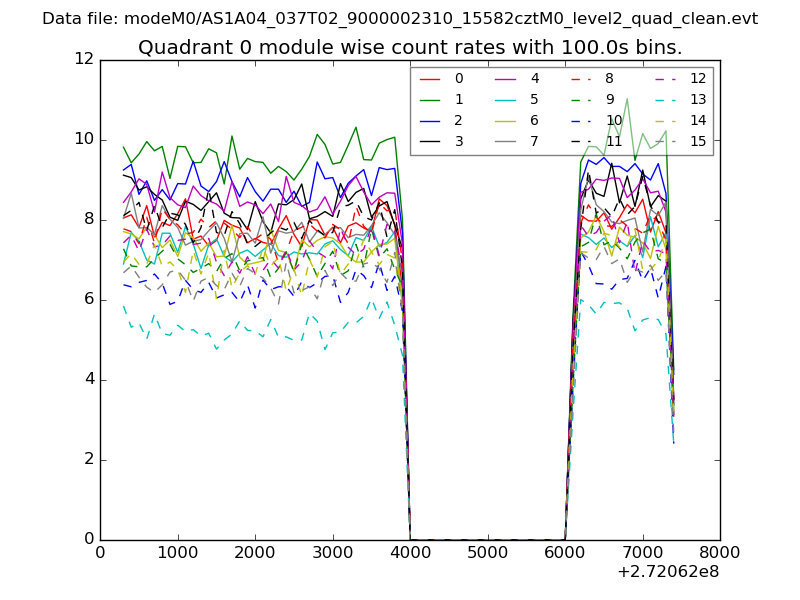 |
 |
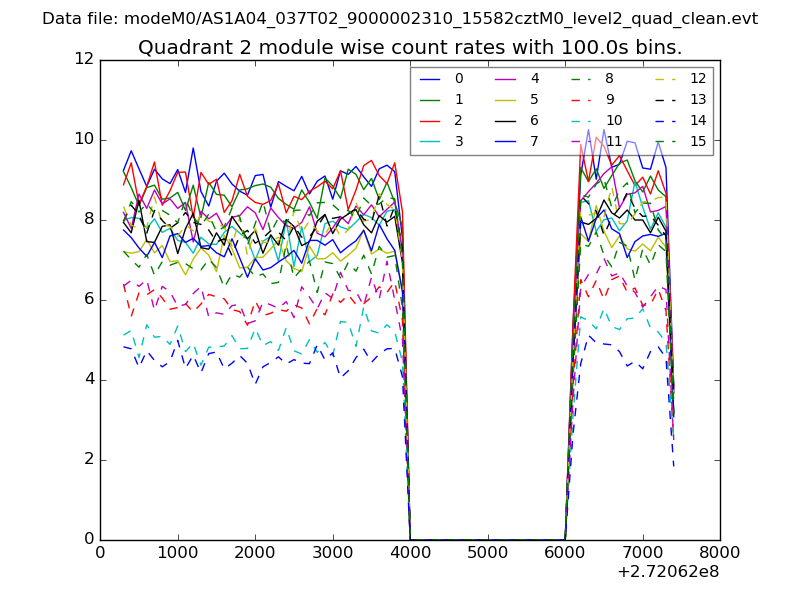
| Module-wise count rates for Quadrant B Data is divided into 100 sec bins |
 |
 |
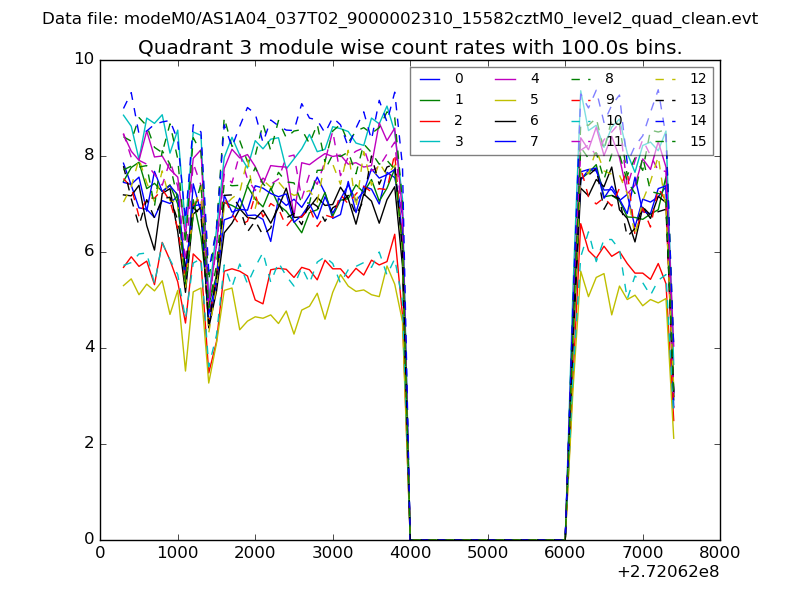
| Module-wise count rates for Quadrant C Data is divided into 100 sec bins |
 |
 |
| Module-wise count rates for Quadrant D Data is divided into 100 sec bins |
 |
 |
| Parameter | Plot |
|---|---|
| CZT HV Monitor | 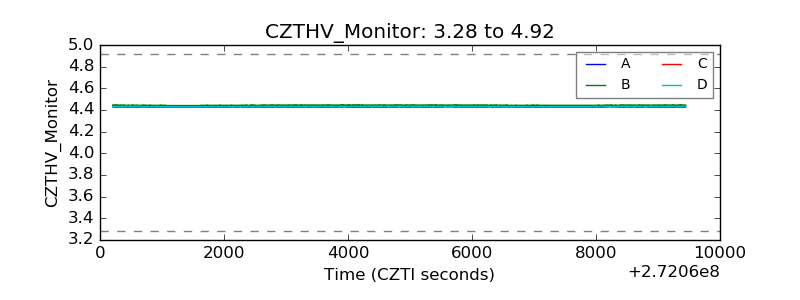 |
| D_VDD | 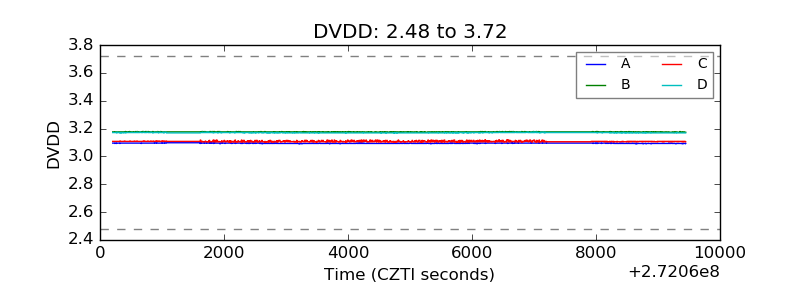 |
| Temperature 1 | 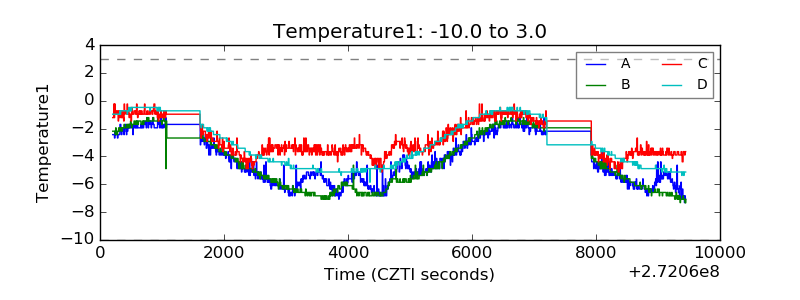 |
| Veto HV Monitor | 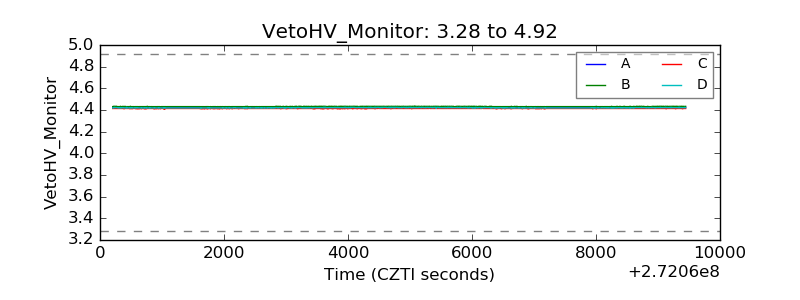 |
| Veto LLD |  |
| Alpha Counter | 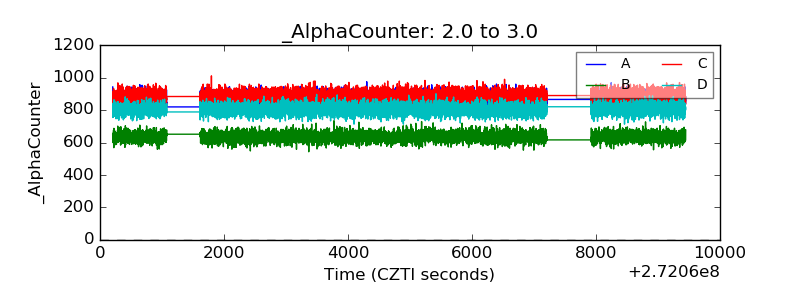 |
| _CPM_Rate | 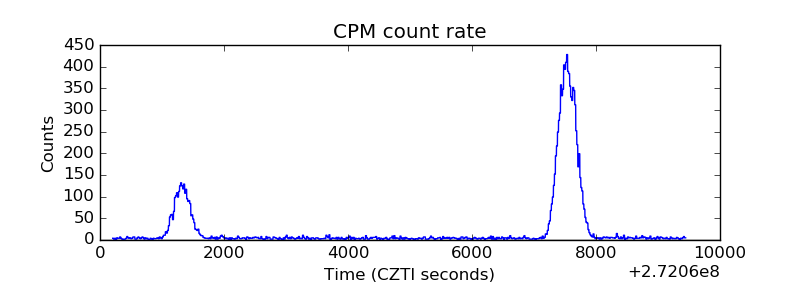 |
| CZT Counter | 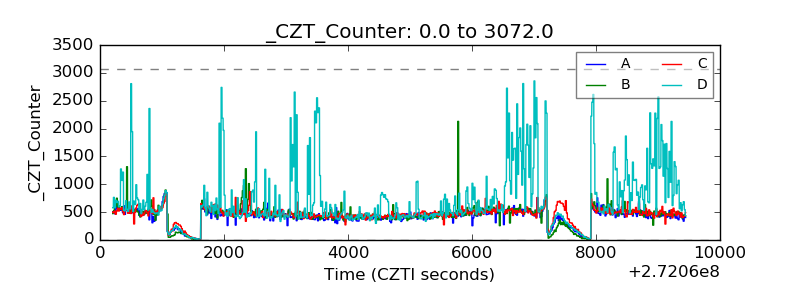 |
| +2.5 Volts monitor | 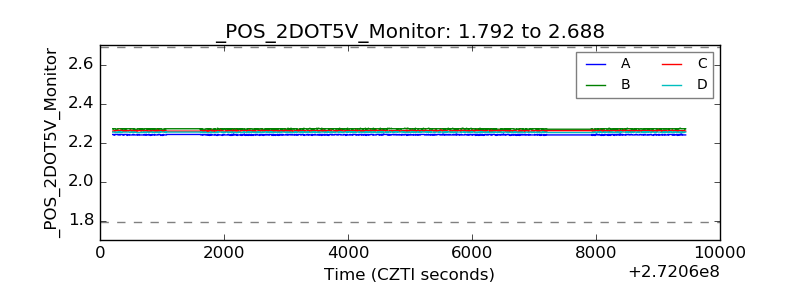 |
| +5 Volts monitor |  |
| _ROLL_ROT | 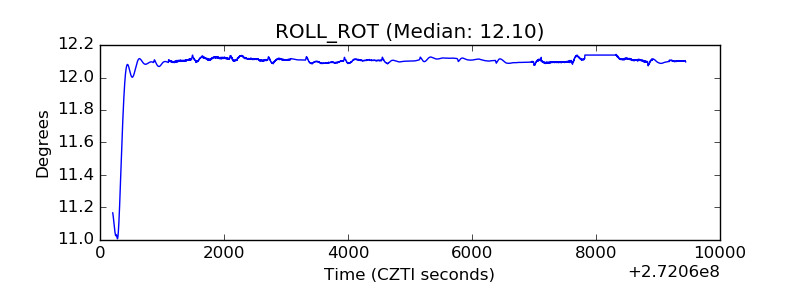 |
| _Roll_DEC | 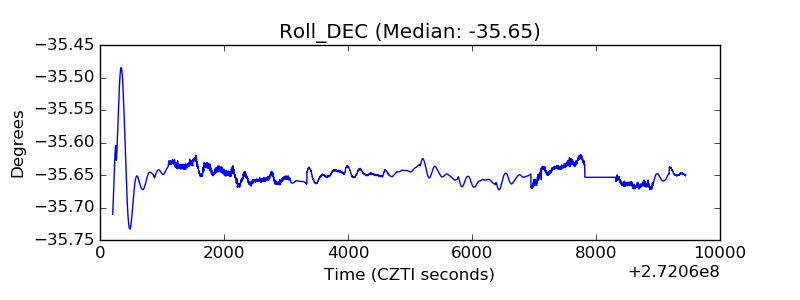 |
| _Roll_RA | 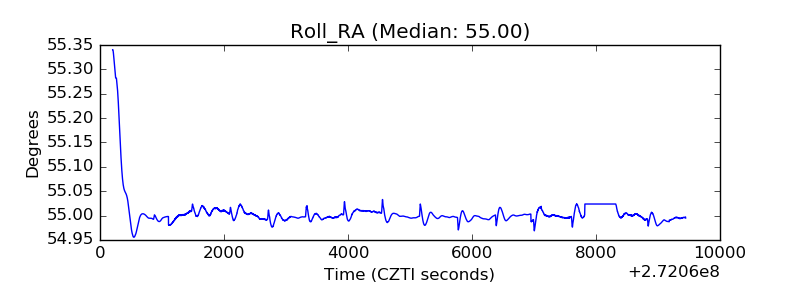 |
| Veto Counter | 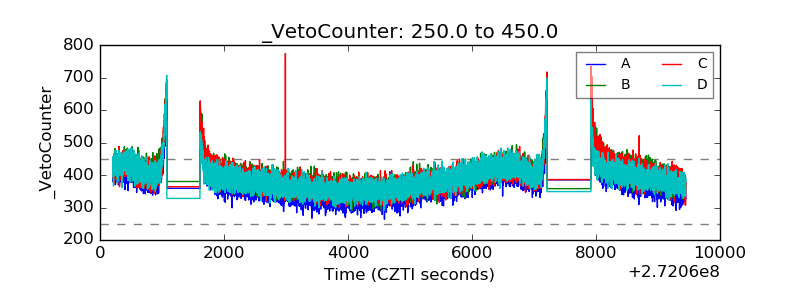 |