| Param | Original file | Final file |
|---|---|---|
| Filename | modeM0/AS1A04_037T02_9000002310_15586cztM0_level2.evt | modeM0/AS1A04_037T02_9000002310_15586cztM0_level2_quad_clean.evt |
| Size (bytes) | 481,314,240 | 94,947,840 |
| Size | 459.0 MB | 90.5 MB |
| Events in quadrant A | 4,011,007 | 599,726 |
| Events in quadrant B | 3,280,681 | 628,418 |
| Events in quadrant C | 3,334,610 | 606,336 |
| Events in quadrant D | 3,510,969 | 589,492 |
| Mode SS | |||
|---|---|---|---|
| Quadrant | BADHDUFLAG | Total packets | Discarded packets |
| A | 0 | 134 | 0 |
| B | 0 | 134 | 0 |
| C | 0 | 134 | 0 |
| D | 0 | 134 | 0 |
| Mode M0 | |||
|---|---|---|---|
| Quadrant | BADHDUFLAG | Total packets | Discarded packets |
| A | 0 | 15857 | 3 |
| B | 0 | 13810 | 2 |
| C | 0 | 13920 | 2 |
| D | 0 | 14775 | 2 |
| Mode M9 | |||
|---|---|---|---|
| Quadrant | BADHDUFLAG | Total packets | Discarded packets |
| A | 0 | 19 | 0 |
| B | 0 | 19 | 0 |
| C | 0 | 19 | 0 |
| D | 0 | 20 | 0 |
| Quadrant | Total seconds | Saturated seconds | Saturation percentage |
|---|---|---|---|
| A | 6463 | 171 | 2.645830% |
| B | 6463 | 58 | 0.897416% |
| C | 6463 | 64 | 0.990252% |
| D | 6463 | 47 | 0.727216% |
Noise dominated data is calculated using 1-second bins in cleaned event files. If a bin has >2000 counts, and if more than 50% of those come from <1% of pixels, then it is considered to be noise-dominated and hence unusable.
| Quadrant | # 1 sec bins | Bins with >0 counts | Bins with >2000 counts | High rate bins dominated by noise | Noise dominated (total time) | Noise dominated (detector-on time) | Marked lightcurve |
|---|---|---|---|---|---|---|---|
| A | 7633 | 6464 | 90 | 90 | 1.18% | 1.39% | 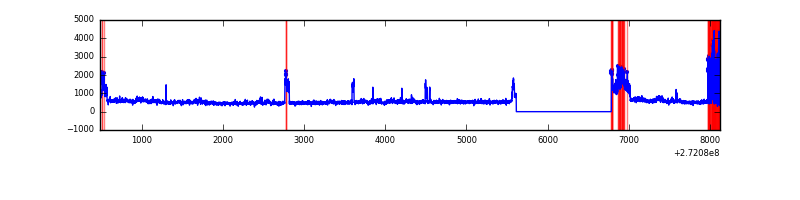 |
| B | 7634 | 6465 | 4 | 4 | 0.05% | 0.06% | 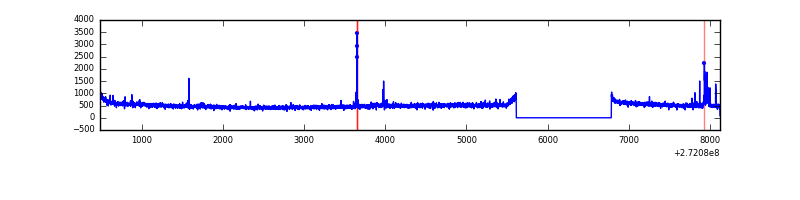 |
| C | 7634 | 6465 | 0 | 0 | 0.00% | 0.00% | 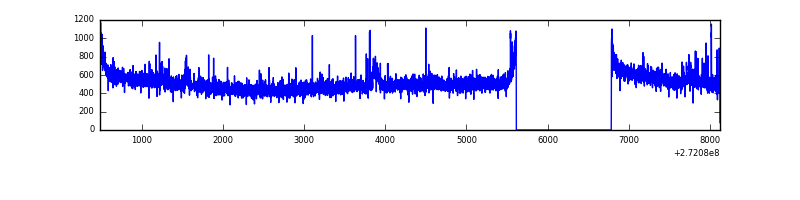 |
| D | 7634 | 6465 | 11 | 11 | 0.14% | 0.17% | 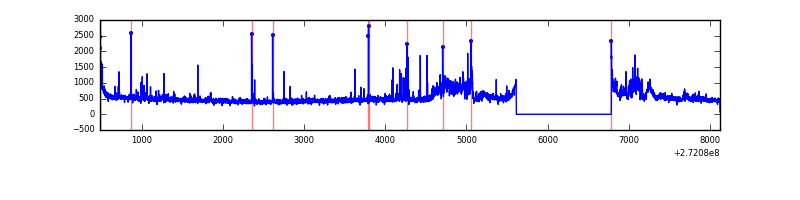 |
Top three noisy pixels from each quadrant. If the there are fewer than three noisy pixels in the level2.evt file, extra rows are filled as -1
| Pixel properties | Quadrant properties | ||||||
|---|---|---|---|---|---|---|---|
| Quadrant | DetID | PixID | Counts | Sigma | Mean | Median | Sigma |
| A | 0 | 253 | 716348 | 4398.21 | 807 | 791 | 162.7 |
| A | 15 | 69 | 182267 | 1115.45 | 807 | 791 | 162.7 |
| A | 0 | 226 | 7131 | 38.97 | 807 | 791 | 162.7 |
| B | 4 | 48 | 62770 | 400.25 | 815 | 793 | 154.8 |
| B | 12 | 111 | 17636 | 108.77 | 815 | 793 | 154.8 |
| B | 11 | 111 | 15154 | 92.74 | 815 | 793 | 154.8 |
| C | 14 | 238 | 121038 | 640.45 | 798 | 805 | 187.7 |
| C | 3 | 233 | 102138 | 539.77 | 798 | 805 | 187.7 |
| C | 13 | 61 | 5644 | 25.78 | 798 | 805 | 187.7 |
| D | 2 | 16 | 215620 | 1096.18 | 804 | 782 | 196.0 |
| D | 7 | 223 | 72522 | 366.04 | 804 | 782 | 196.0 |
| D | 1 | 52 | 56610 | 284.85 | 804 | 782 | 196.0 |
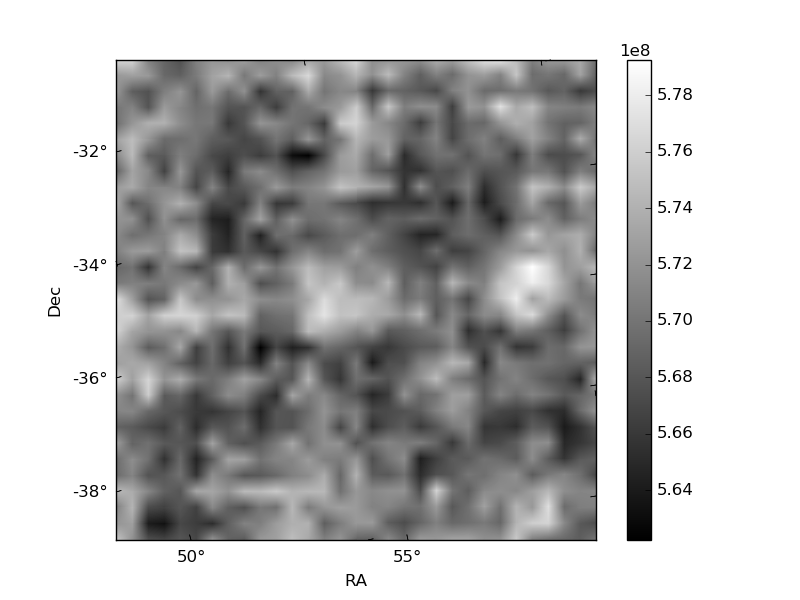
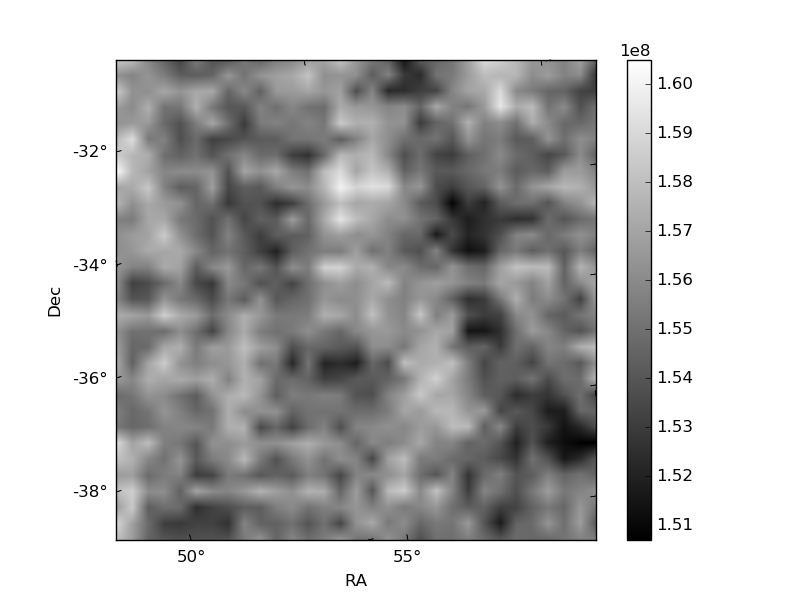
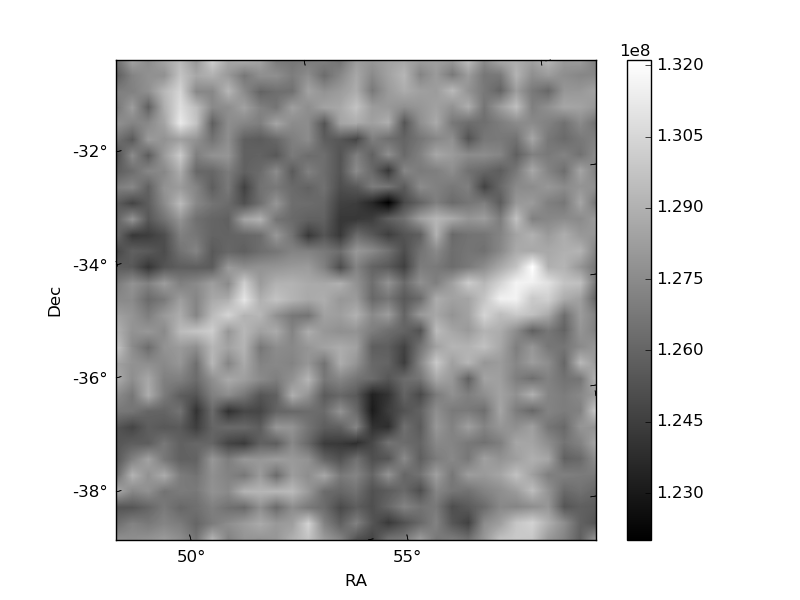
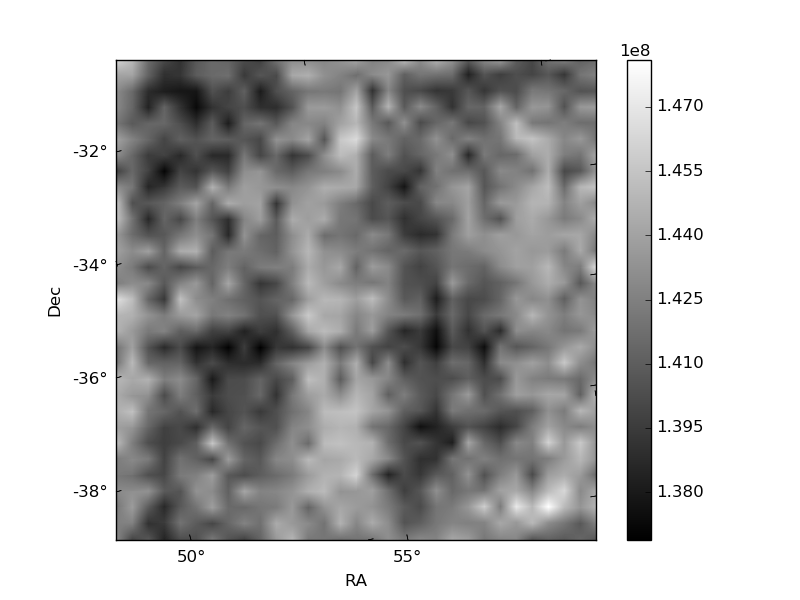
Histogram calculated using DETX and DETY for each event in the final _common_clean file
| Quadrant A | 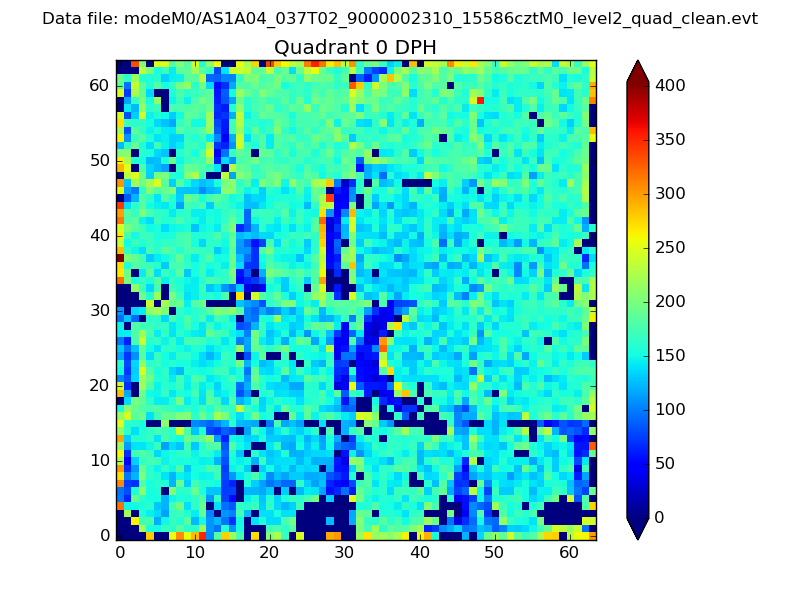 |
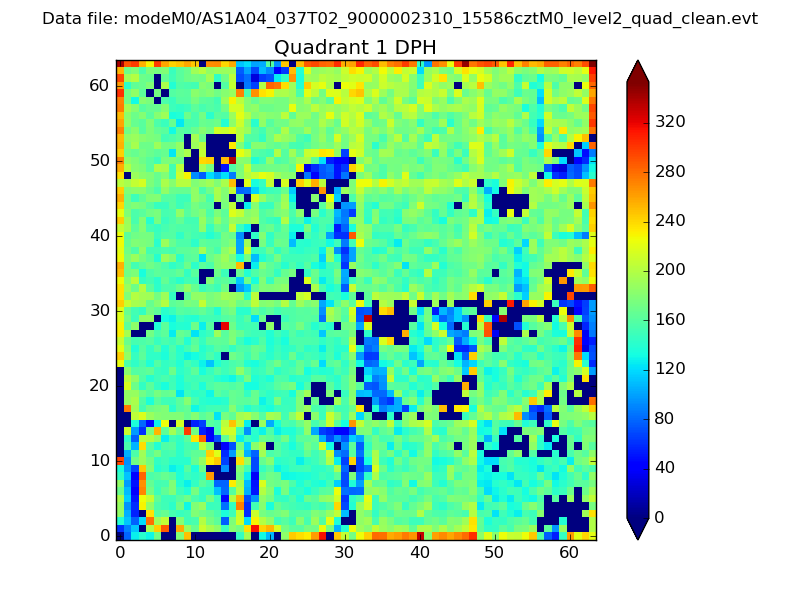 |
Quadrant B |
|---|---|---|---|
| Quadrant D | 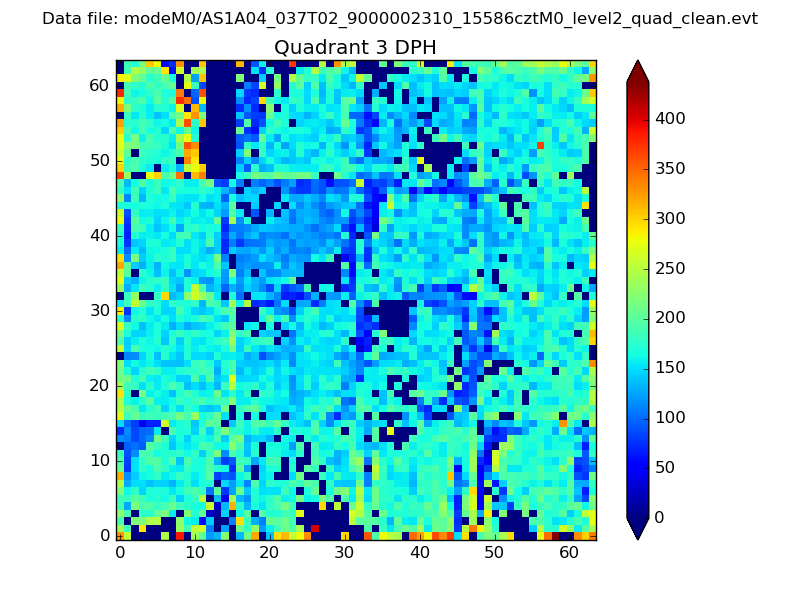 |
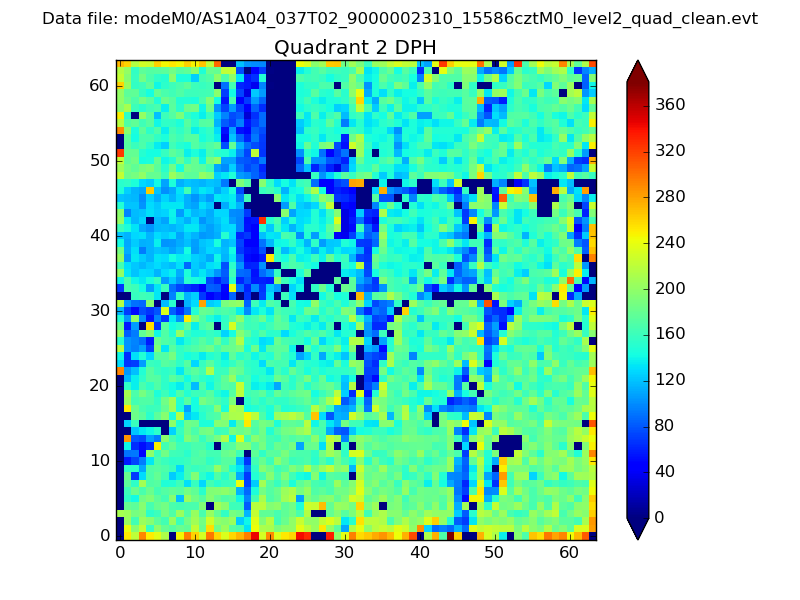 |
Quadrant C |
| Plot type | Count rate plots | Images |
|---|---|---|
| Comparison with Poisson distribution Blue bars denote a histogram of data divided into 1 sec bins. Red curve is a Poisson curve with rate = median count rate of data. |
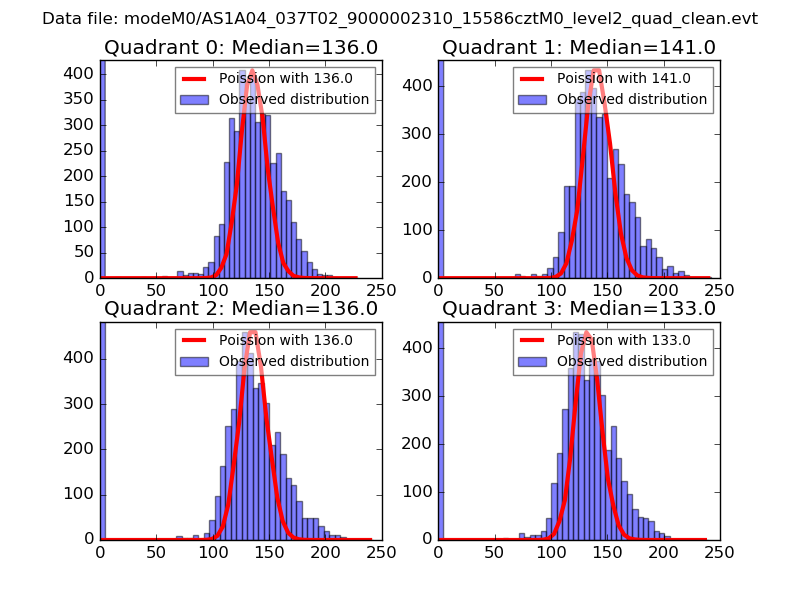 |
 |
| Quadrant-wise count rates Data is divided into 100 sec bins |
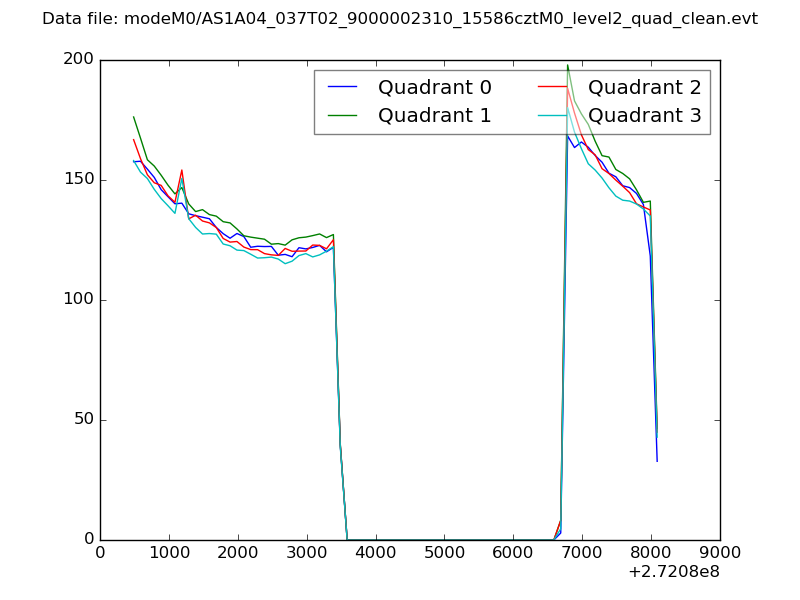 |
|
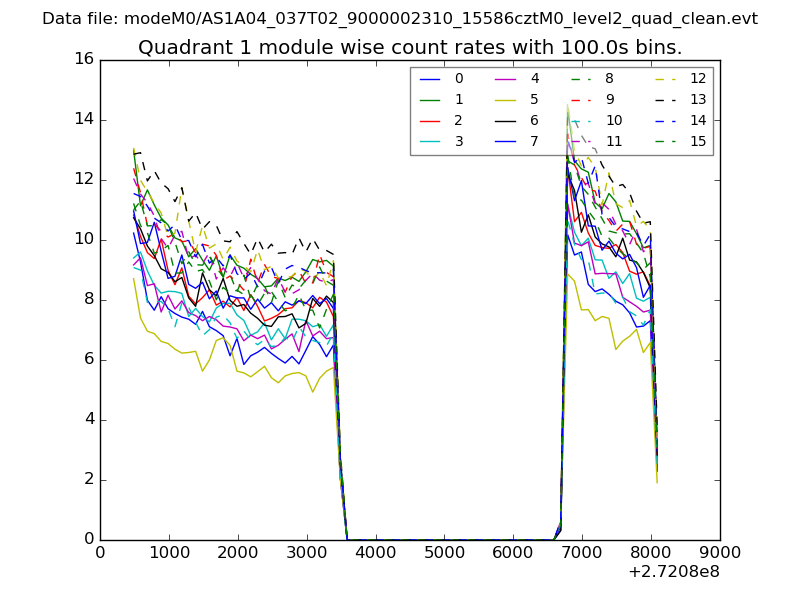
| Module-wise count rates for Quadrant A Data is divided into 100 sec bins |
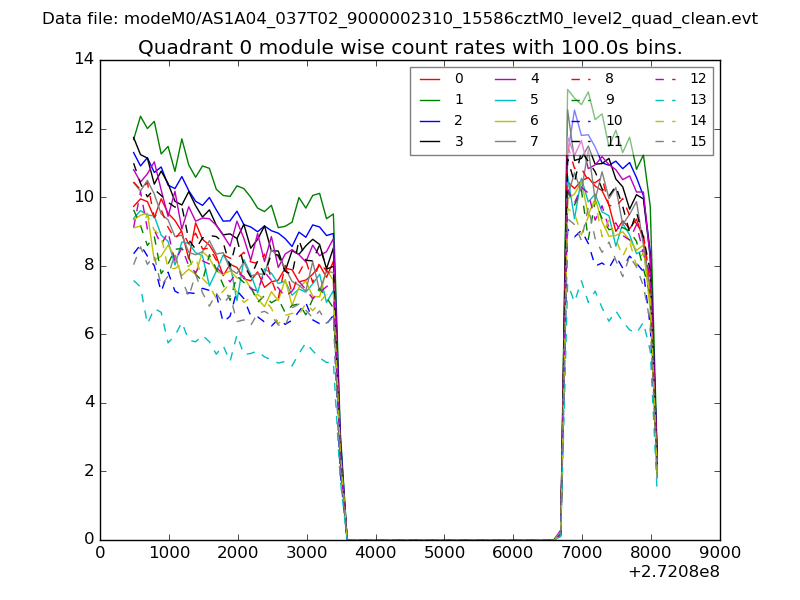 |
 |
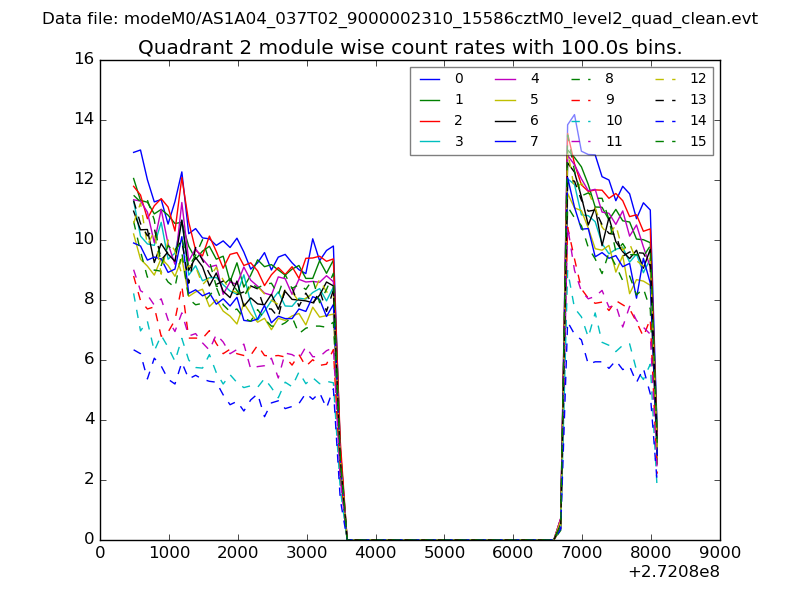
| Module-wise count rates for Quadrant B Data is divided into 100 sec bins |
 |
 |
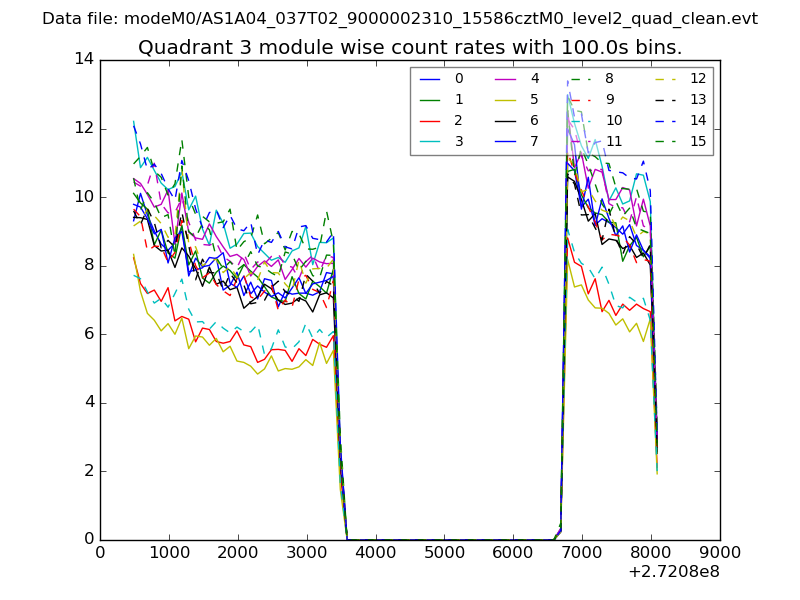
| Module-wise count rates for Quadrant C Data is divided into 100 sec bins |
 |
 |
| Module-wise count rates for Quadrant D Data is divided into 100 sec bins |
 |
 |
| Parameter | Plot |
|---|---|
| CZT HV Monitor | 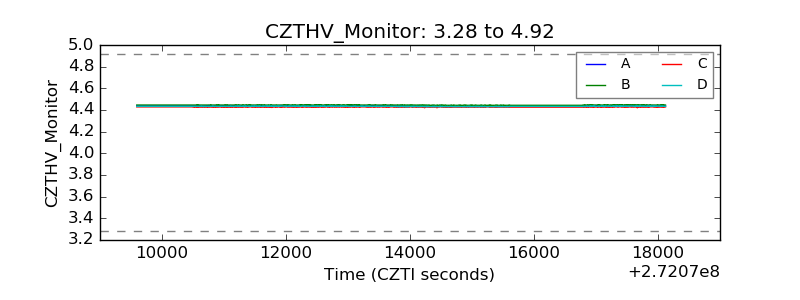 |
| D_VDD | 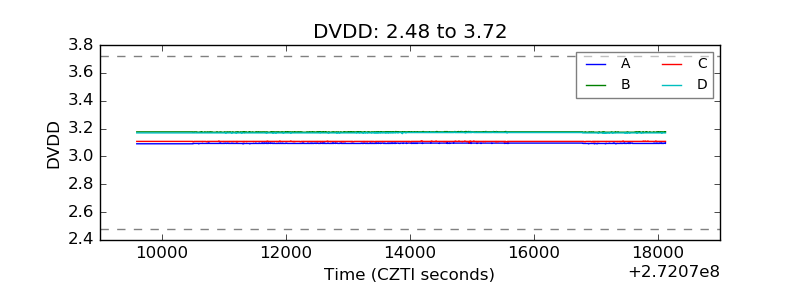 |
| Temperature 1 | 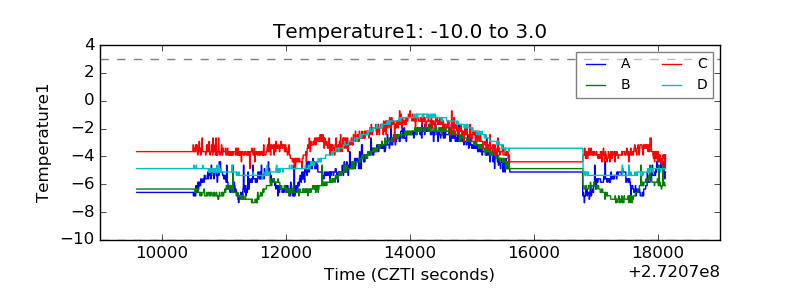 |
| Veto HV Monitor | 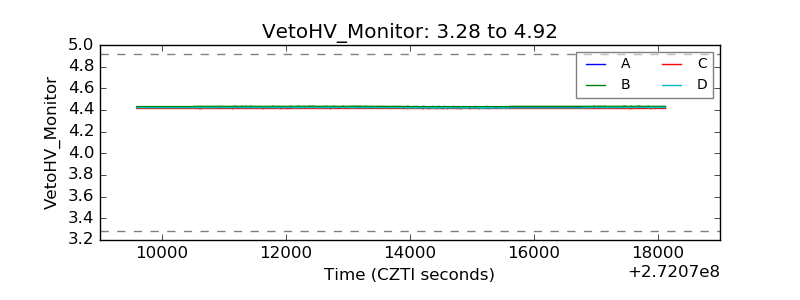 |
| Veto LLD | 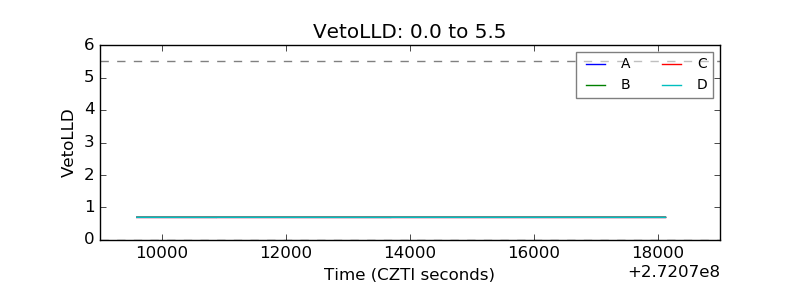 |
| Alpha Counter | 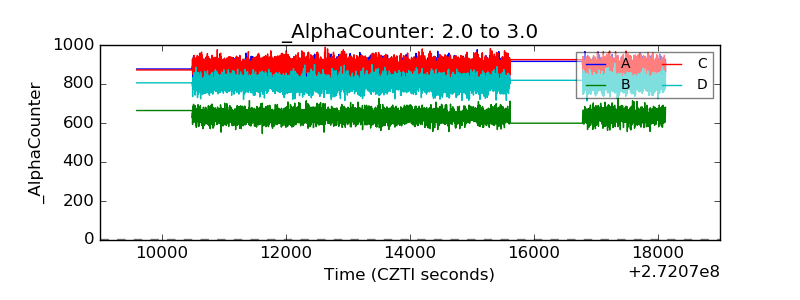 |
| _CPM_Rate | 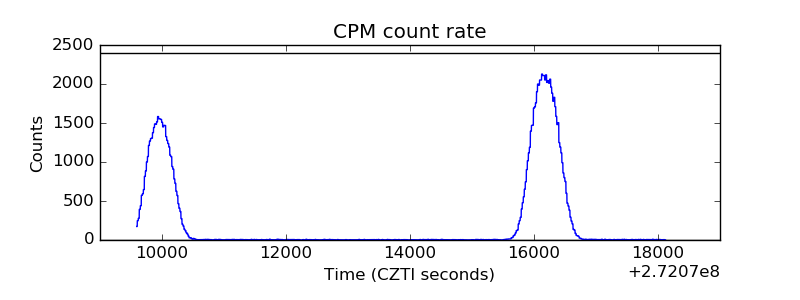 |
| CZT Counter |  |
| +2.5 Volts monitor |  |
| +5 Volts monitor |  |
| _ROLL_ROT | 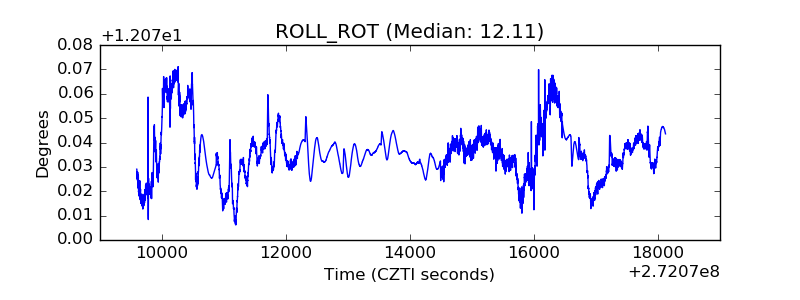 |
| _Roll_DEC | 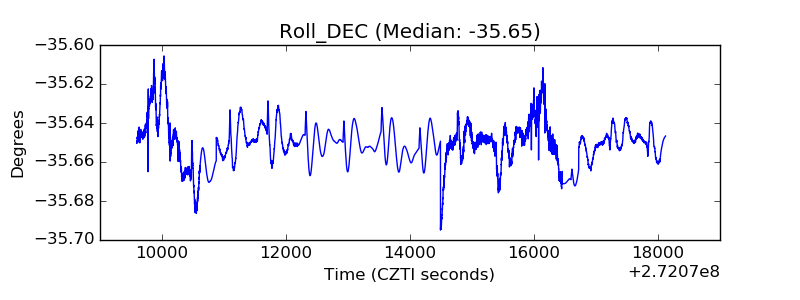 |
| _Roll_RA | 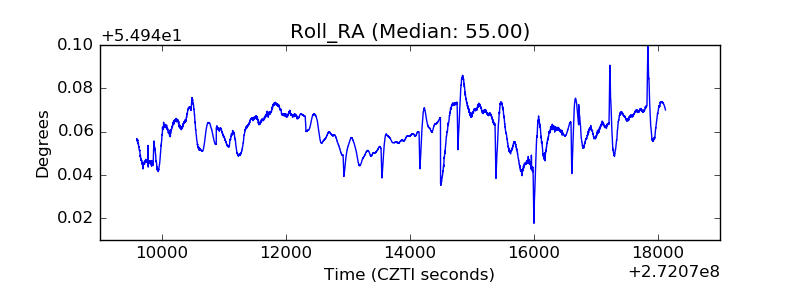 |
| Veto Counter | 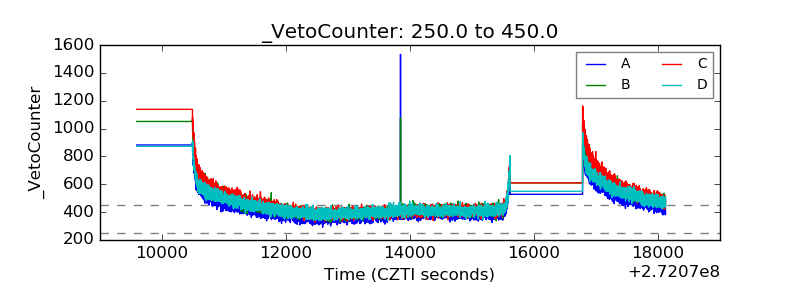 |