| Param | Original file | Final file |
|---|---|---|
| Filename | modeM0/AS1A04_037T02_9000002310_15587cztM0_level2.evt | modeM0/AS1A04_037T02_9000002310_15587cztM0_level2_quad_clean.evt |
| Size (bytes) | 503,665,920 | 95,434,560 |
| Size | 480.3 MB | 91.0 MB |
| Events in quadrant A | 4,656,185 | 601,924 |
| Events in quadrant B | 3,355,893 | 637,641 |
| Events in quadrant C | 3,332,627 | 614,734 |
| Events in quadrant D | 3,483,411 | 598,041 |
| Mode SS | |||
|---|---|---|---|
| Quadrant | BADHDUFLAG | Total packets | Discarded packets |
| A | 0 | 128 | 0 |
| B | 0 | 128 | 0 |
| C | 0 | 128 | 0 |
| D | 0 | 128 | 0 |
| Mode M0 | |||
|---|---|---|---|
| Quadrant | BADHDUFLAG | Total packets | Discarded packets |
| A | 0 | 17678 | 3 |
| B | 0 | 13798 | 2 |
| C | 0 | 13691 | 2 |
| D | 0 | 14226 | 2 |
| Mode M9 | |||
|---|---|---|---|
| Quadrant | BADHDUFLAG | Total packets | Discarded packets |
| A | 0 | 13 | 0 |
| B | 0 | 13 | 0 |
| C | 0 | 13 | 0 |
| D | 0 | 13 | 0 |
| Quadrant | Total seconds | Saturated seconds | Saturation percentage |
|---|---|---|---|
| A | 6268 | 347 | 5.536056% |
| B | 6268 | 66 | 1.052967% |
| C | 6268 | 60 | 0.957243% |
| D | 6269 | 99 | 1.579199% |
Noise dominated data is calculated using 1-second bins in cleaned event files. If a bin has >2000 counts, and if more than 50% of those come from <1% of pixels, then it is considered to be noise-dominated and hence unusable.
| Quadrant | # 1 sec bins | Bins with >0 counts | Bins with >2000 counts | High rate bins dominated by noise | Noise dominated (total time) | Noise dominated (detector-on time) | Marked lightcurve |
|---|---|---|---|---|---|---|---|
| A | 7529 | 6270 | 281 | 281 | 3.73% | 4.48% | 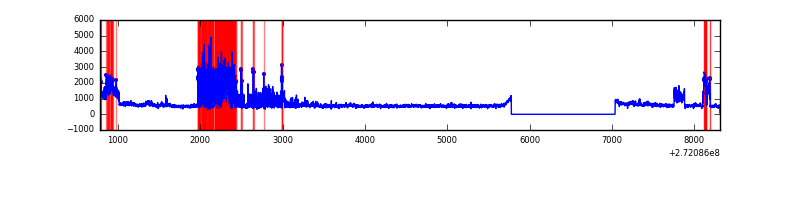 |
| B | 7529 | 6269 | 11 | 11 | 0.15% | 0.18% | 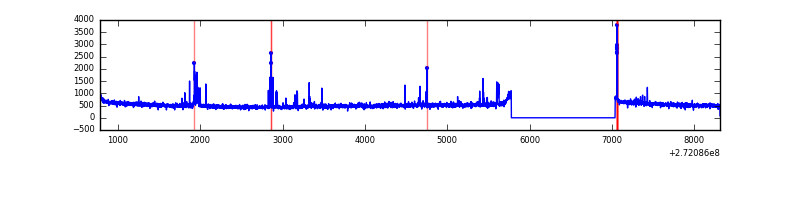 |
| C | 7529 | 6270 | 0 | 0 | 0.00% | 0.00% | 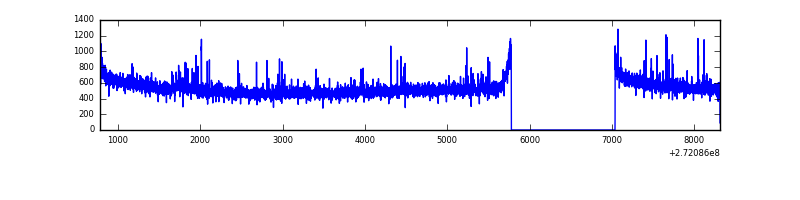 |
| D | 7530 | 6271 | 55 | 55 | 0.73% | 0.88% | 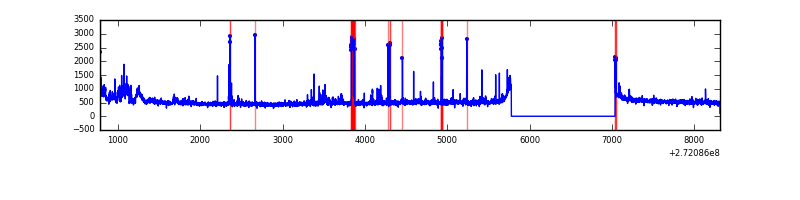 |
Top three noisy pixels from each quadrant. If the there are fewer than three noisy pixels in the level2.evt file, extra rows are filled as -1
| Pixel properties | Quadrant properties | ||||||
|---|---|---|---|---|---|---|---|
| Quadrant | DetID | PixID | Counts | Sigma | Mean | Median | Sigma |
| A | 15 | 69 | 832481 | 5168.18 | 809 | 794 | 160.9 |
| A | 0 | 253 | 709508 | 4404.01 | 809 | 794 | 160.9 |
| A | 0 | 226 | 7131 | 39.38 | 809 | 794 | 160.9 |
| B | 4 | 48 | 58862 | 376.17 | 817 | 797 | 154.4 |
| B | 4 | 173 | 37210 | 235.9 | 817 | 797 | 154.4 |
| B | 0 | 189 | 31506 | 198.95 | 817 | 797 | 154.4 |
| C | 14 | 238 | 123196 | 659.33 | 800 | 806 | 185.6 |
| C | 3 | 233 | 87571 | 467.41 | 800 | 806 | 185.6 |
| C | 13 | 61 | 5674 | 26.22 | 800 | 806 | 185.6 |
| D | 1 | 52 | 217885 | 1105.89 | 808 | 786 | 196.3 |
| D | 7 | 223 | 64275 | 323.41 | 808 | 786 | 196.3 |
| D | 12 | 110 | 43841 | 219.32 | 808 | 786 | 196.3 |
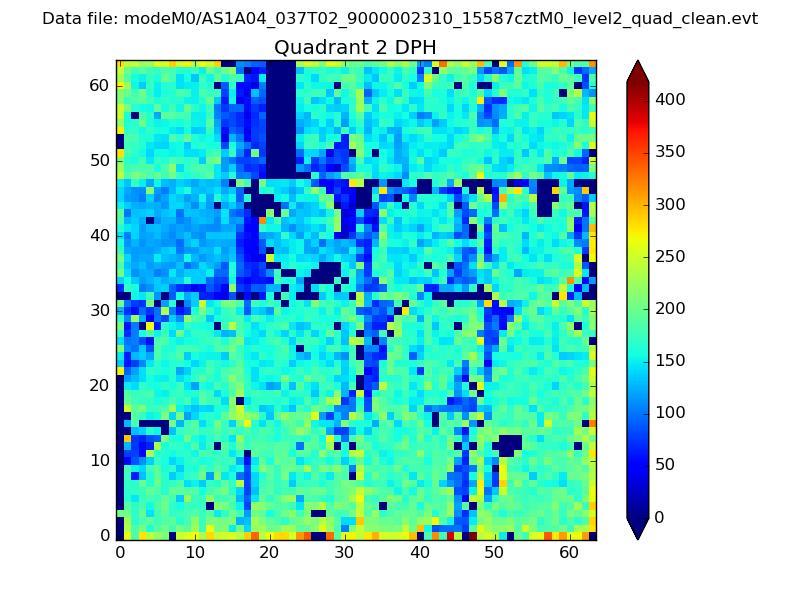
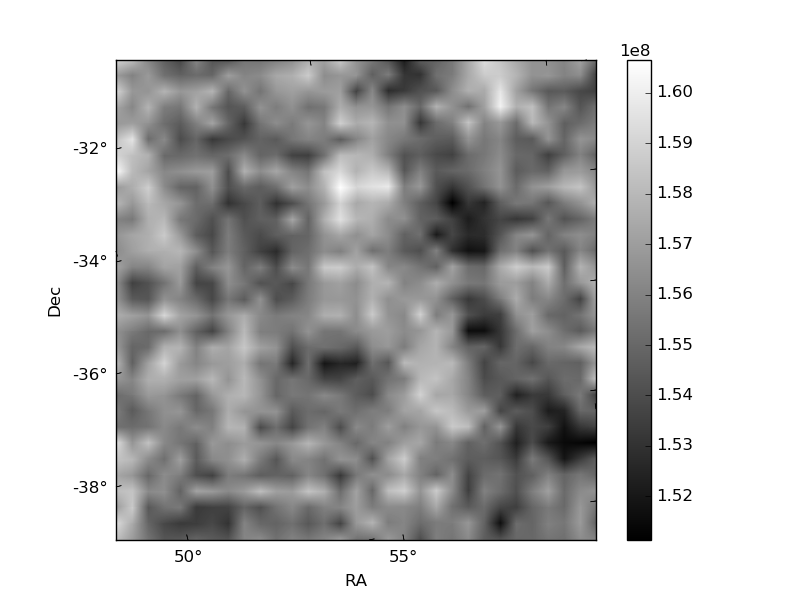
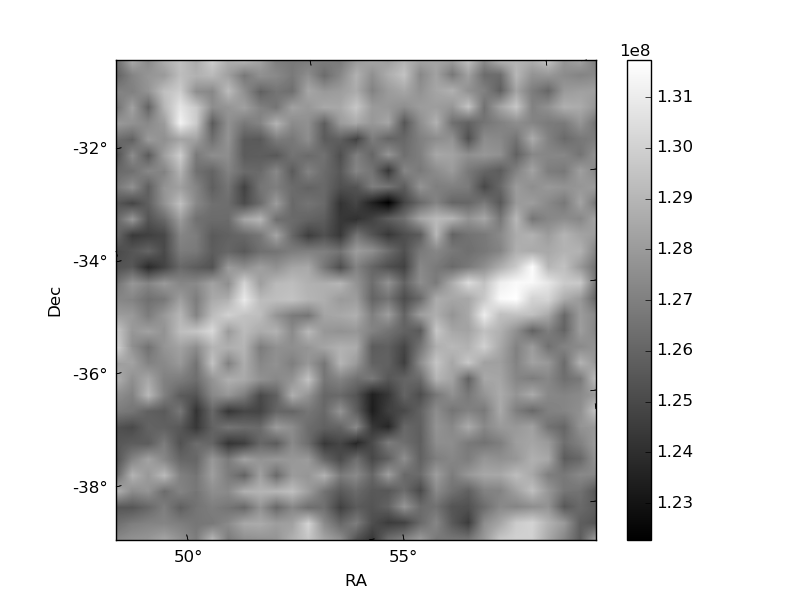
Histogram calculated using DETX and DETY for each event in the final _common_clean file
| Quadrant A | 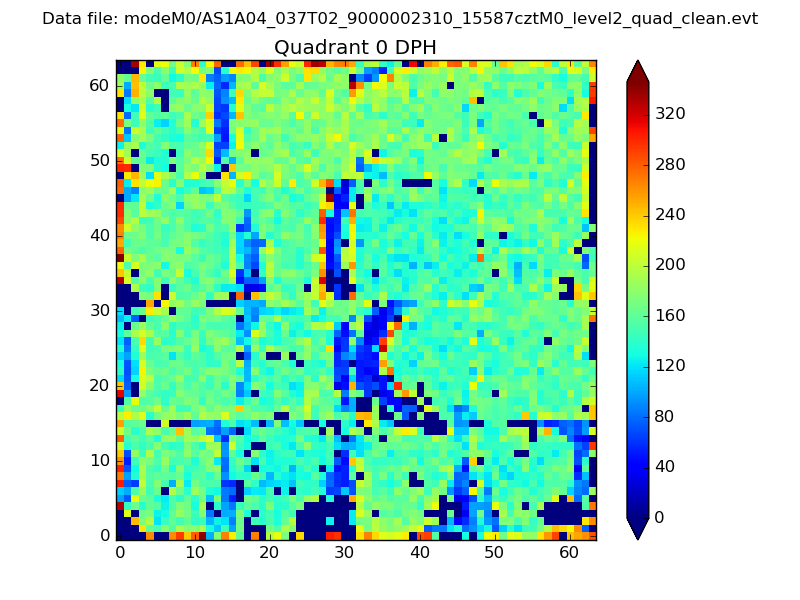 |
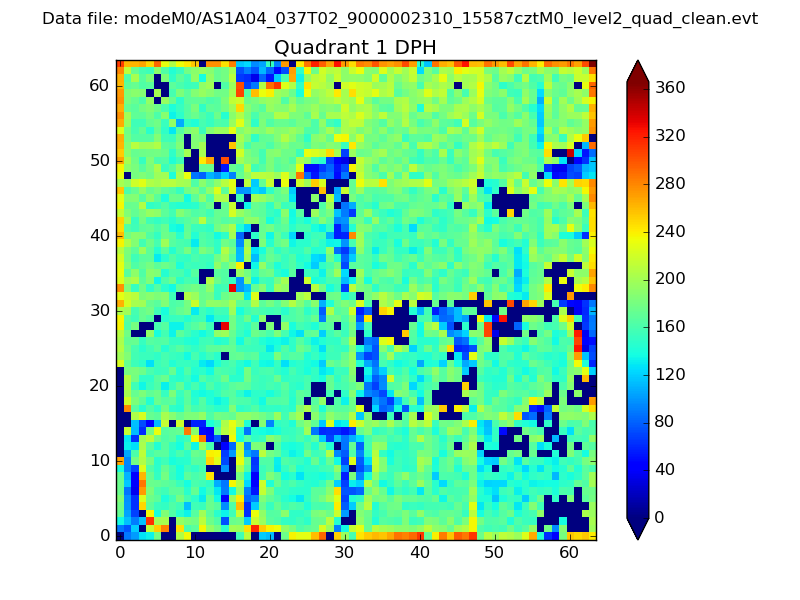 |
Quadrant B |
|---|---|---|---|
| Quadrant D | 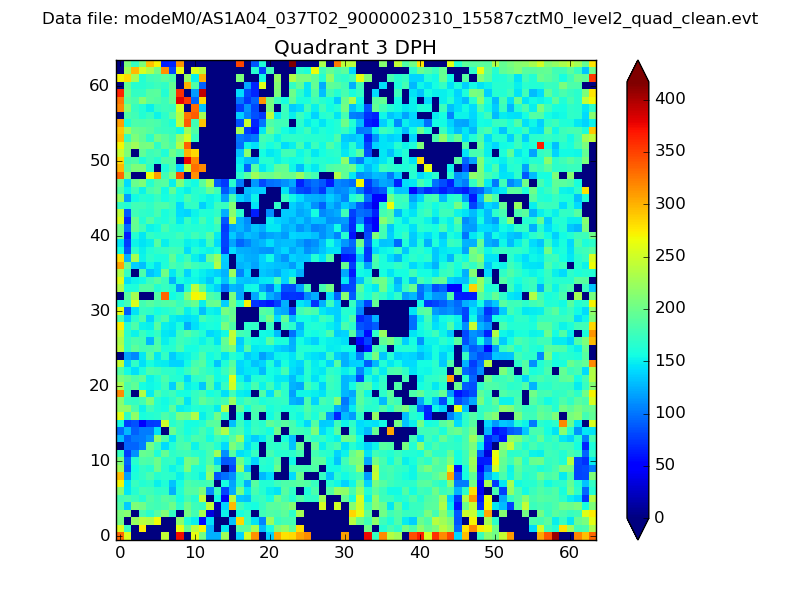 |
 |
Quadrant C |
| Plot type | Count rate plots | Images |
|---|---|---|
| Comparison with Poisson distribution Blue bars denote a histogram of data divided into 1 sec bins. Red curve is a Poisson curve with rate = median count rate of data. |
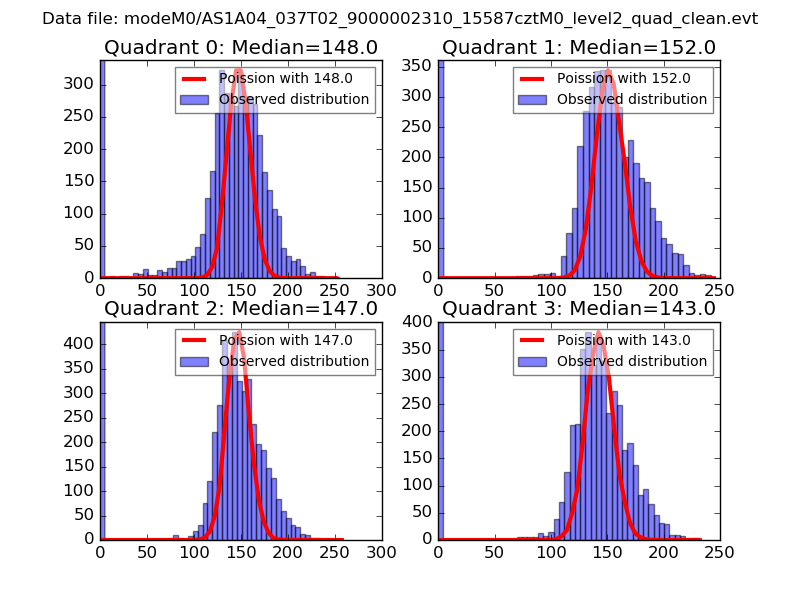 |
 |
| Quadrant-wise count rates Data is divided into 100 sec bins |
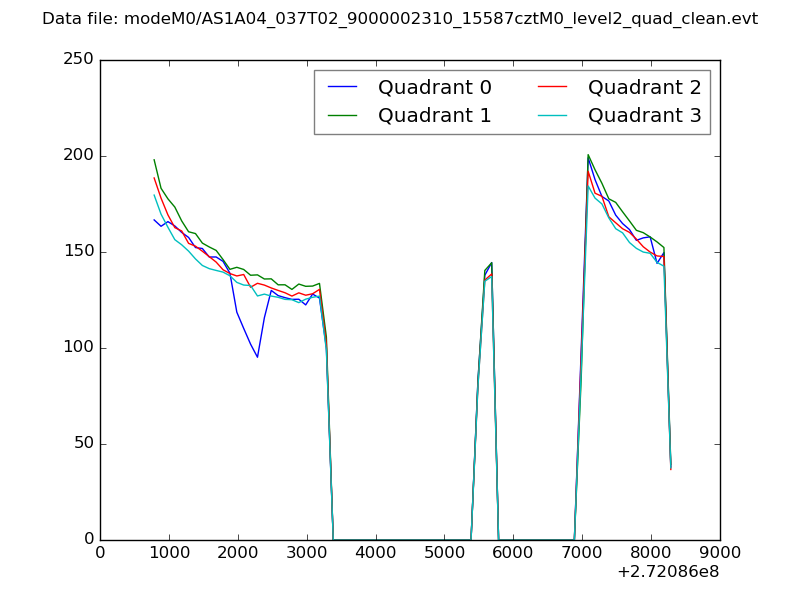 |
|
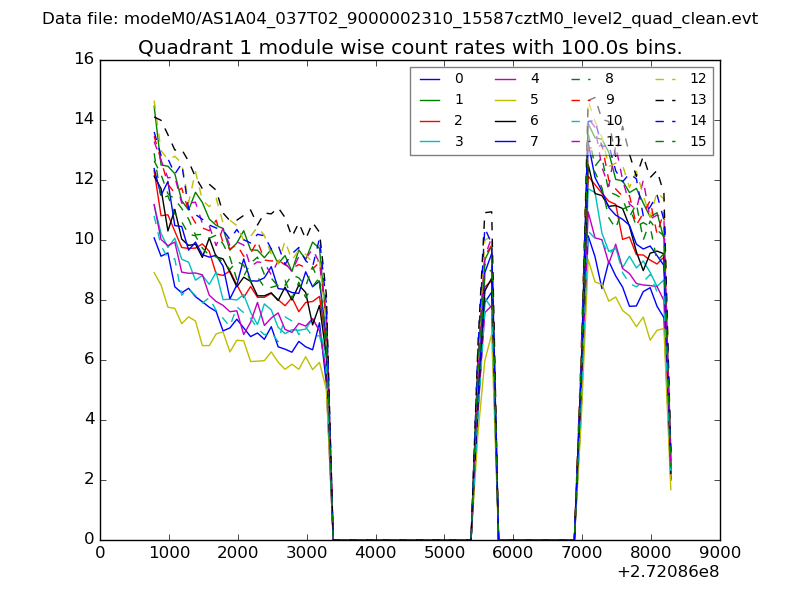
| Module-wise count rates for Quadrant A Data is divided into 100 sec bins |
 |
 |
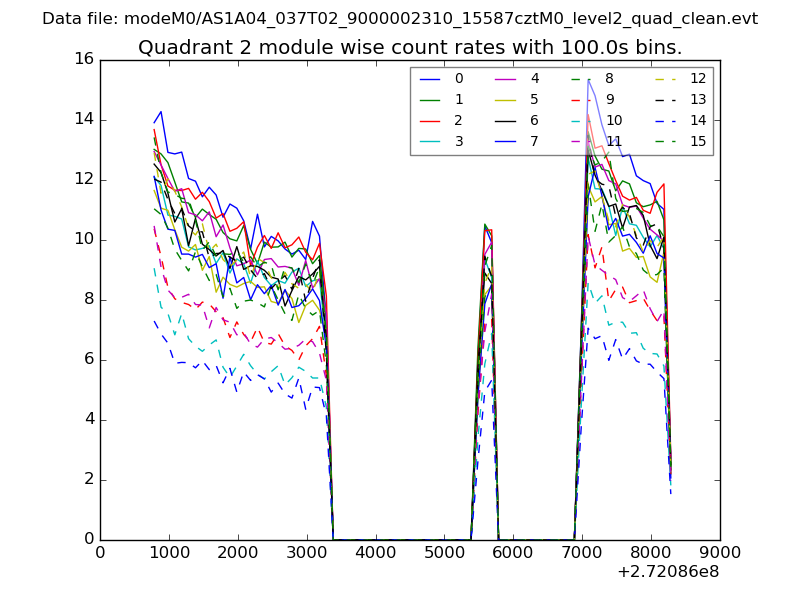
| Module-wise count rates for Quadrant B Data is divided into 100 sec bins |
 |
 |
| Module-wise count rates for Quadrant C Data is divided into 100 sec bins |
 |
 |
| Module-wise count rates for Quadrant D Data is divided into 100 sec bins |
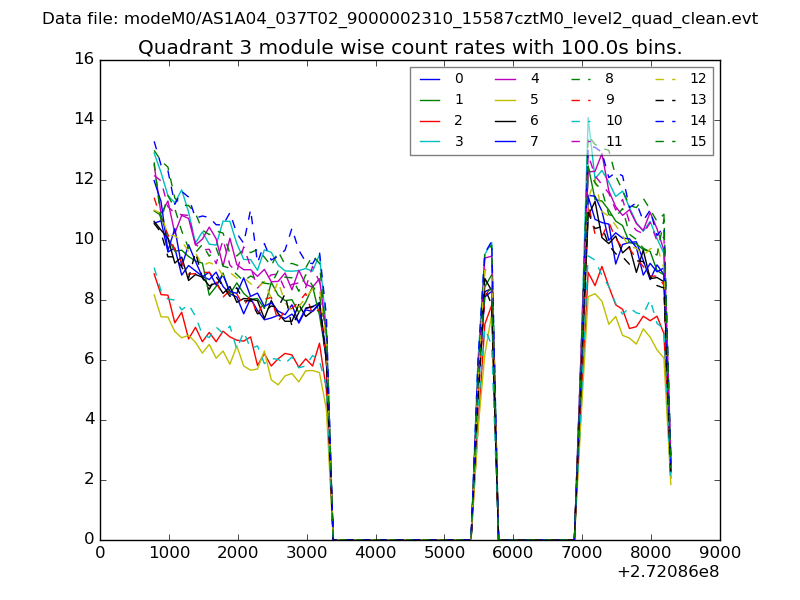 |
 |
| Parameter | Plot |
|---|---|
| CZT HV Monitor | 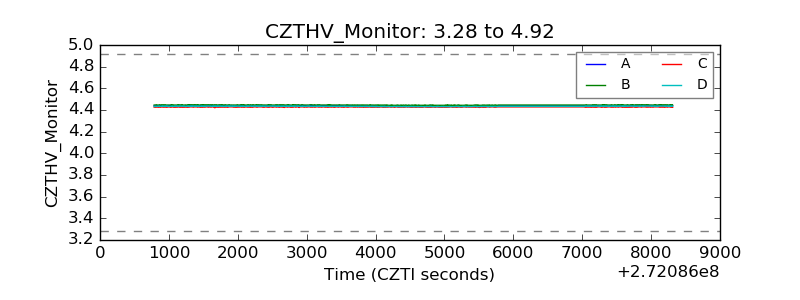 |
| D_VDD | 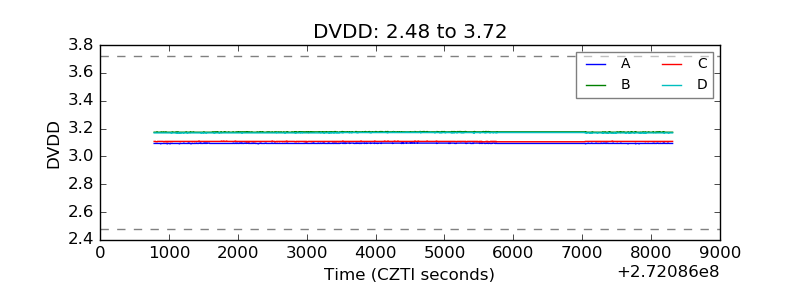 |
| Temperature 1 | 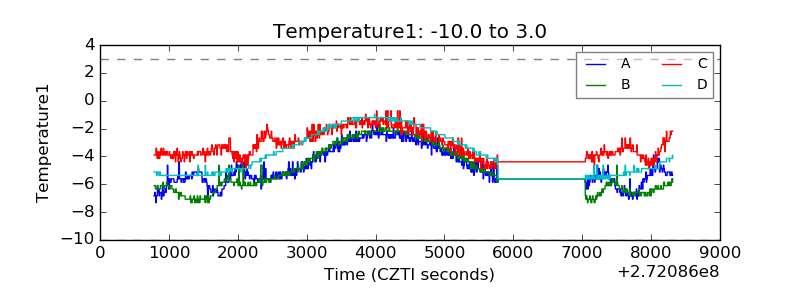 |
| Veto HV Monitor | 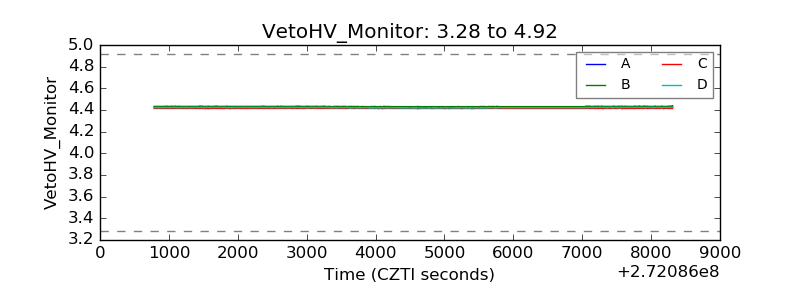 |
| Veto LLD | 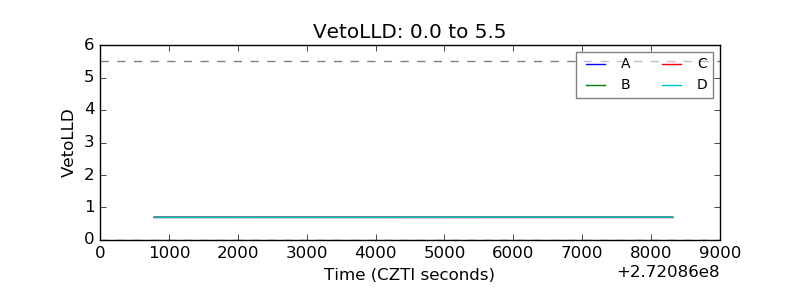 |
| Alpha Counter | 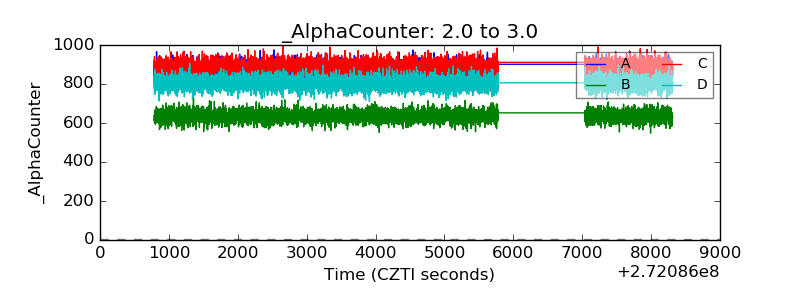 |
| _CPM_Rate | 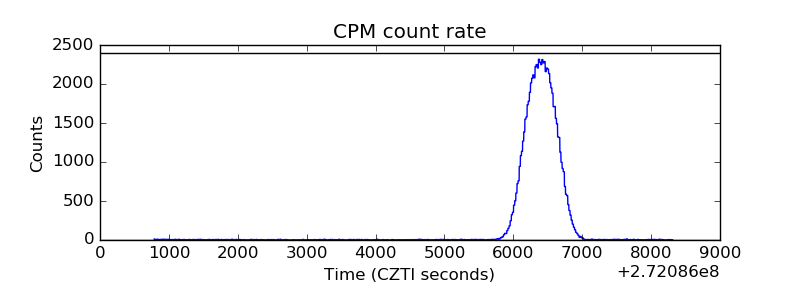 |
| CZT Counter | 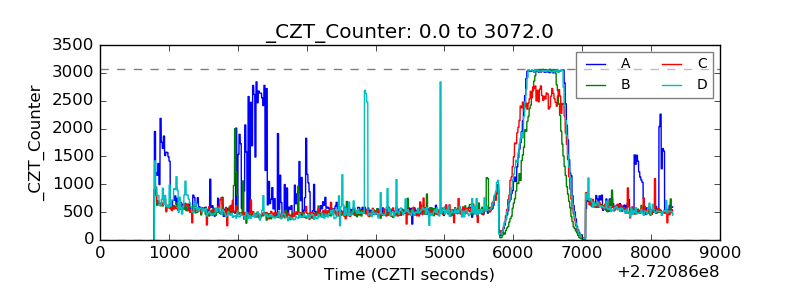 |
| +2.5 Volts monitor |  |
| +5 Volts monitor |  |
| _ROLL_ROT | 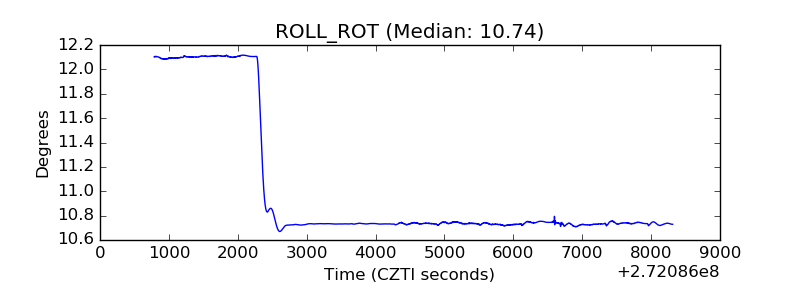 |
| _Roll_DEC | 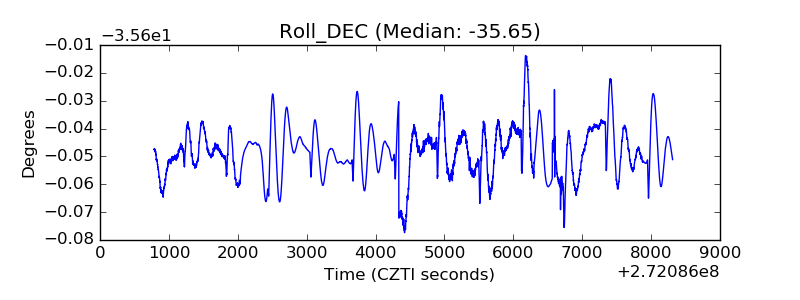 |
| _Roll_RA | 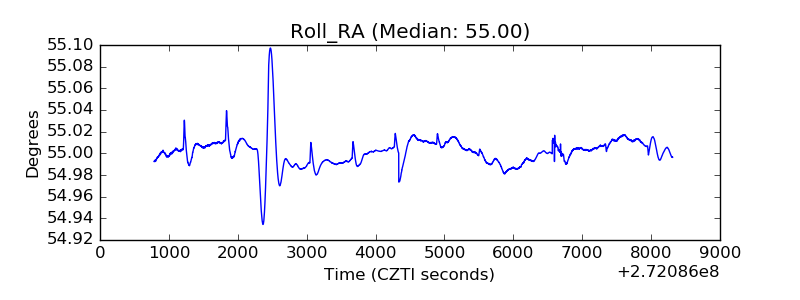 |
| Veto Counter | 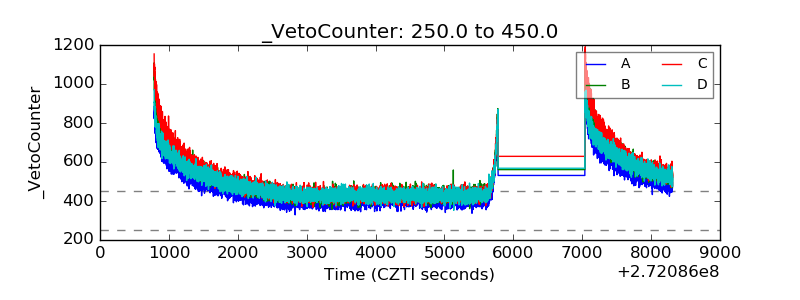 |