| Param | Original file | Final file |
|---|---|---|
| Filename | modeM0/AS1A04_037T02_9000002310_15588cztM0_level2.evt | modeM0/AS1A04_037T02_9000002310_15588cztM0_level2_quad_clean.evt |
| Size (bytes) | 541,592,640 | 108,057,600 |
| Size | 516.5 MB | 103.1 MB |
| Events in quadrant A | 4,889,471 | 701,810 |
| Events in quadrant B | 3,562,757 | 729,178 |
| Events in quadrant C | 3,571,170 | 695,944 |
| Events in quadrant D | 3,925,569 | 679,510 |
| Mode SS | |||
|---|---|---|---|
| Quadrant | BADHDUFLAG | Total packets | Discarded packets |
| A | 0 | 136 | 0 |
| B | 0 | 136 | 0 |
| C | 0 | 136 | 0 |
| D | 0 | 136 | 0 |
| Mode M0 | |||
|---|---|---|---|
| Quadrant | BADHDUFLAG | Total packets | Discarded packets |
| A | 0 | 18708 | 3 |
| B | 0 | 14517 | 2 |
| C | 0 | 14534 | 2 |
| D | 0 | 15647 | 2 |
| Mode M9 | |||
|---|---|---|---|
| Quadrant | BADHDUFLAG | Total packets | Discarded packets |
| A | 0 | 18 | 0 |
| B | 0 | 18 | 0 |
| C | 0 | 18 | 0 |
| D | 0 | 19 | 0 |
| Quadrant | Total seconds | Saturated seconds | Saturation percentage |
|---|---|---|---|
| A | 6683 | 338 | 5.057609% |
| B | 6683 | 63 | 0.942690% |
| C | 6683 | 90 | 1.346701% |
| D | 6683 | 130 | 1.945234% |
Noise dominated data is calculated using 1-second bins in cleaned event files. If a bin has >2000 counts, and if more than 50% of those come from <1% of pixels, then it is considered to be noise-dominated and hence unusable.
| Quadrant | # 1 sec bins | Bins with >0 counts | Bins with >2000 counts | High rate bins dominated by noise | Noise dominated (total time) | Noise dominated (detector-on time) | Marked lightcurve |
|---|---|---|---|---|---|---|---|
| A | 8014 | 6685 | 288 | 288 | 3.59% | 4.31% | 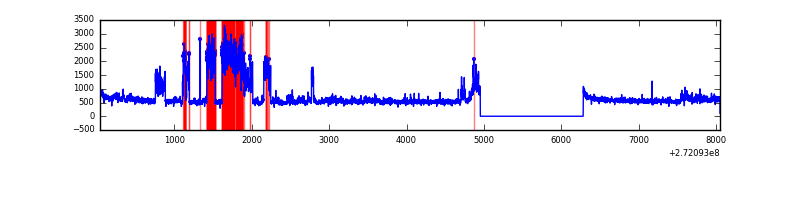 |
| B | 8014 | 6684 | 8 | 8 | 0.10% | 0.12% | 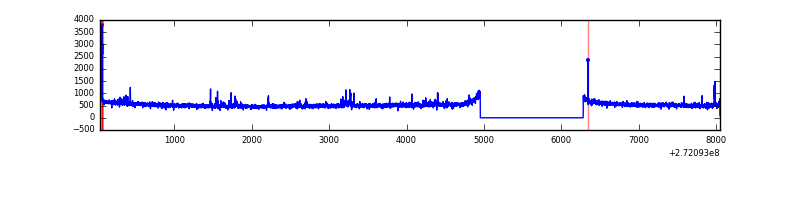 |
| C | 8014 | 6684 | 0 | 0 | 0.00% | 0.00% | 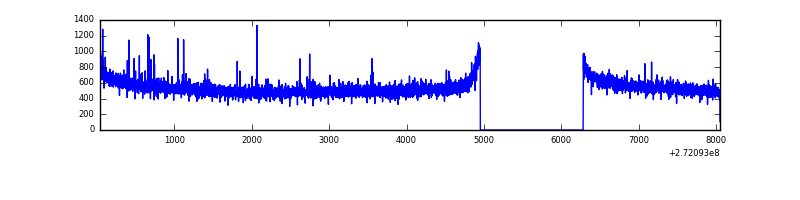 |
| D | 8014 | 6685 | 87 | 87 | 1.09% | 1.30% | 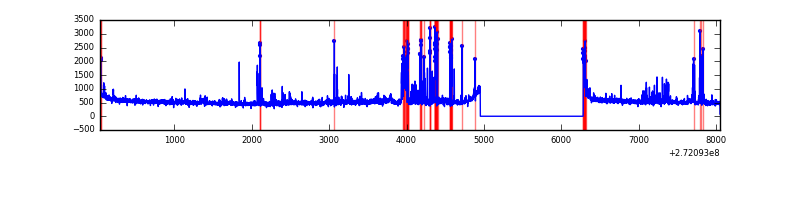 |
Top three noisy pixels from each quadrant. If the there are fewer than three noisy pixels in the level2.evt file, extra rows are filled as -1
| Pixel properties | Quadrant properties | ||||||
|---|---|---|---|---|---|---|---|
| Quadrant | DetID | PixID | Counts | Sigma | Mean | Median | Sigma |
| A | 0 | 253 | 1448685 | 8108.29 | 893 | 876 | 178.6 |
| A | 0 | 226 | 8029 | 40.06 | 893 | 876 | 178.6 |
| A | 12 | 194 | 6785 | 33.09 | 893 | 876 | 178.6 |
| B | 4 | 80 | 24568 | 142.6 | 888 | 867 | 166.2 |
| B | 5 | 96 | 21029 | 121.31 | 888 | 867 | 166.2 |
| B | 4 | 48 | 19699 | 113.31 | 888 | 867 | 166.2 |
| C | 14 | 238 | 134875 | 667.11 | 866 | 874 | 200.9 |
| C | 3 | 233 | 54620 | 267.57 | 866 | 874 | 200.9 |
| C | 10 | 22 | 6148 | 26.25 | 866 | 874 | 200.9 |
| D | 12 | 110 | 250914 | 1179.87 | 878 | 856 | 211.9 |
| D | 13 | 172 | 79530 | 371.21 | 878 | 856 | 211.9 |
| D | 10 | 70 | 67134 | 312.72 | 878 | 856 | 211.9 |
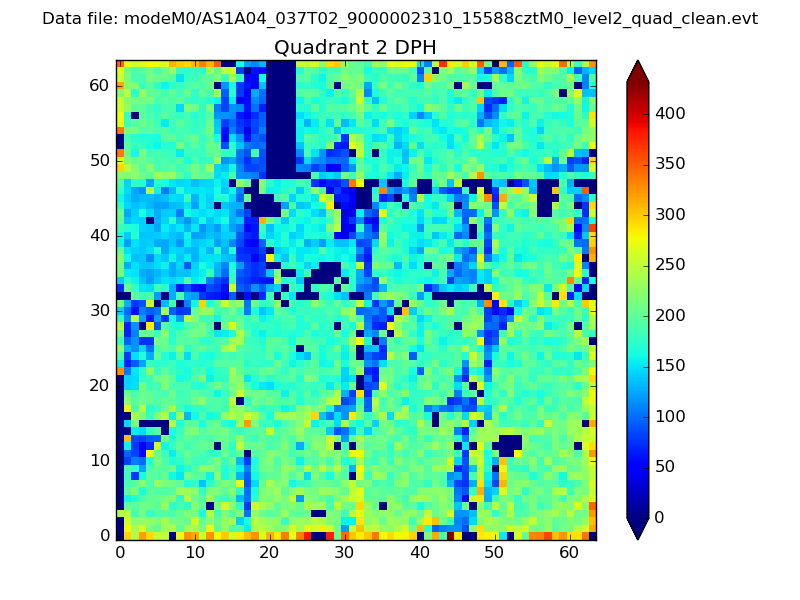
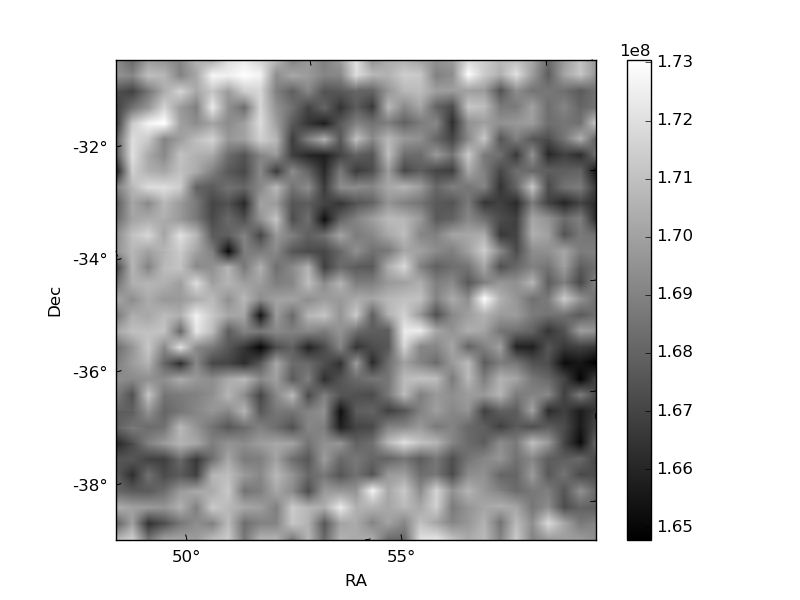
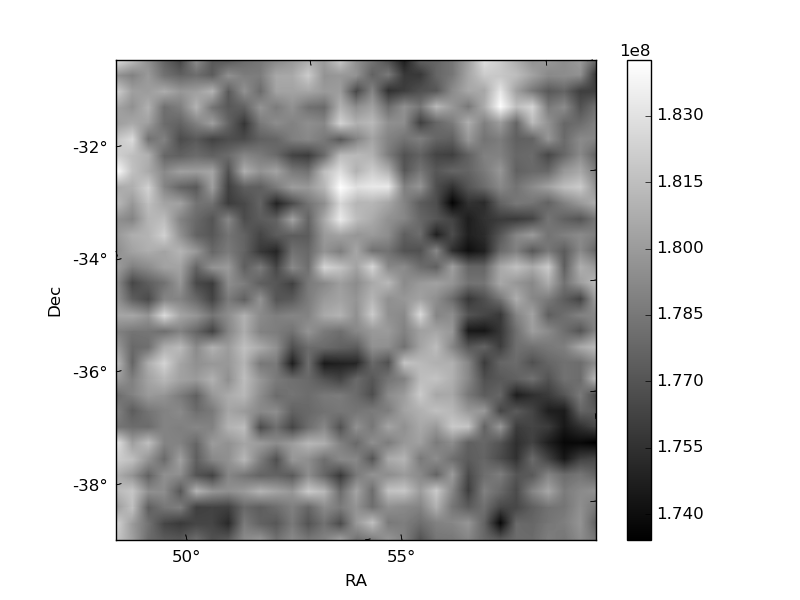
Histogram calculated using DETX and DETY for each event in the final _common_clean file
| Quadrant A | 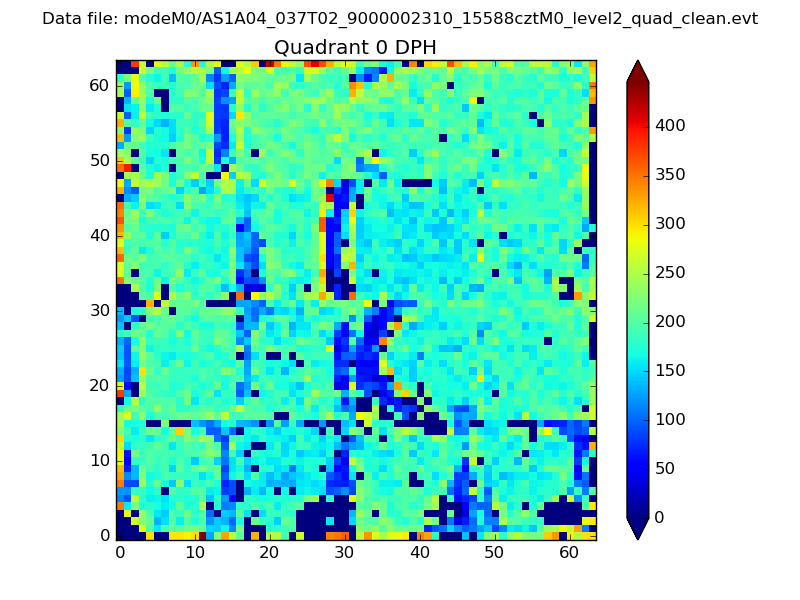 |
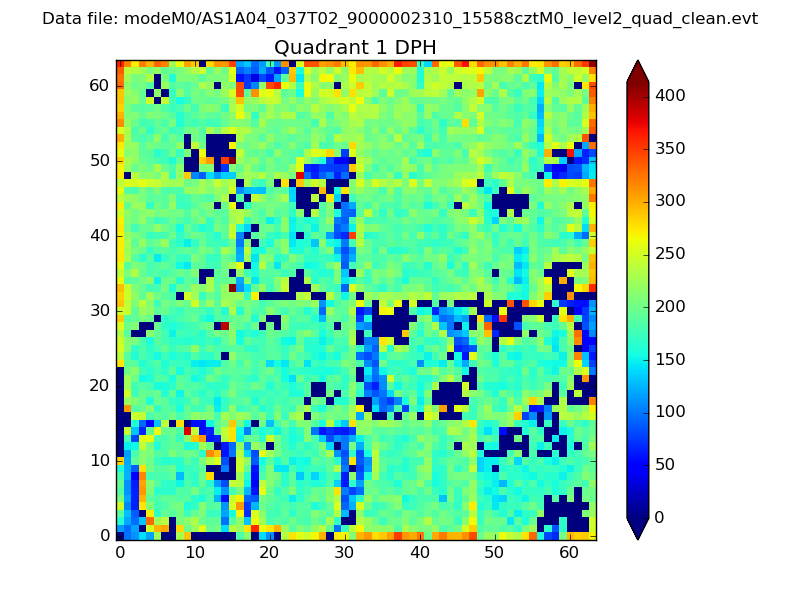 |
Quadrant B |
|---|---|---|---|
| Quadrant D | 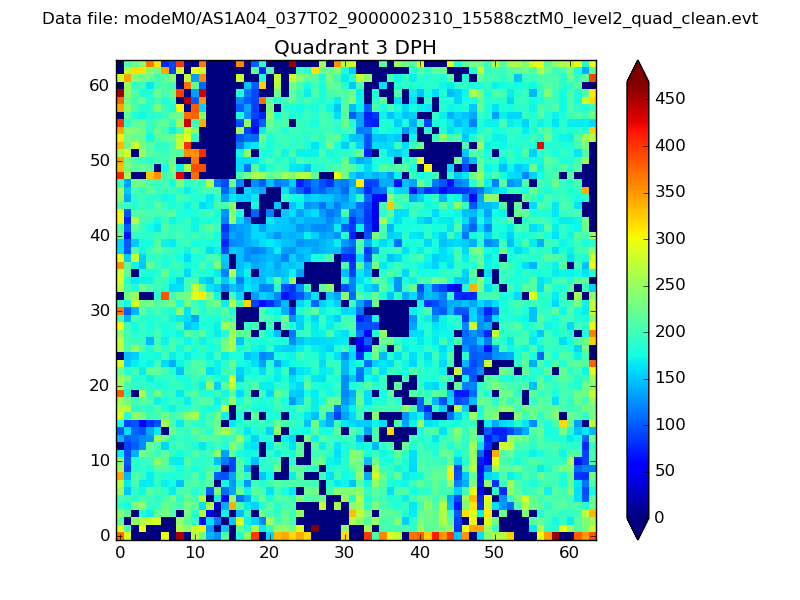 |
 |
Quadrant C |
| Plot type | Count rate plots | Images |
|---|---|---|
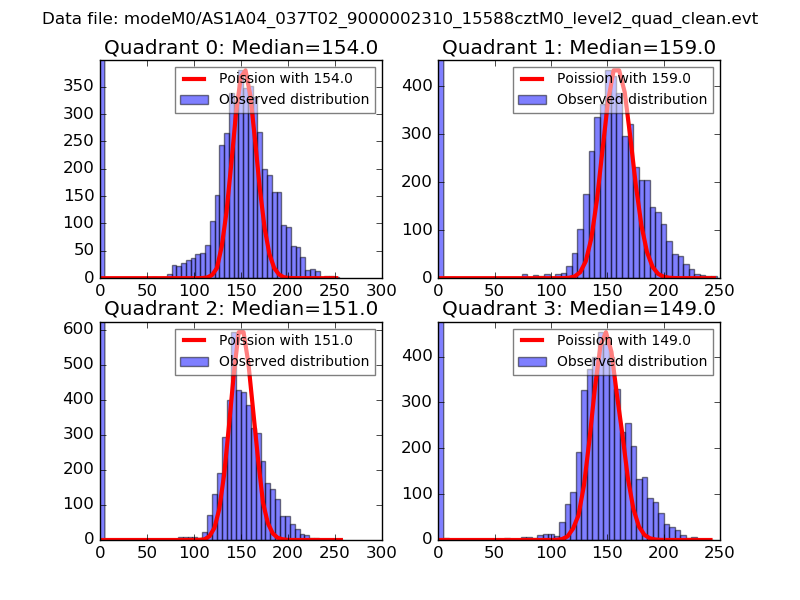
| Comparison with Poisson distribution Blue bars denote a histogram of data divided into 1 sec bins. Red curve is a Poisson curve with rate = median count rate of data. |
 |
 |
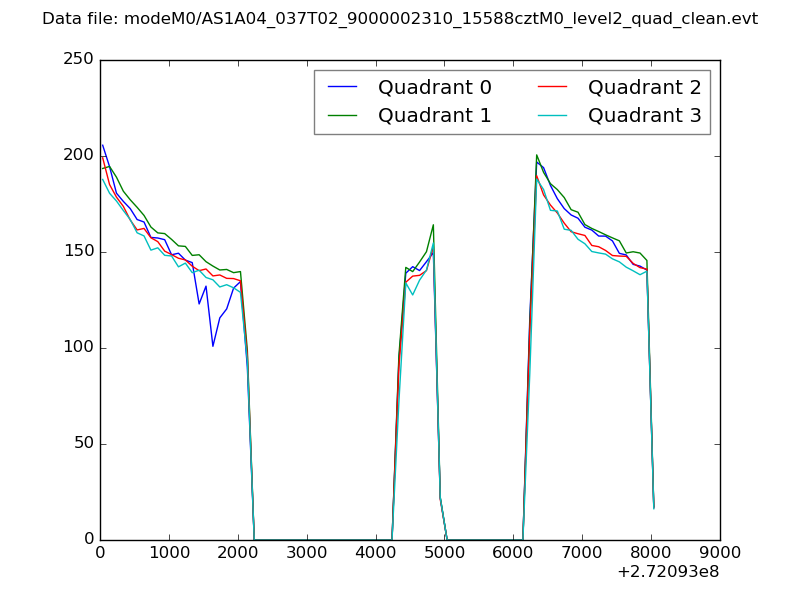
| Quadrant-wise count rates Data is divided into 100 sec bins |
 |
|
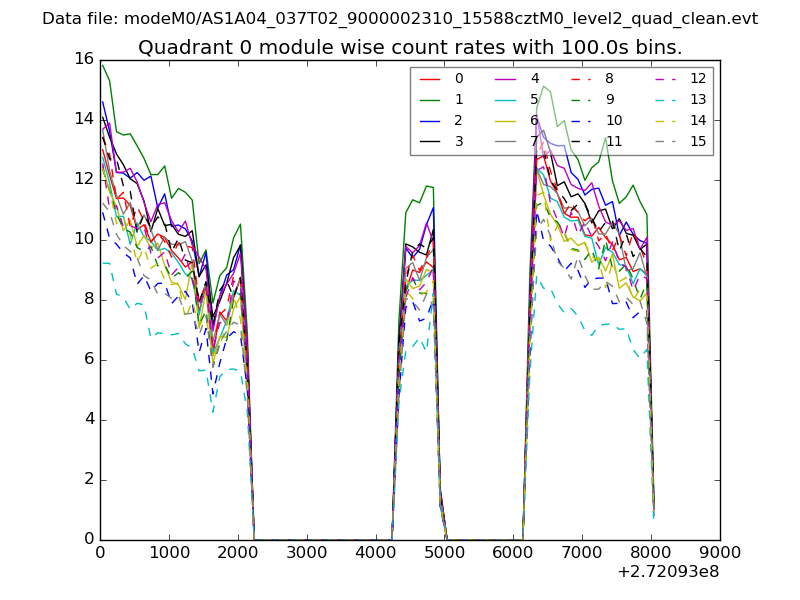
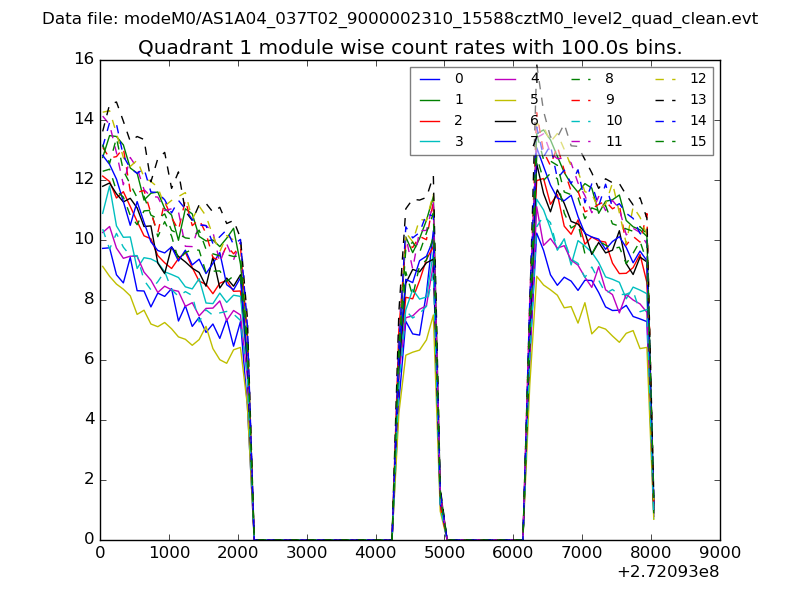
| Module-wise count rates for Quadrant A Data is divided into 100 sec bins |
 |
 |
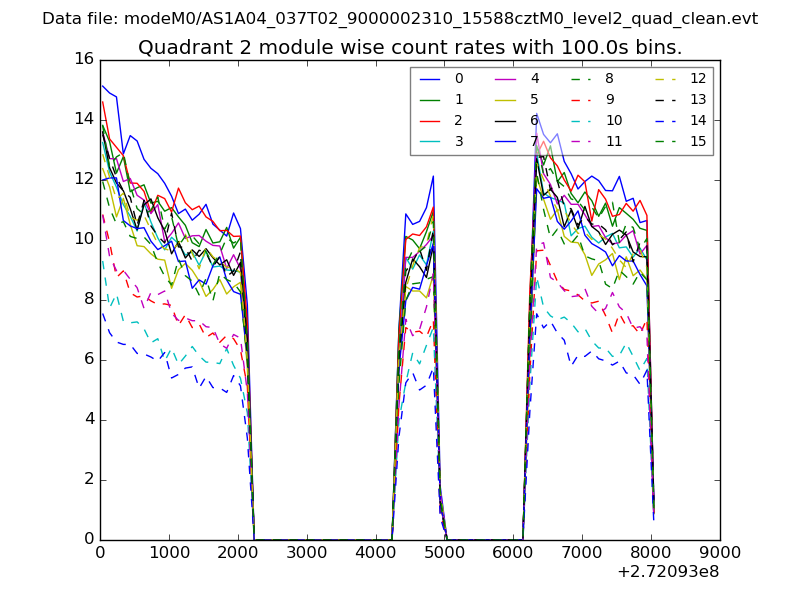
| Module-wise count rates for Quadrant B Data is divided into 100 sec bins |
 |
 |
| Module-wise count rates for Quadrant C Data is divided into 100 sec bins |
 |
 |
| Module-wise count rates for Quadrant D Data is divided into 100 sec bins |
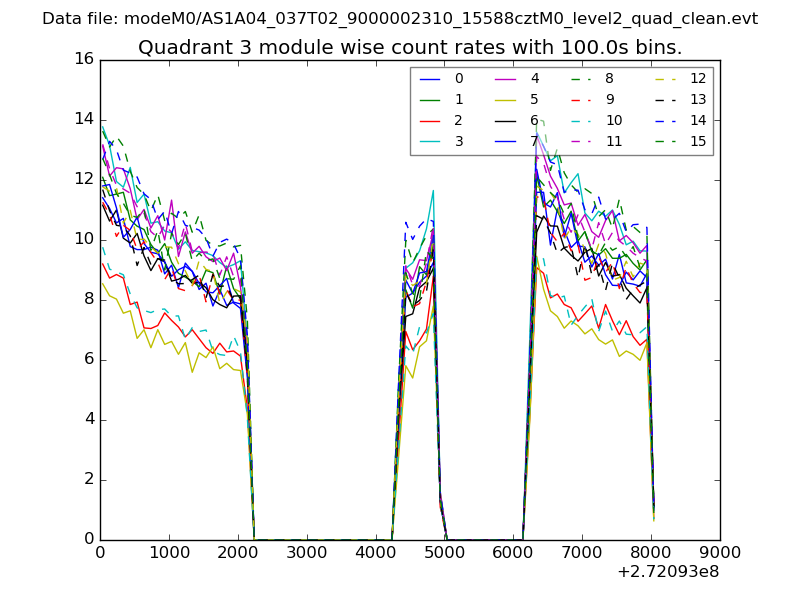 |
 |
| Parameter | Plot |
|---|---|
| CZT HV Monitor | 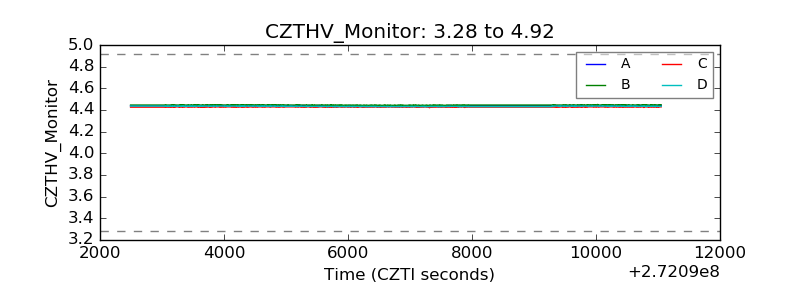 |
| D_VDD | 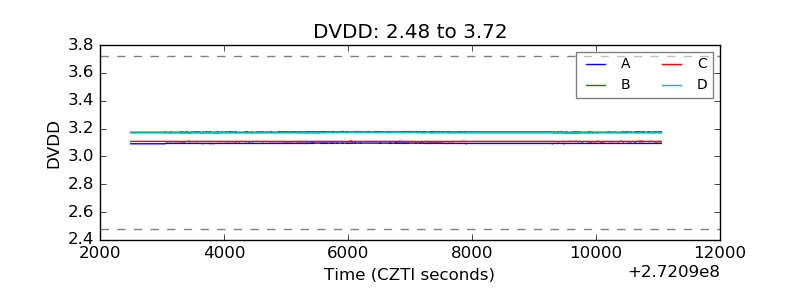 |
| Temperature 1 | 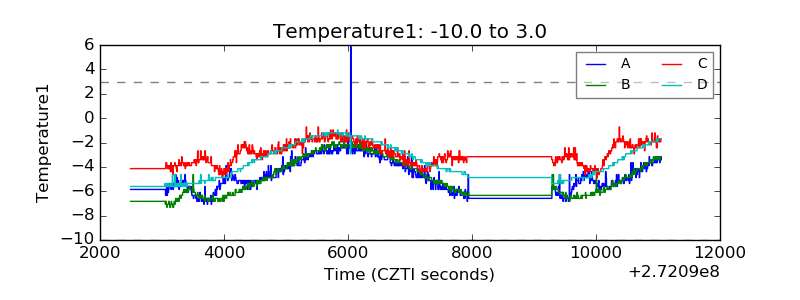 |
| Veto HV Monitor | 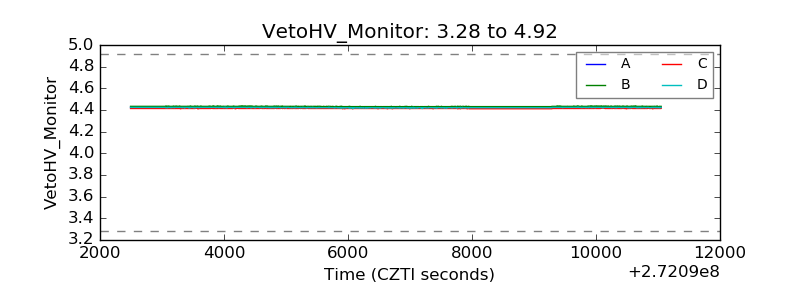 |
| Veto LLD |  |
| Alpha Counter | 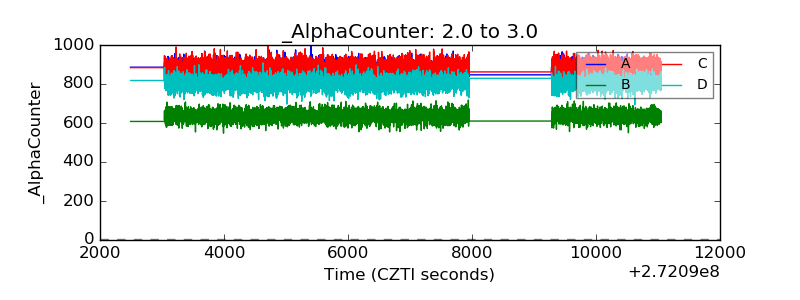 |
| _CPM_Rate | 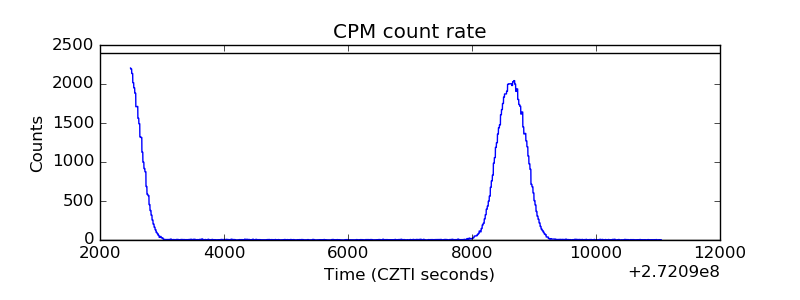 |
| CZT Counter | 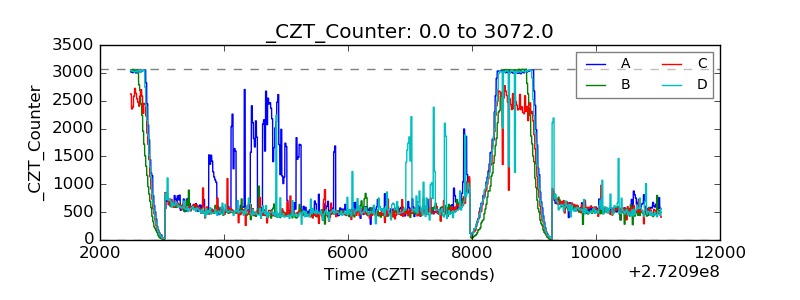 |
| +2.5 Volts monitor |  |
| +5 Volts monitor |  |
| _ROLL_ROT | 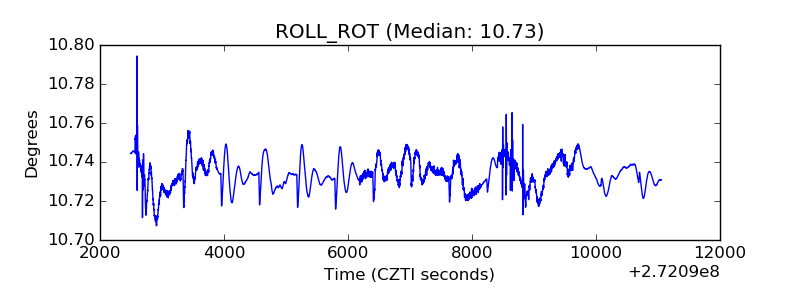 |
| _Roll_DEC | 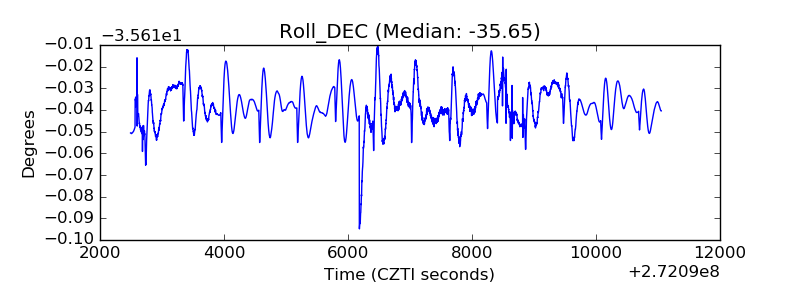 |
| _Roll_RA | 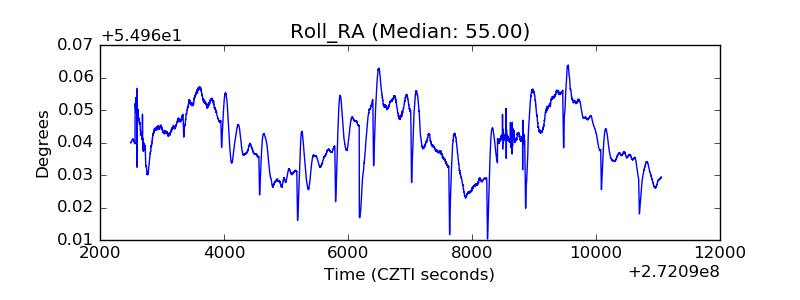 |
| Veto Counter | 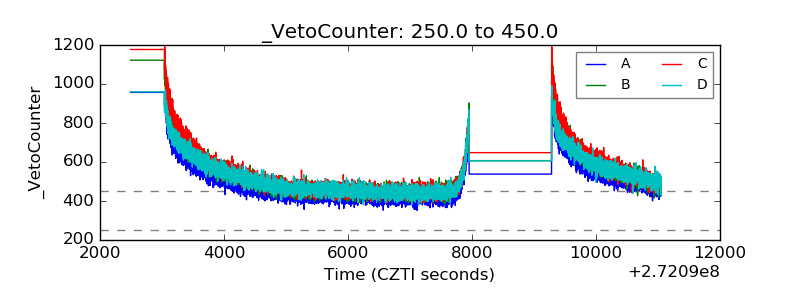 |