| Param | Original file | Final file |
|---|---|---|
| Filename | modeM0/AS1A04_037T02_9000002310_15589cztM0_level2.evt | modeM0/AS1A04_037T02_9000002310_15589cztM0_level2_quad_clean.evt |
| Size (bytes) | 410,673,600 | 75,286,080 |
| Size | 391.6 MB | 71.8 MB |
| Events in quadrant A | 2,946,953 | 486,861 |
| Events in quadrant B | 2,843,081 | 494,132 |
| Events in quadrant C | 2,787,003 | 468,235 |
| Events in quadrant D | 3,498,503 | 457,898 |
| Mode SS | |||
|---|---|---|---|
| Quadrant | BADHDUFLAG | Total packets | Discarded packets |
| A | 0 | 110 | 0 |
| B | 0 | 110 | 0 |
| C | 0 | 110 | 0 |
| D | 0 | 110 | 0 |
| Mode M0 | |||
|---|---|---|---|
| Quadrant | BADHDUFLAG | Total packets | Discarded packets |
| A | 0 | 11869 | 2 |
| B | 0 | 11471 | 1 |
| C | 0 | 11269 | 1 |
| D | 0 | 13675 | 1 |
| Mode M9 | |||
|---|---|---|---|
| Quadrant | BADHDUFLAG | Total packets | Discarded packets |
| A | 0 | 13 | 0 |
| B | 0 | 13 | 0 |
| C | 0 | 13 | 0 |
| D | 0 | 13 | 0 |
| Quadrant | Total seconds | Saturated seconds | Saturation percentage |
|---|---|---|---|
| A | 5316 | 78 | 1.467269% |
| B | 5316 | 95 | 1.787058% |
| C | 5316 | 102 | 1.918736% |
| D | 5316 | 146 | 2.746426% |
Noise dominated data is calculated using 1-second bins in cleaned event files. If a bin has >2000 counts, and if more than 50% of those come from <1% of pixels, then it is considered to be noise-dominated and hence unusable.
| Quadrant | # 1 sec bins | Bins with >0 counts | Bins with >2000 counts | High rate bins dominated by noise | Noise dominated (total time) | Noise dominated (detector-on time) | Marked lightcurve |
|---|---|---|---|---|---|---|---|
| A | 6632 | 5317 | 0 | 0 | 0.00% | 0.00% | 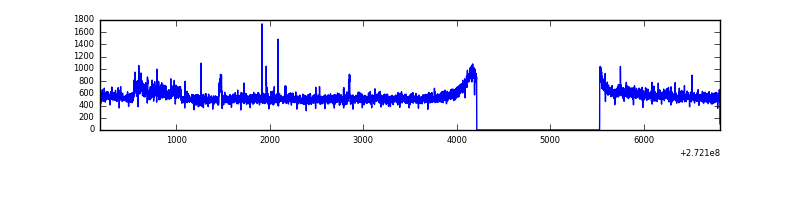 |
| B | 6632 | 5317 | 2 | 2 | 0.03% | 0.04% | 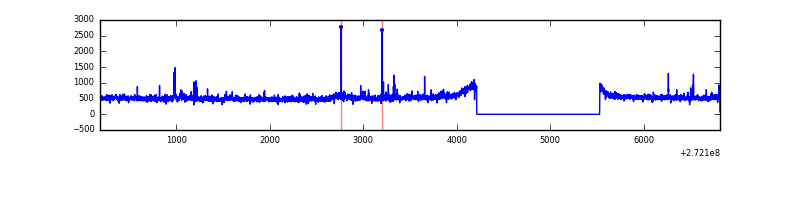 |
| C | 6632 | 5317 | 0 | 0 | 0.00% | 0.00% | 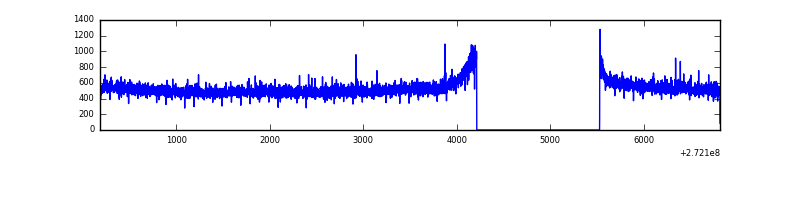 |
| D | 6632 | 5317 | 65 | 65 | 0.98% | 1.22% | 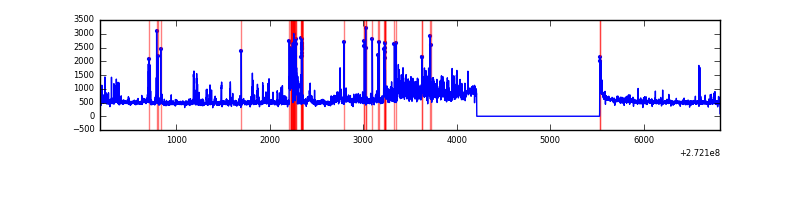 |
Top three noisy pixels from each quadrant. If the there are fewer than three noisy pixels in the level2.evt file, extra rows are filled as -1
| Pixel properties | Quadrant properties | ||||||
|---|---|---|---|---|---|---|---|
| Quadrant | DetID | PixID | Counts | Sigma | Mean | Median | Sigma |
| A | 0 | 253 | 185417 | 1281.71 | 715 | 700 | 144.1 |
| A | 9 | 143 | 7190 | 45.03 | 715 | 700 | 144.1 |
| A | 0 | 226 | 6292 | 38.8 | 715 | 700 | 144.1 |
| B | 0 | 189 | 43668 | 321.25 | 704 | 689 | 133.8 |
| B | 4 | 48 | 15452 | 110.34 | 704 | 689 | 133.8 |
| B | 12 | 111 | 14909 | 106.29 | 704 | 689 | 133.8 |
| C | 14 | 238 | 106028 | 668.92 | 679 | 684 | 157.5 |
| C | 3 | 233 | 31244 | 194.05 | 679 | 684 | 157.5 |
| C | 13 | 61 | 4843 | 26.41 | 679 | 684 | 157.5 |
| D | 12 | 110 | 668053 | 3968.12 | 697 | 678 | 168.2 |
| D | 2 | 16 | 43854 | 256.72 | 697 | 678 | 168.2 |
| D | 10 | 70 | 42561 | 249.03 | 697 | 678 | 168.2 |
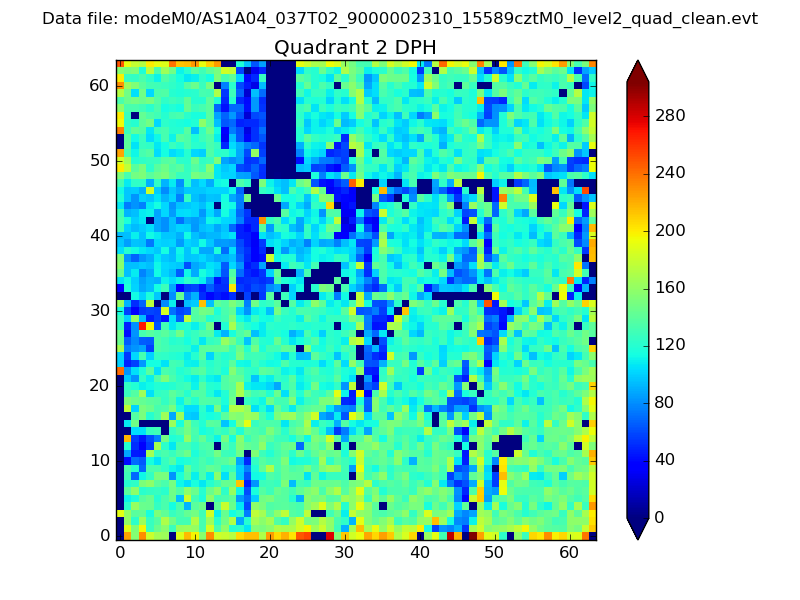
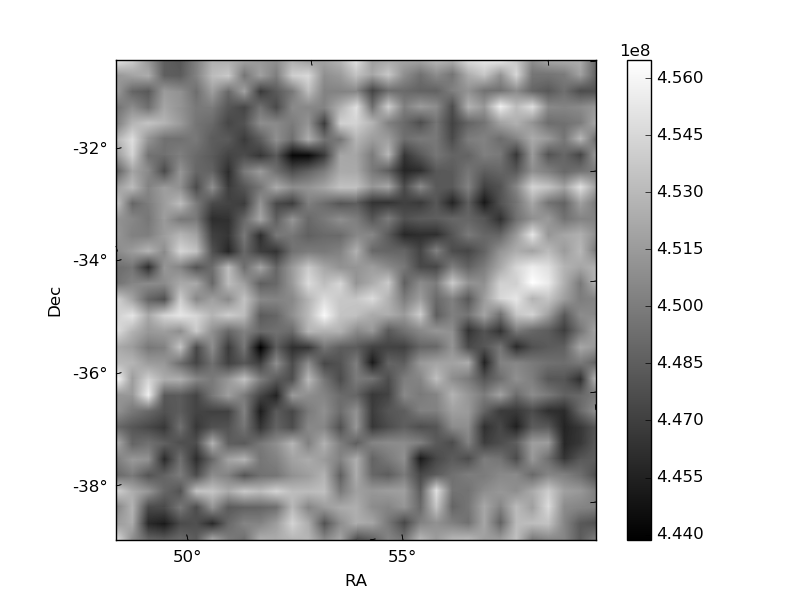
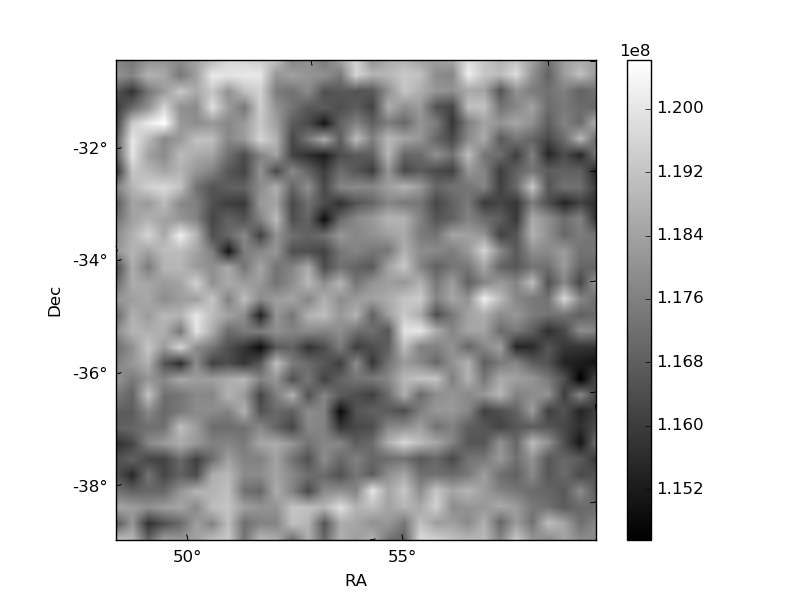
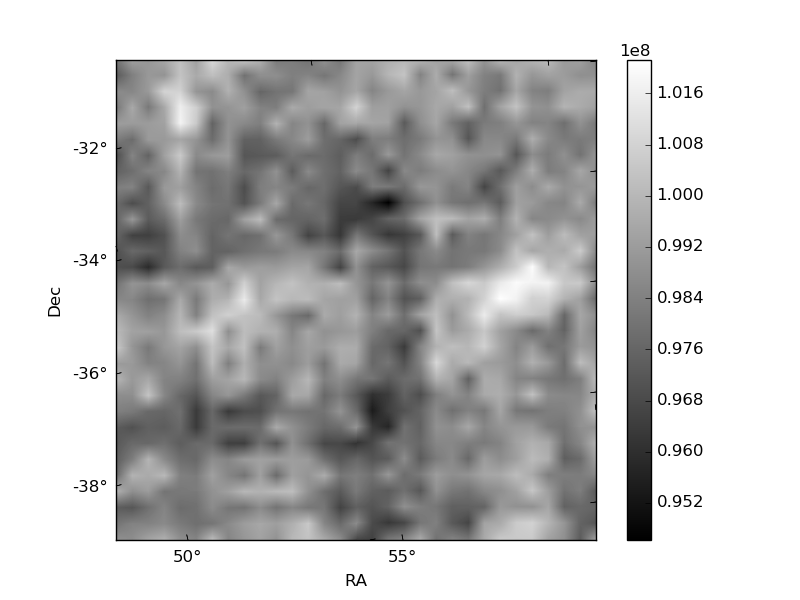
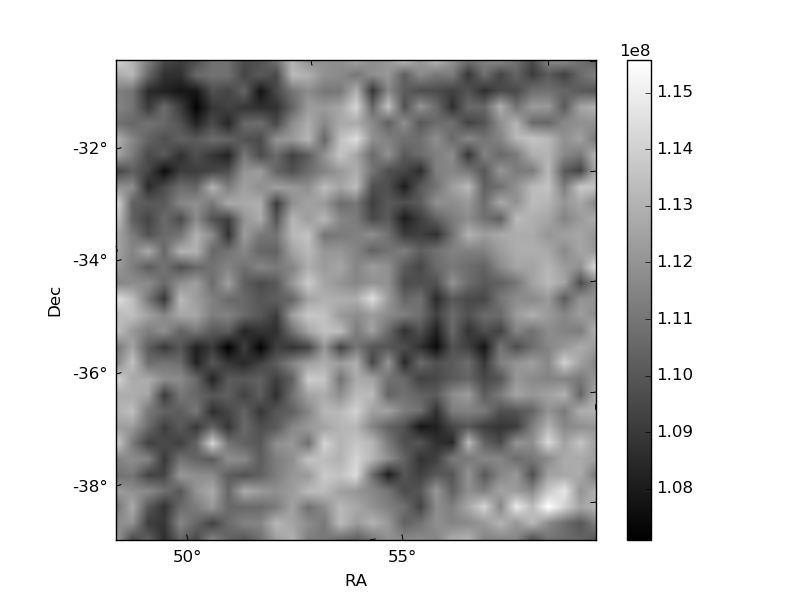
Histogram calculated using DETX and DETY for each event in the final _common_clean file
| Quadrant A | 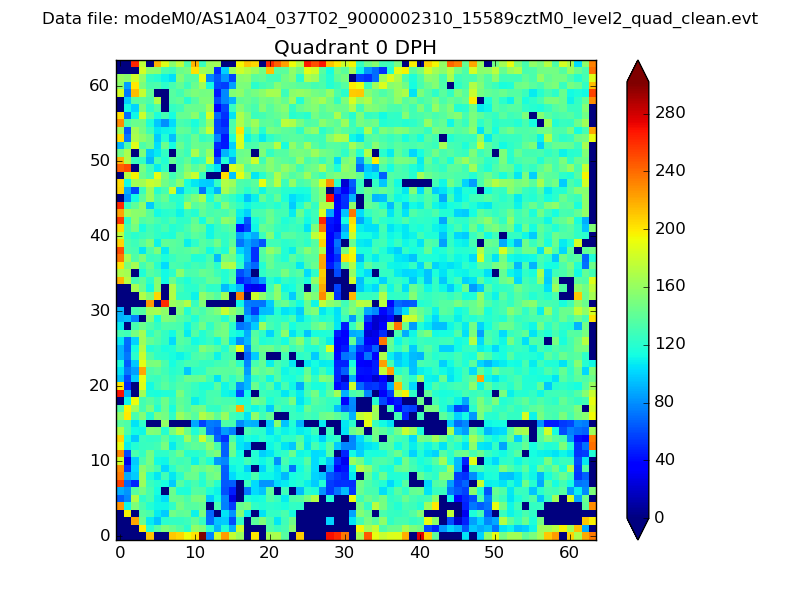 |
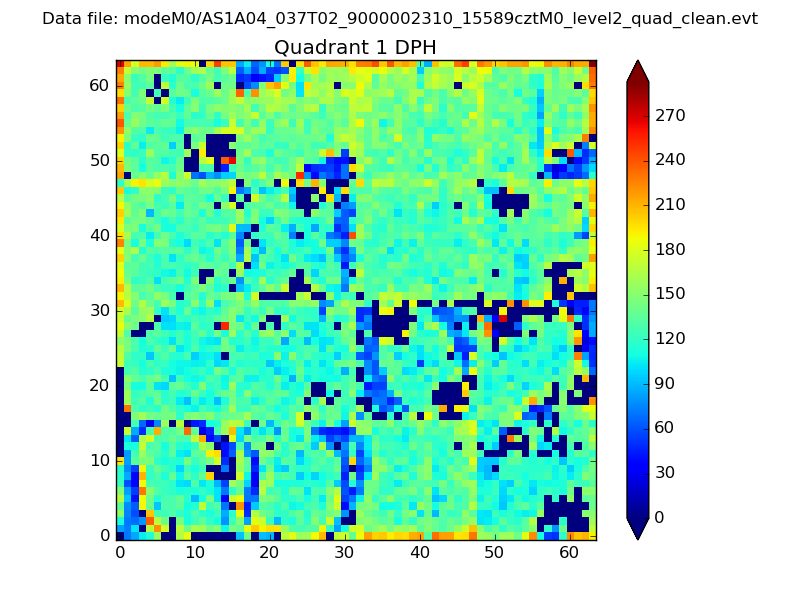 |
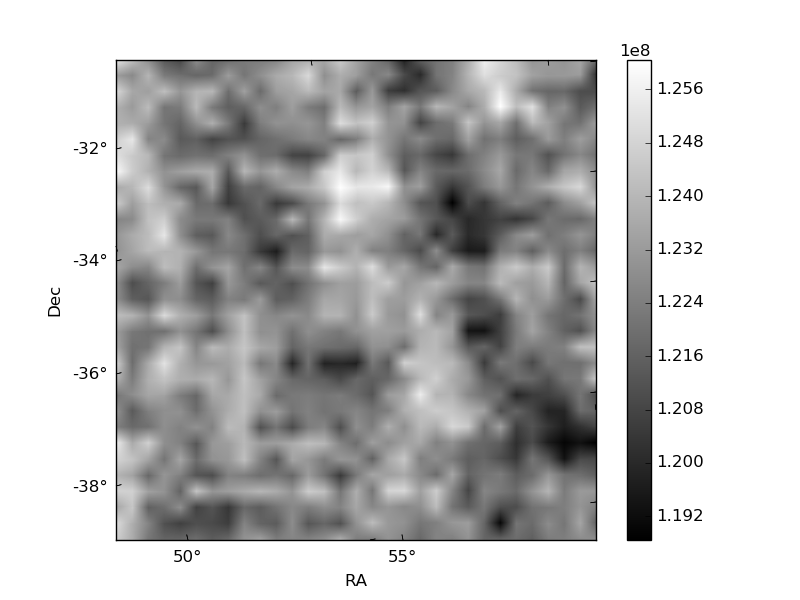
Quadrant B |
|---|---|---|---|
| Quadrant D | 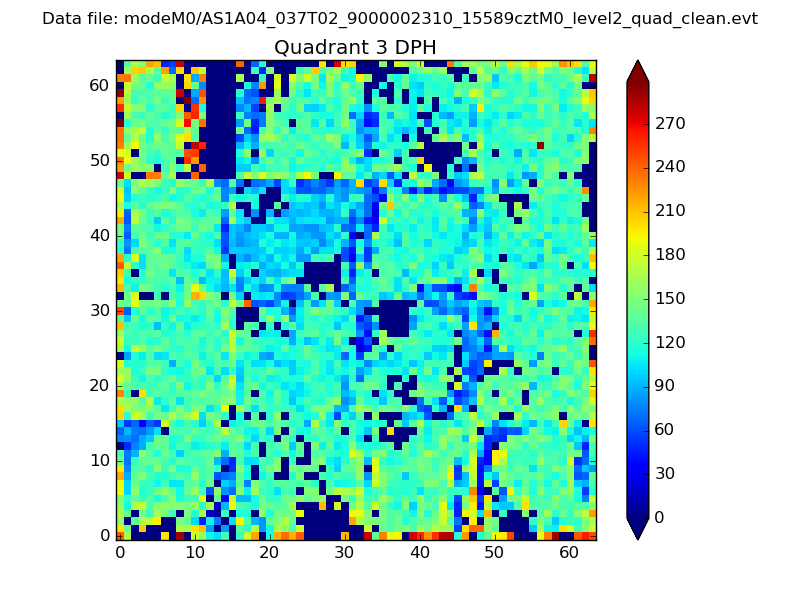 |
 |
Quadrant C |
| Plot type | Count rate plots | Images |
|---|---|---|
| Comparison with Poisson distribution Blue bars denote a histogram of data divided into 1 sec bins. Red curve is a Poisson curve with rate = median count rate of data. |
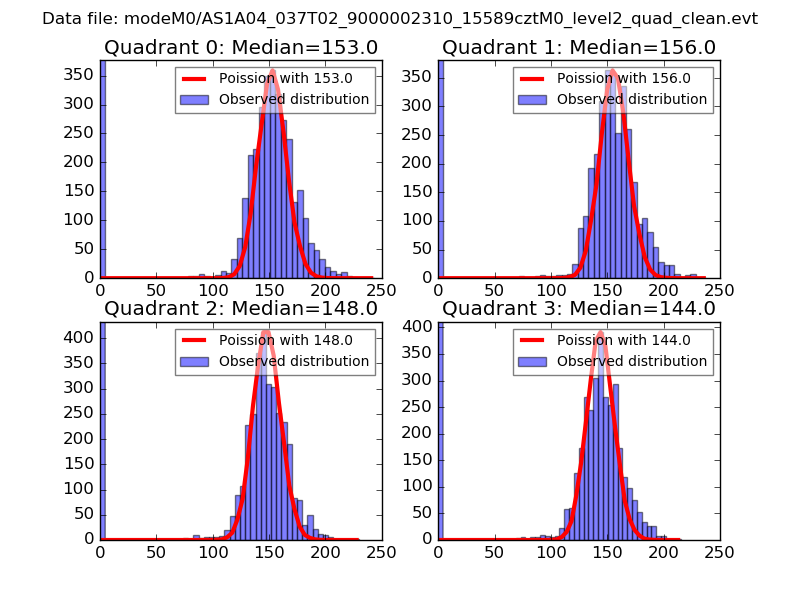 |
 |
| Quadrant-wise count rates Data is divided into 100 sec bins |
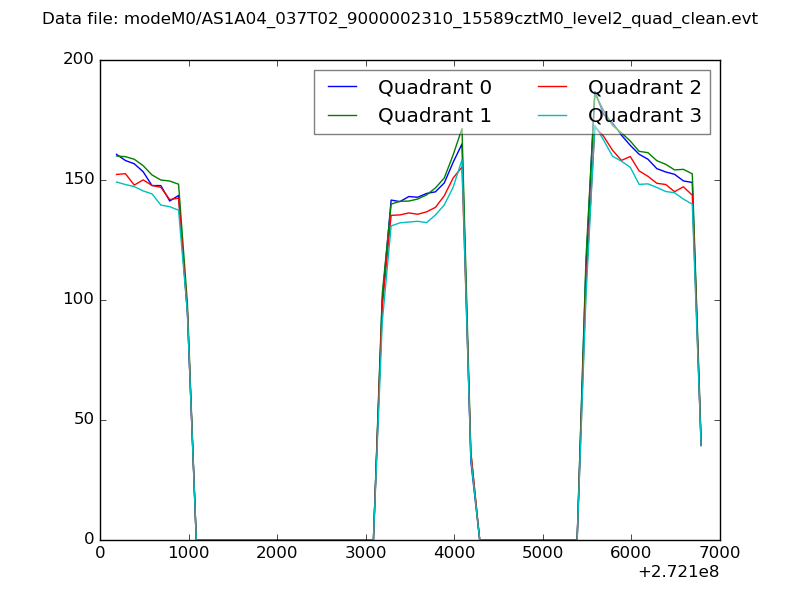 |
|
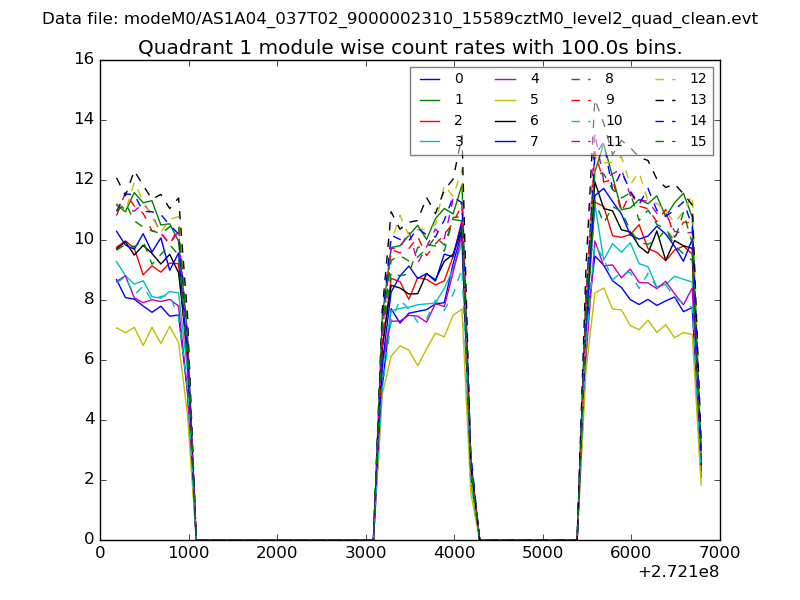
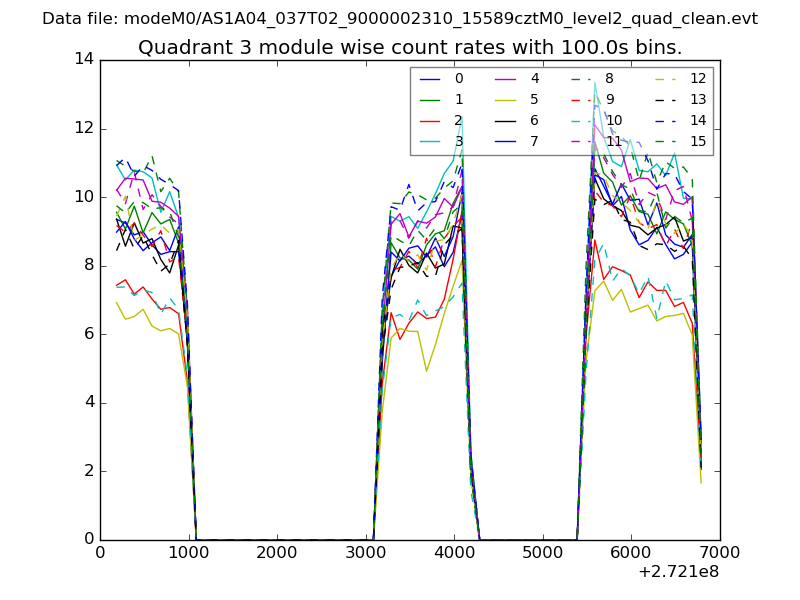
| Module-wise count rates for Quadrant A Data is divided into 100 sec bins |
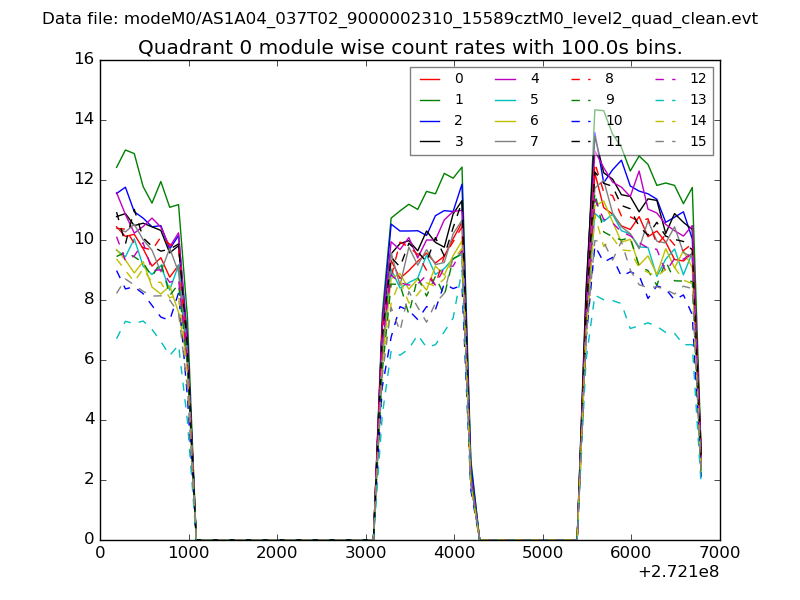 |
 |
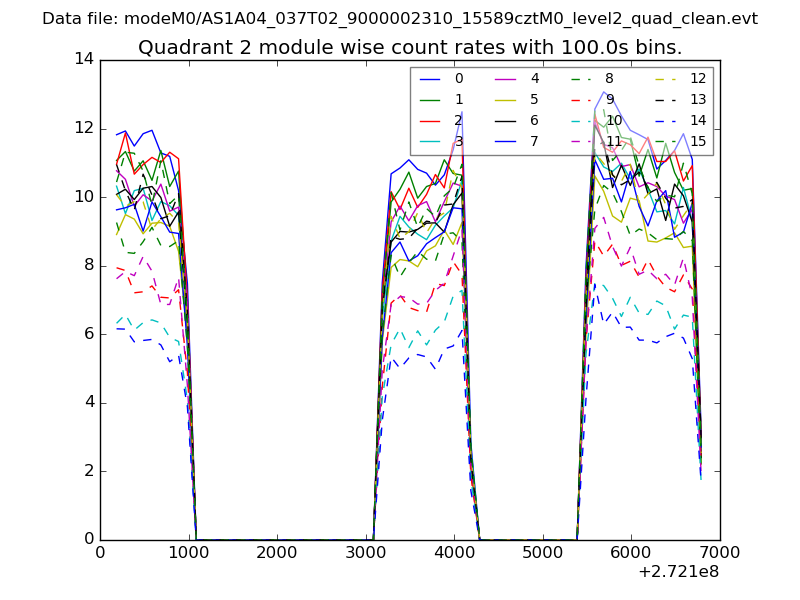
| Module-wise count rates for Quadrant B Data is divided into 100 sec bins |
 |
 |
| Module-wise count rates for Quadrant C Data is divided into 100 sec bins |
 |
 |
| Module-wise count rates for Quadrant D Data is divided into 100 sec bins |
 |
 |
| Parameter | Plot |
|---|---|
| CZT HV Monitor | 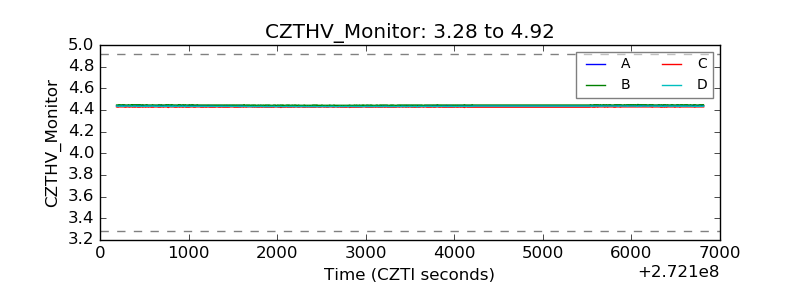 |
| D_VDD |  |
| Temperature 1 | 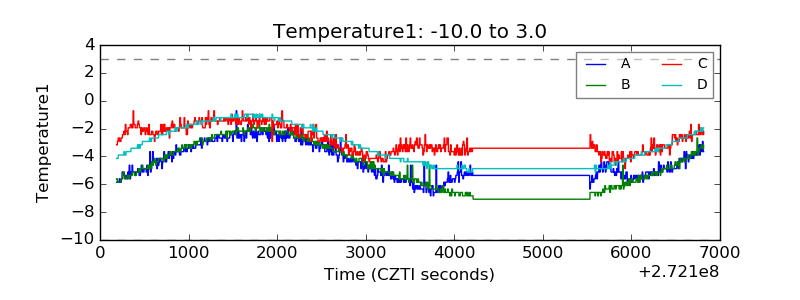 |
| Veto HV Monitor | 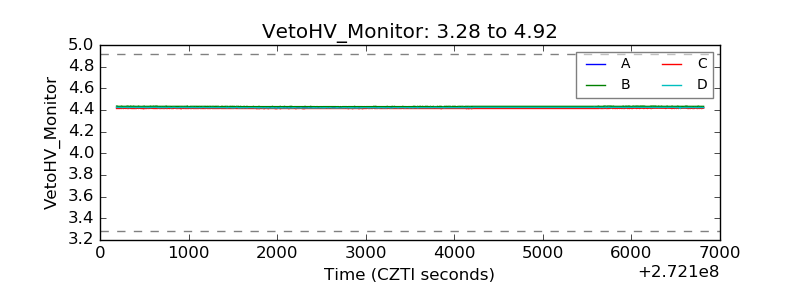 |
| Veto LLD |  |
| Alpha Counter | 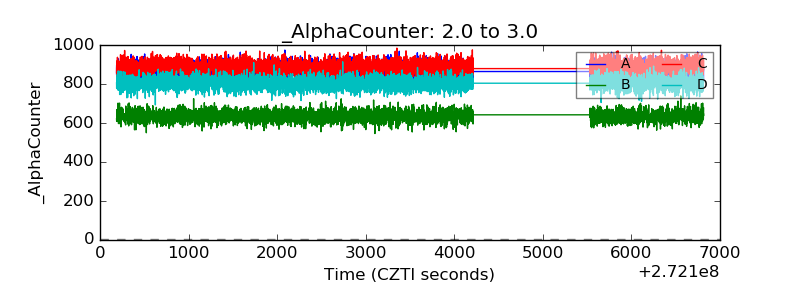 |
| _CPM_Rate | 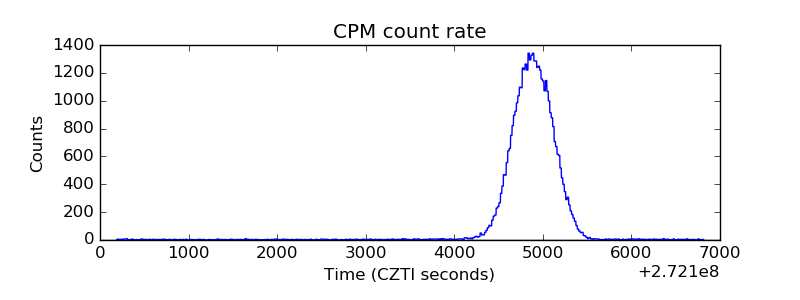 |
| CZT Counter | 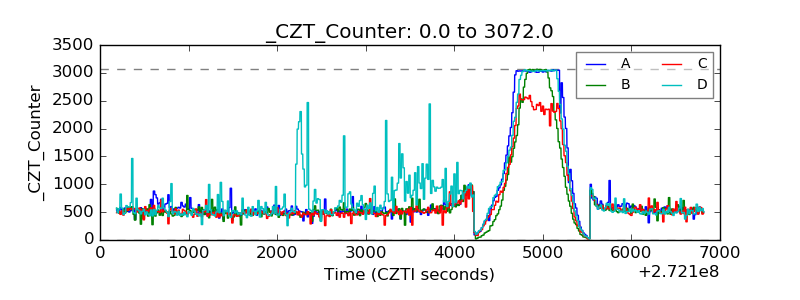 |
| +2.5 Volts monitor | 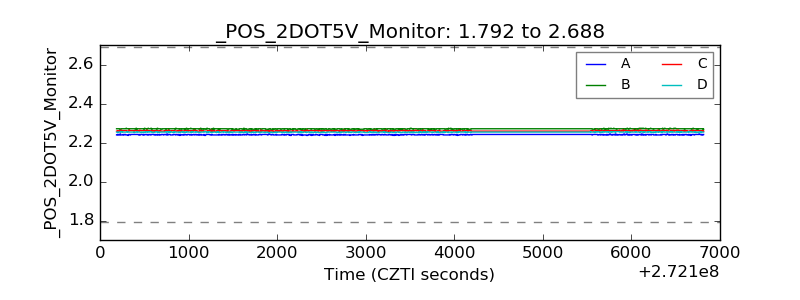 |
| +5 Volts monitor |  |
| _ROLL_ROT |  |
| _Roll_DEC | 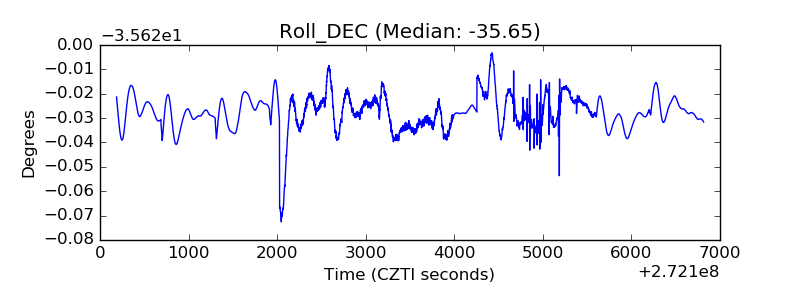 |
| _Roll_RA | 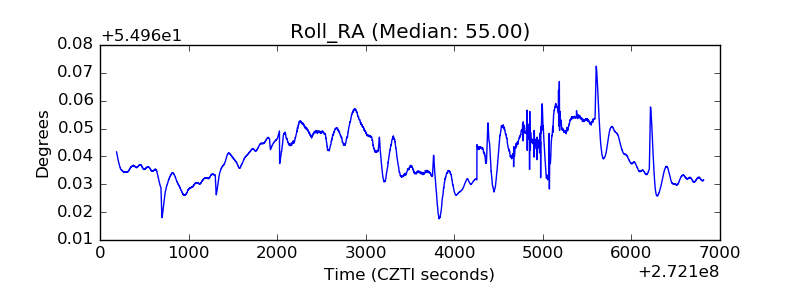 |
| Veto Counter | 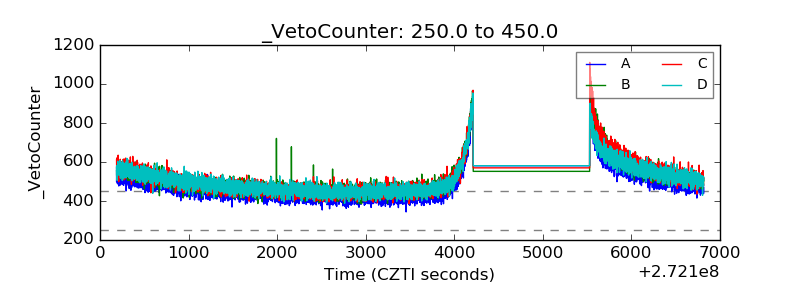 |