| Param | Original file | Final file |
|---|---|---|
| Filename | modeM0/AS1A04_037T02_9000002310_15590cztM0_level2.evt | modeM0/AS1A04_037T02_9000002310_15590cztM0_level2_quad_clean.evt |
| Size (bytes) | 463,305,600 | 77,950,080 |
| Size | 441.8 MB | 74.3 MB |
| Events in quadrant A | 3,507,708 | 489,241 |
| Events in quadrant B | 3,351,211 | 498,427 |
| Events in quadrant C | 3,204,328 | 474,134 |
| Events in quadrant D | 3,544,259 | 463,290 |
| Mode SS | |||
|---|---|---|---|
| Quadrant | BADHDUFLAG | Total packets | Discarded packets |
| A | 0 | 126 | 0 |
| B | 0 | 126 | 0 |
| C | 0 | 126 | 0 |
| D | 0 | 126 | 0 |
| Mode M0 | |||
|---|---|---|---|
| Quadrant | BADHDUFLAG | Total packets | Discarded packets |
| A | 0 | 14035 | 2 |
| B | 0 | 13579 | 1 |
| C | 0 | 13162 | 1 |
| D | 0 | 14256 | 1 |
| Mode M9 | |||
|---|---|---|---|
| Quadrant | BADHDUFLAG | Total packets | Discarded packets |
| A | 0 | 12 | 0 |
| B | 0 | 12 | 0 |
| C | 0 | 12 | 0 |
| D | 0 | 12 | 0 |
| Quadrant | Total seconds | Saturated seconds | Saturation percentage |
|---|---|---|---|
| A | 6240 | 117 | 1.875000% |
| B | 6240 | 127 | 2.035256% |
| C | 6240 | 129 | 2.067308% |
| D | 6240 | 183 | 2.932692% |
Noise dominated data is calculated using 1-second bins in cleaned event files. If a bin has >2000 counts, and if more than 50% of those come from <1% of pixels, then it is considered to be noise-dominated and hence unusable.
| Quadrant | # 1 sec bins | Bins with >0 counts | Bins with >2000 counts | High rate bins dominated by noise | Noise dominated (total time) | Noise dominated (detector-on time) | Marked lightcurve |
|---|---|---|---|---|---|---|---|
| A | 7446 | 6241 | 0 | 0 | 0.00% | 0.00% | 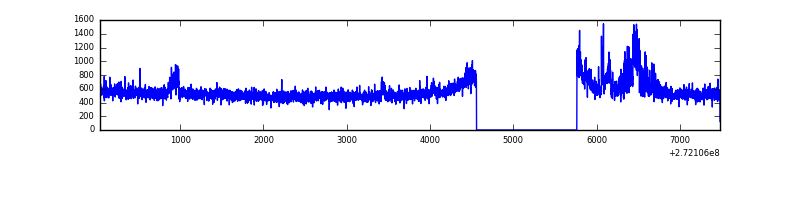 |
| B | 7446 | 6241 | 8 | 8 | 0.11% | 0.13% | 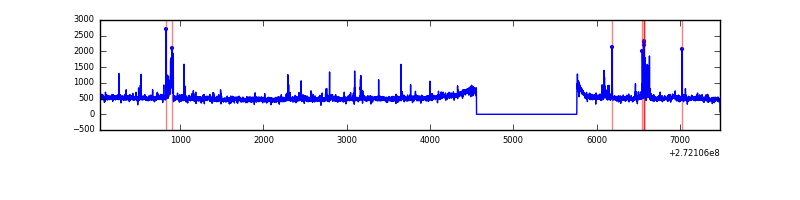 |
| C | 7446 | 6241 | 1 | 1 | 0.01% | 0.02% | 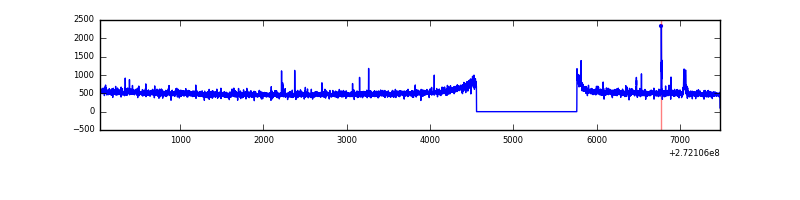 |
| D | 7446 | 6241 | 73 | 73 | 0.98% | 1.17% | 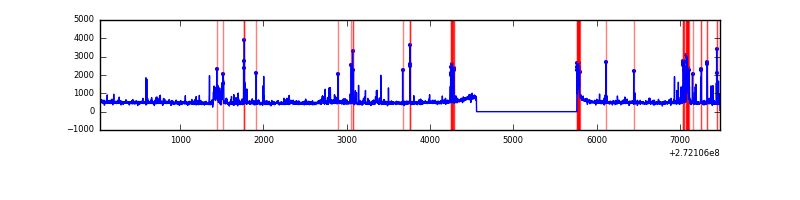 |
Top three noisy pixels from each quadrant. If the there are fewer than three noisy pixels in the level2.evt file, extra rows are filled as -1
| Pixel properties | Quadrant properties | ||||||
|---|---|---|---|---|---|---|---|
| Quadrant | DetID | PixID | Counts | Sigma | Mean | Median | Sigma |
| A | 0 | 253 | 247928 | 1500.35 | 817 | 801 | 164.7 |
| A | 15 | 157 | 111652 | 672.99 | 817 | 801 | 164.7 |
| A | 0 | 226 | 7263 | 39.23 | 817 | 801 | 164.7 |
| B | 4 | 48 | 108860 | 708.84 | 804 | 784 | 152.5 |
| B | 0 | 189 | 36128 | 231.81 | 804 | 784 | 152.5 |
| B | 4 | 173 | 23505 | 149.02 | 804 | 784 | 152.5 |
| C | 14 | 238 | 121220 | 674.06 | 775 | 782 | 178.7 |
| C | 3 | 233 | 56927 | 314.23 | 775 | 782 | 178.7 |
| C | 13 | 61 | 5429 | 26.01 | 775 | 782 | 178.7 |
| D | 1 | 52 | 146643 | 760.44 | 793 | 769 | 191.8 |
| D | 12 | 110 | 96681 | 499.99 | 793 | 769 | 191.8 |
| D | 5 | 51 | 49860 | 255.91 | 793 | 769 | 191.8 |
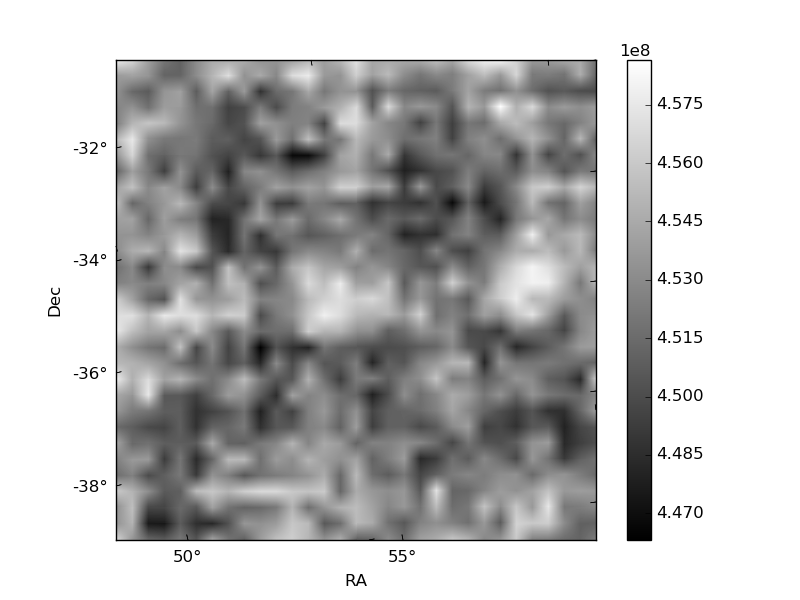
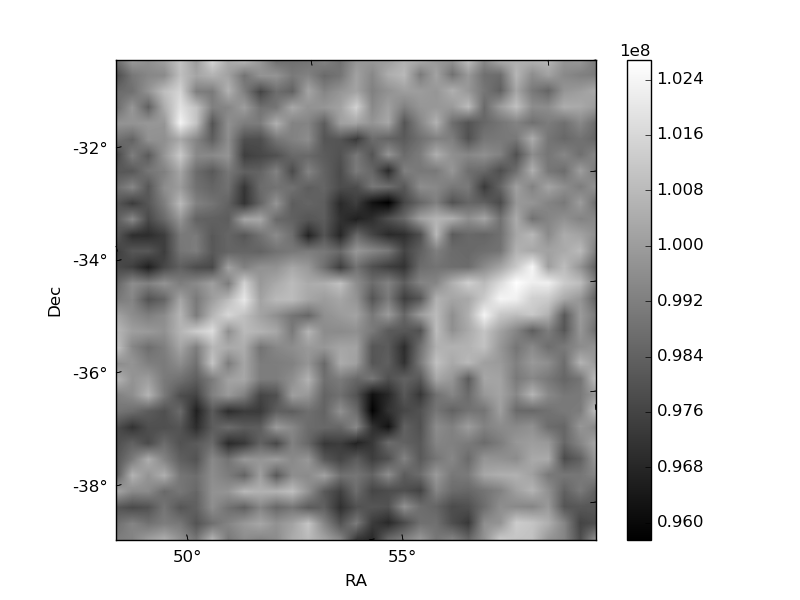
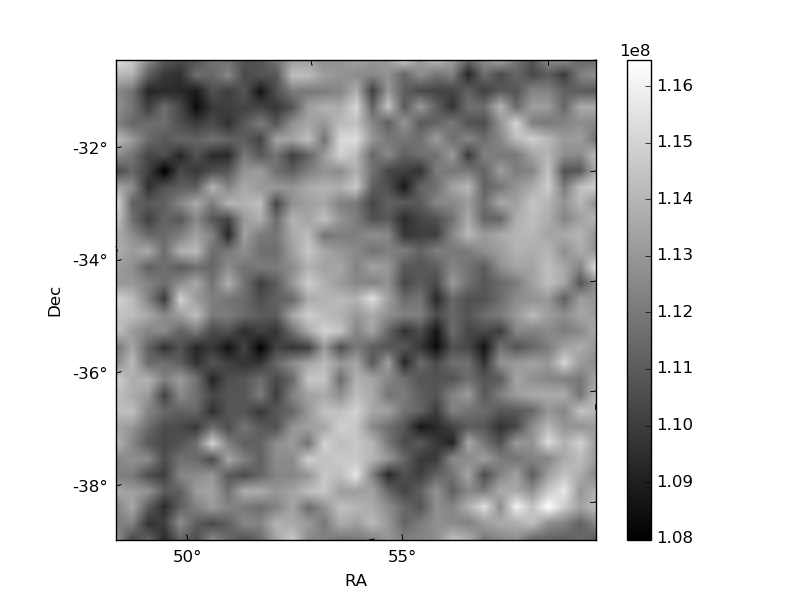
Histogram calculated using DETX and DETY for each event in the final _common_clean file
| Quadrant A | 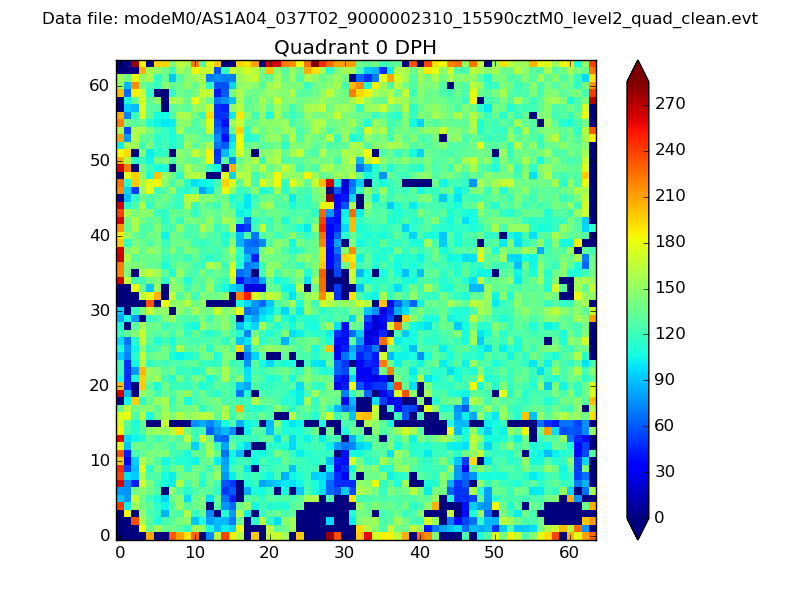 |
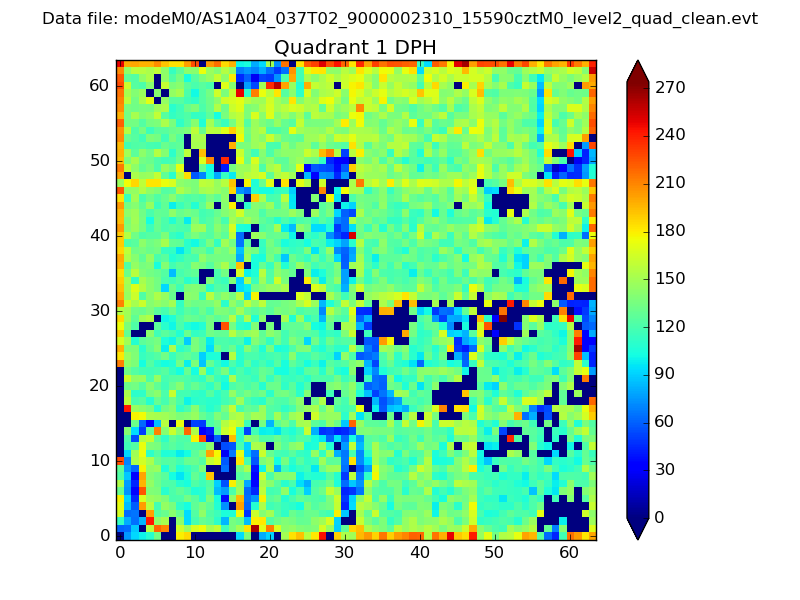 |
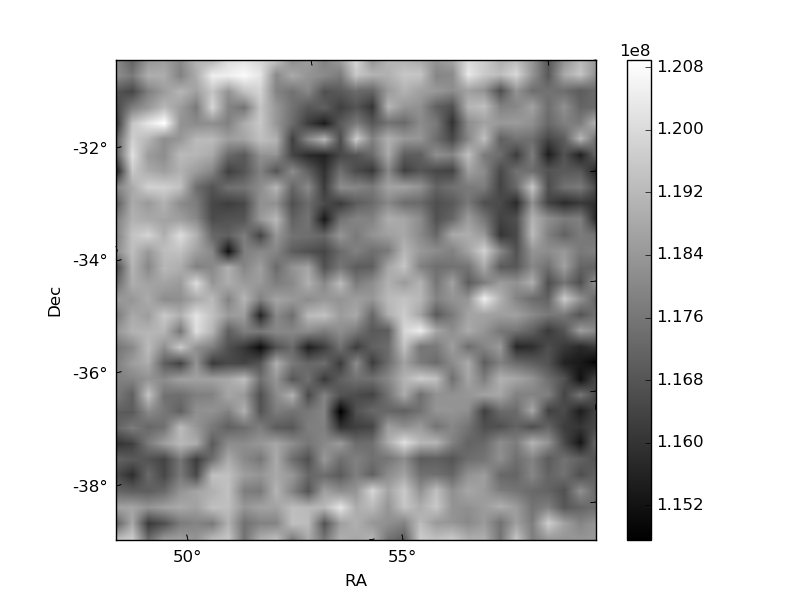
Quadrant B |
|---|---|---|---|
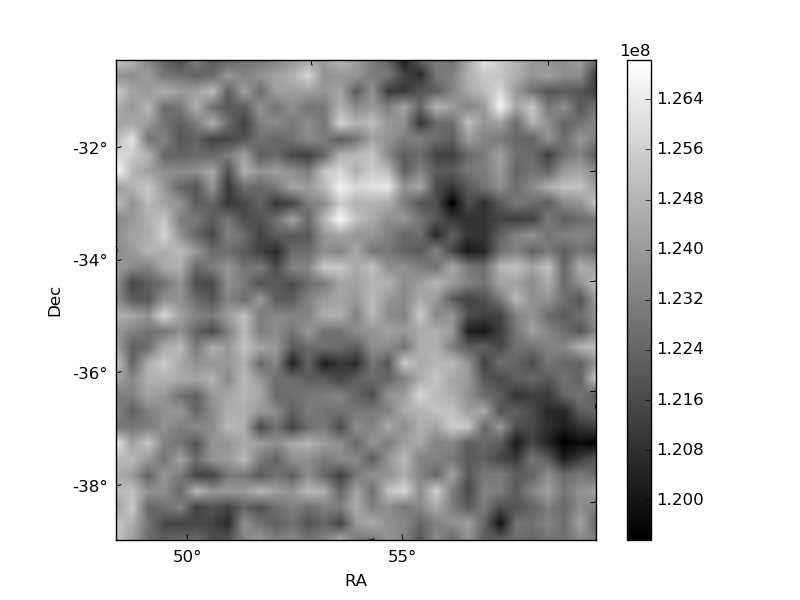
| Quadrant D | 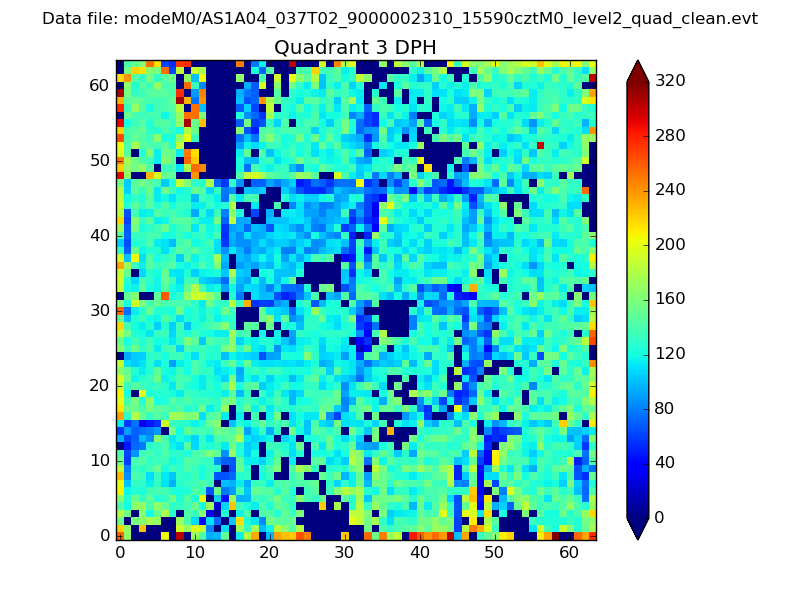 |
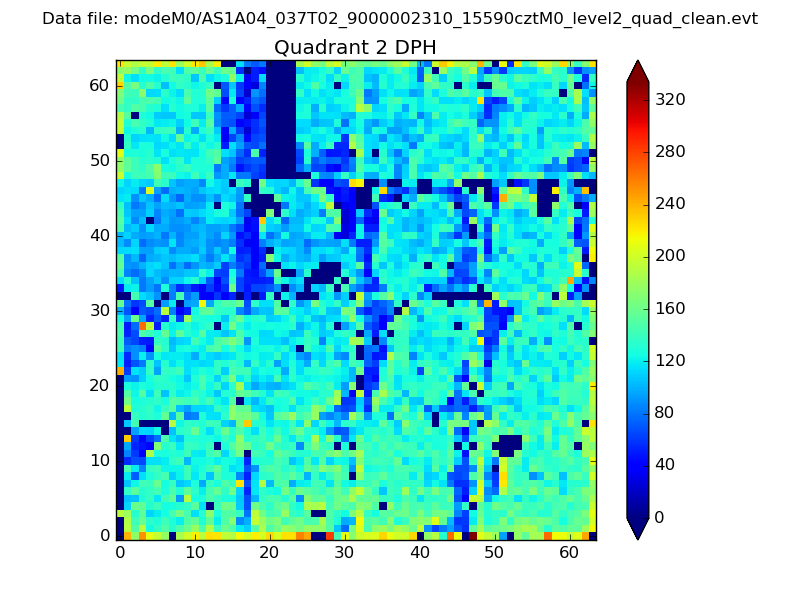 |
Quadrant C |
| Plot type | Count rate plots | Images |
|---|---|---|
| Comparison with Poisson distribution Blue bars denote a histogram of data divided into 1 sec bins. Red curve is a Poisson curve with rate = median count rate of data. |
 |
 |
| Quadrant-wise count rates Data is divided into 100 sec bins |
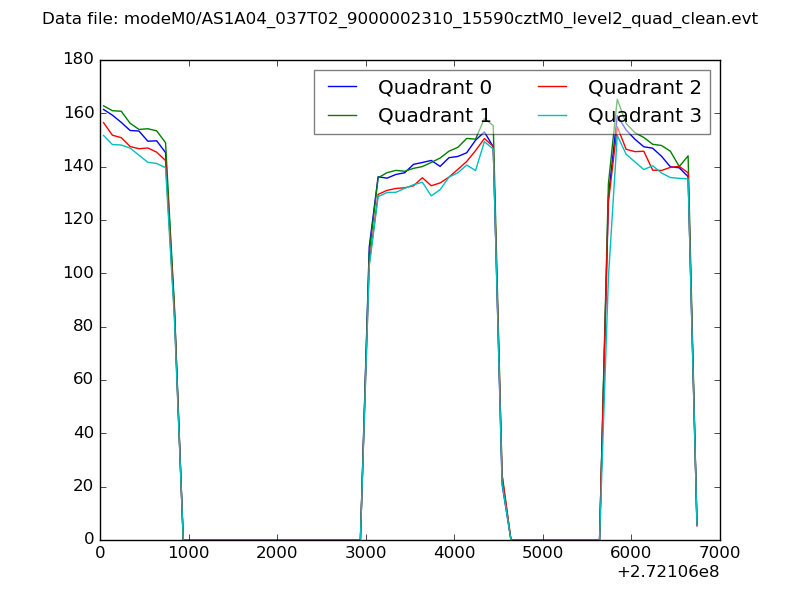 |
|
| Module-wise count rates for Quadrant A Data is divided into 100 sec bins |
 |
 |
| Module-wise count rates for Quadrant B Data is divided into 100 sec bins |
 |
 |
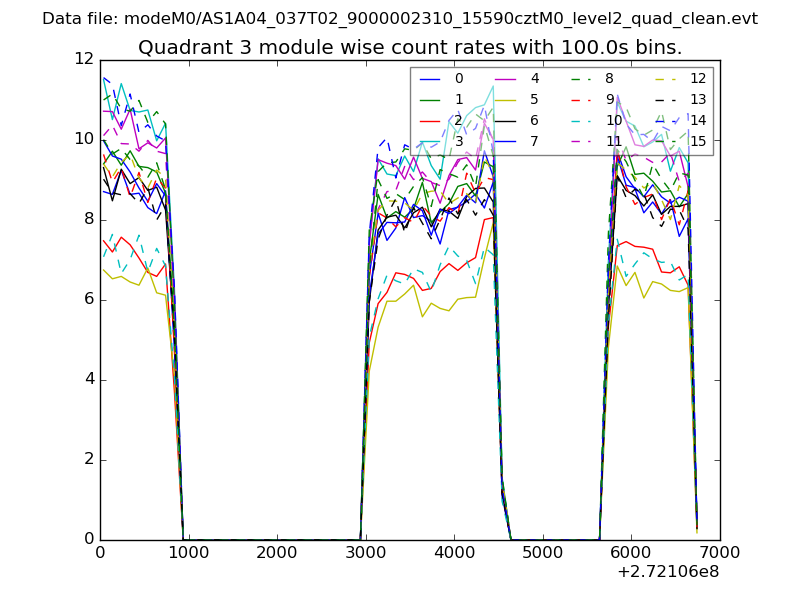
| Module-wise count rates for Quadrant C Data is divided into 100 sec bins |
 |
 |
| Module-wise count rates for Quadrant D Data is divided into 100 sec bins |
 |
 |
| Parameter | Plot |
|---|---|
| CZT HV Monitor | 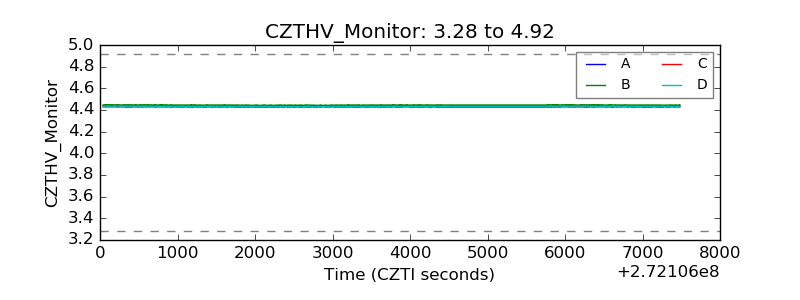 |
| D_VDD | 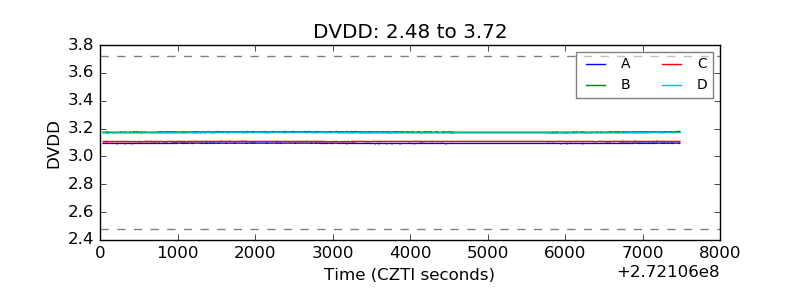 |
| Temperature 1 | 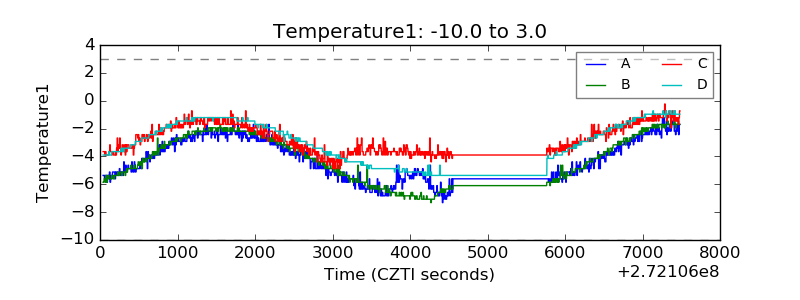 |
| Veto HV Monitor | 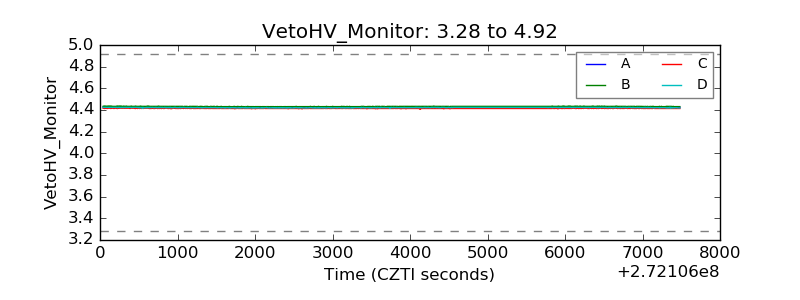 |
| Veto LLD | 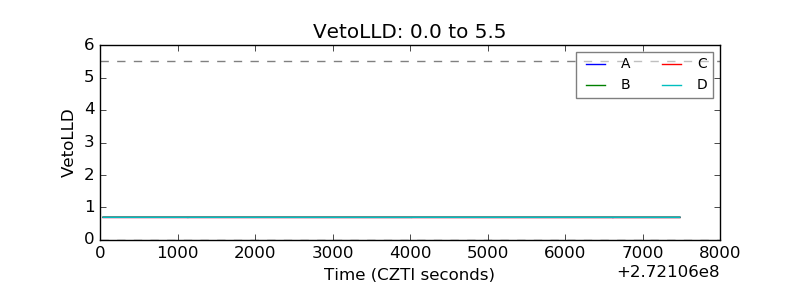 |
| Alpha Counter | 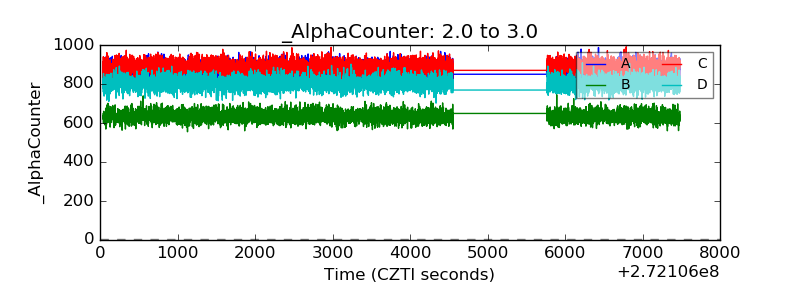 |
| _CPM_Rate | 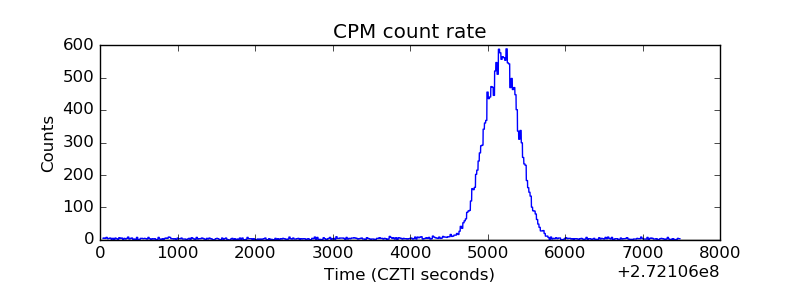 |
| CZT Counter | 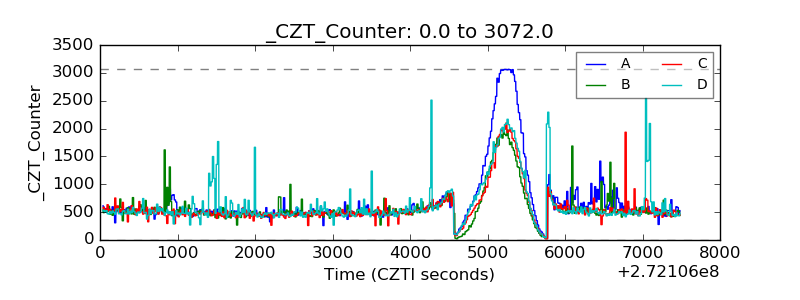 |
| +2.5 Volts monitor | 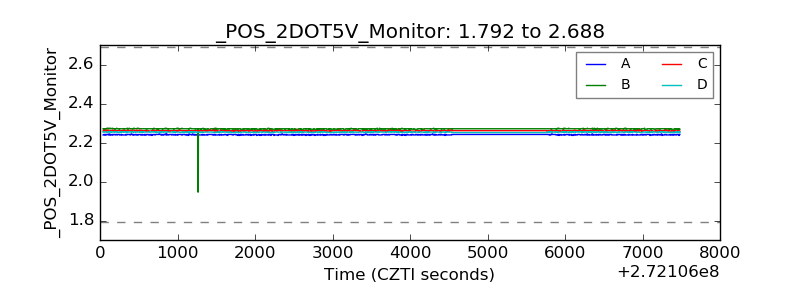 |
| +5 Volts monitor |  |
| _ROLL_ROT | 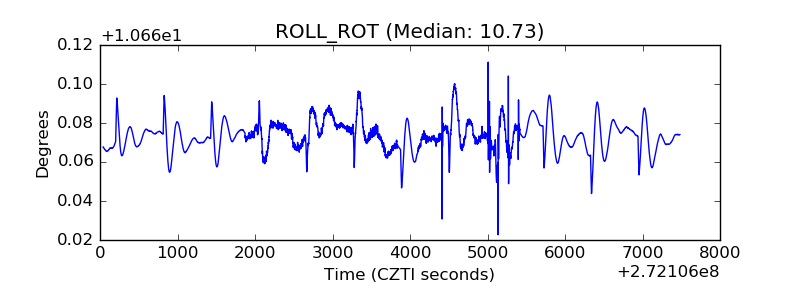 |
| _Roll_DEC | 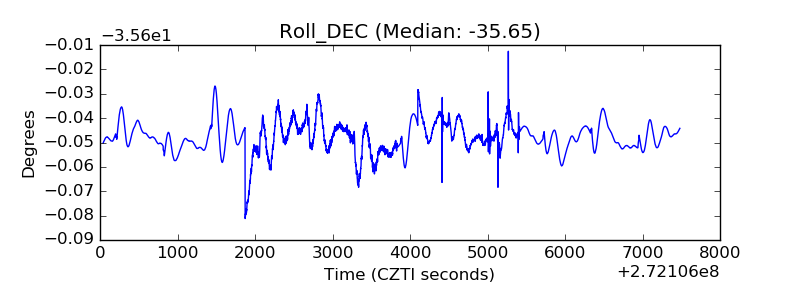 |
| _Roll_RA | 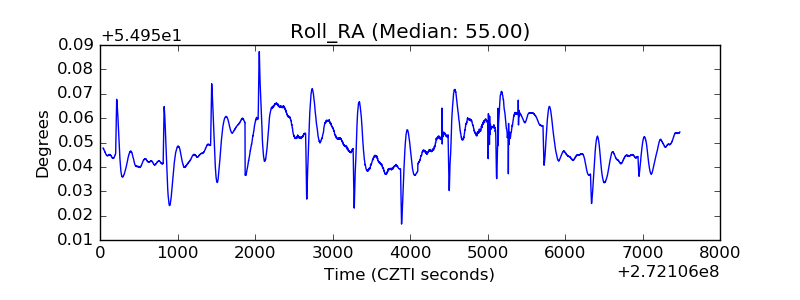 |
| Veto Counter |  |