| Param | Original file | Final file |
|---|---|---|
| Filename | modeM0/AS1A04_037T02_9000002310_15591cztM0_level2.evt | modeM0/AS1A04_037T02_9000002310_15591cztM0_level2_quad_clean.evt |
| Size (bytes) | 478,595,520 | 74,664,000 |
| Size | 456.4 MB | 71.2 MB |
| Events in quadrant A | 3,570,417 | 457,671 |
| Events in quadrant B | 3,343,834 | 465,443 |
| Events in quadrant C | 3,263,206 | 444,112 |
| Events in quadrant D | 3,870,949 | 435,628 |
| Mode SS | |||
|---|---|---|---|
| Quadrant | BADHDUFLAG | Total packets | Discarded packets |
| A | 0 | 132 | 0 |
| B | 0 | 132 | 0 |
| C | 0 | 132 | 0 |
| D | 0 | 132 | 0 |
| Mode M0 | |||
|---|---|---|---|
| Quadrant | BADHDUFLAG | Total packets | Discarded packets |
| A | 0 | 14446 | 2 |
| B | 0 | 13883 | 1 |
| C | 0 | 13616 | 1 |
| D | 0 | 15617 | 1 |
| Mode M9 | |||
|---|---|---|---|
| Quadrant | BADHDUFLAG | Total packets | Discarded packets |
| A | 0 | 10 | 0 |
| B | 0 | 10 | 0 |
| C | 0 | 10 | 0 |
| D | 0 | 10 | 0 |
| Quadrant | Total seconds | Saturated seconds | Saturation percentage |
|---|---|---|---|
| A | 6571 | 105 | 1.597930% |
| B | 6571 | 109 | 1.658804% |
| C | 6571 | 111 | 1.689241% |
| D | 6571 | 233 | 3.545883% |
Noise dominated data is calculated using 1-second bins in cleaned event files. If a bin has >2000 counts, and if more than 50% of those come from <1% of pixels, then it is considered to be noise-dominated and hence unusable.
| Quadrant | # 1 sec bins | Bins with >0 counts | Bins with >2000 counts | High rate bins dominated by noise | Noise dominated (total time) | Noise dominated (detector-on time) | Marked lightcurve |
|---|---|---|---|---|---|---|---|
| A | 7517 | 6572 | 1 | 1 | 0.01% | 0.02% | 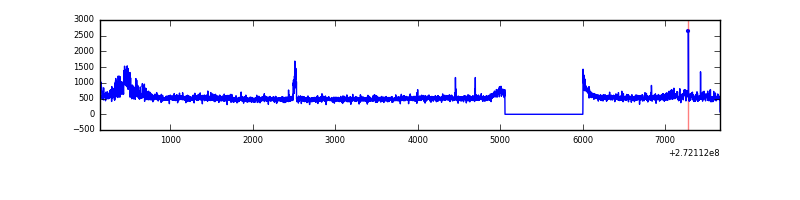 |
| B | 7517 | 6572 | 6 | 6 | 0.08% | 0.09% | 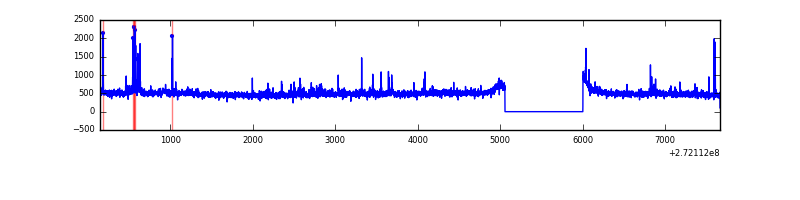 |
| C | 7517 | 6572 | 1 | 1 | 0.01% | 0.02% | 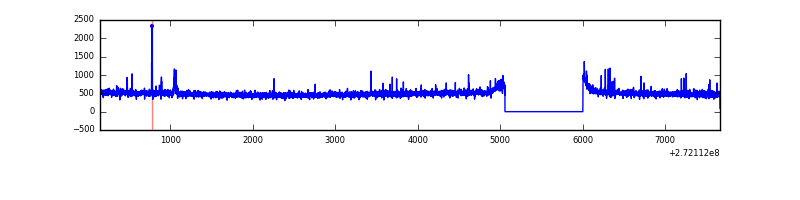 |
| D | 7517 | 6572 | 153 | 153 | 2.04% | 2.33% | 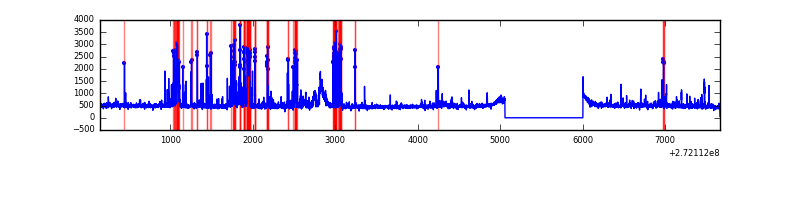 |
Top three noisy pixels from each quadrant. If the there are fewer than three noisy pixels in the level2.evt file, extra rows are filled as -1
| Pixel properties | Quadrant properties | ||||||
|---|---|---|---|---|---|---|---|
| Quadrant | DetID | PixID | Counts | Sigma | Mean | Median | Sigma |
| A | 0 | 253 | 302771 | 1806.22 | 825 | 807 | 167.2 |
| A | 15 | 157 | 76488 | 452.69 | 825 | 807 | 167.2 |
| A | 0 | 226 | 7306 | 38.87 | 825 | 807 | 167.2 |
| B | 4 | 48 | 62755 | 400.8 | 816 | 795 | 154.6 |
| B | 0 | 189 | 21756 | 135.59 | 816 | 795 | 154.6 |
| B | 0 | 214 | 21747 | 135.53 | 816 | 795 | 154.6 |
| C | 14 | 238 | 121700 | 662.78 | 786 | 789 | 182.4 |
| C | 3 | 233 | 72566 | 393.45 | 786 | 789 | 182.4 |
| C | 13 | 61 | 5468 | 25.65 | 786 | 789 | 182.4 |
| D | 10 | 70 | 217752 | 1119.12 | 798 | 774 | 193.9 |
| D | 5 | 51 | 153424 | 787.33 | 798 | 774 | 193.9 |
| D | 2 | 16 | 133117 | 682.59 | 798 | 774 | 193.9 |
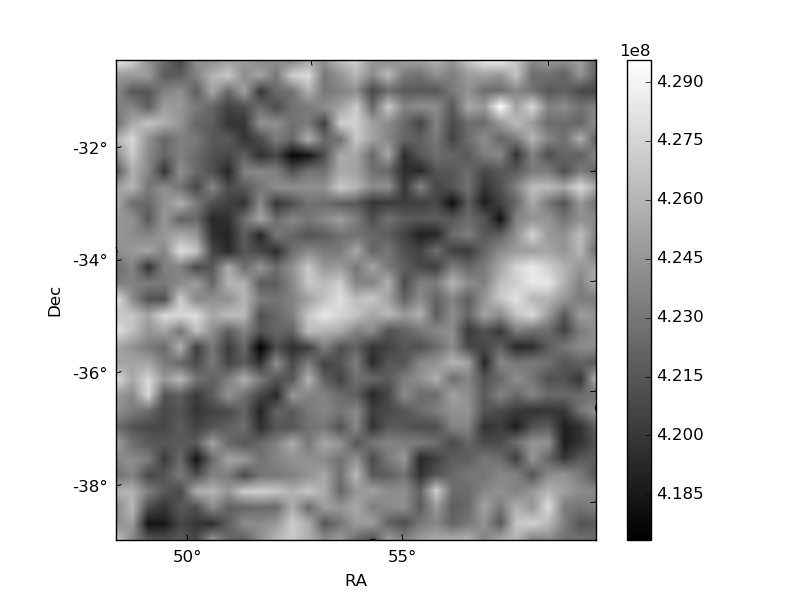
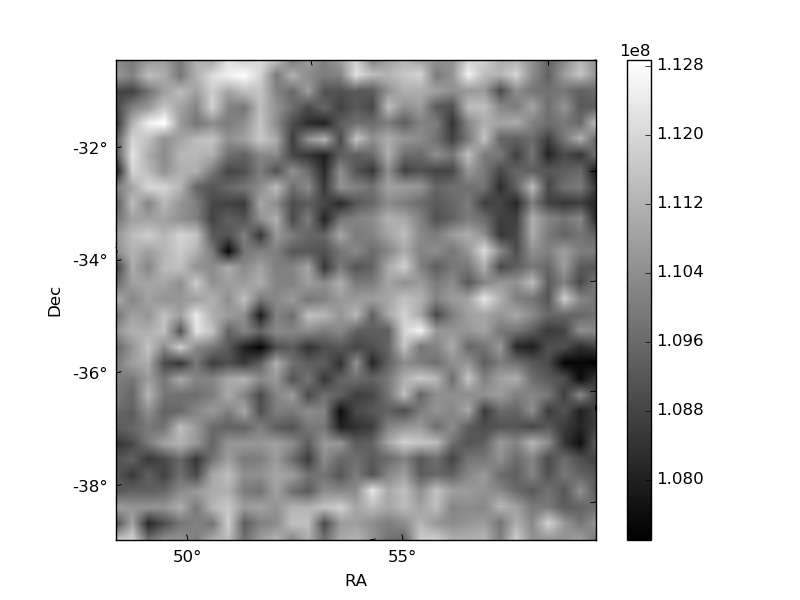
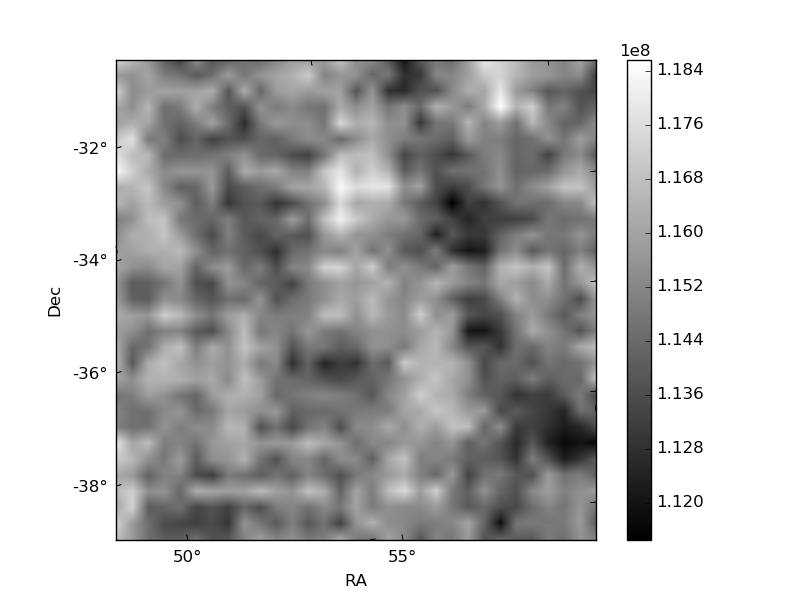
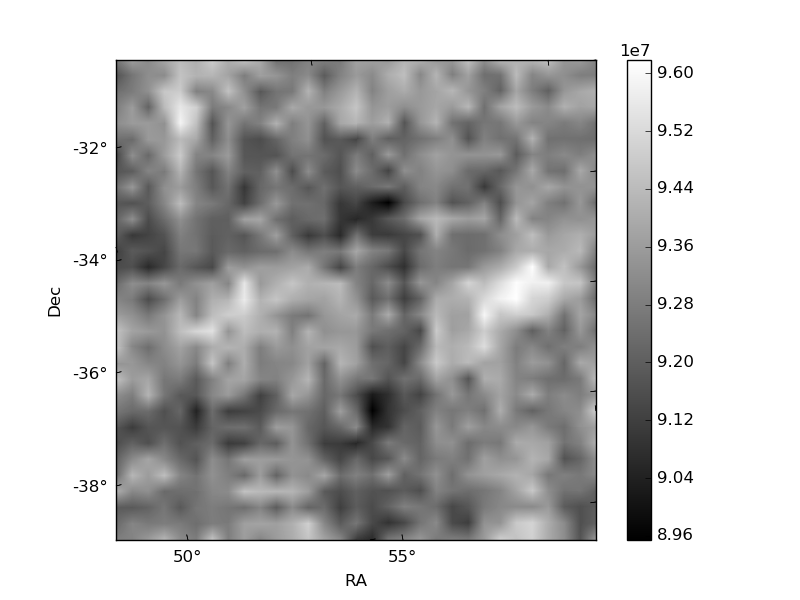
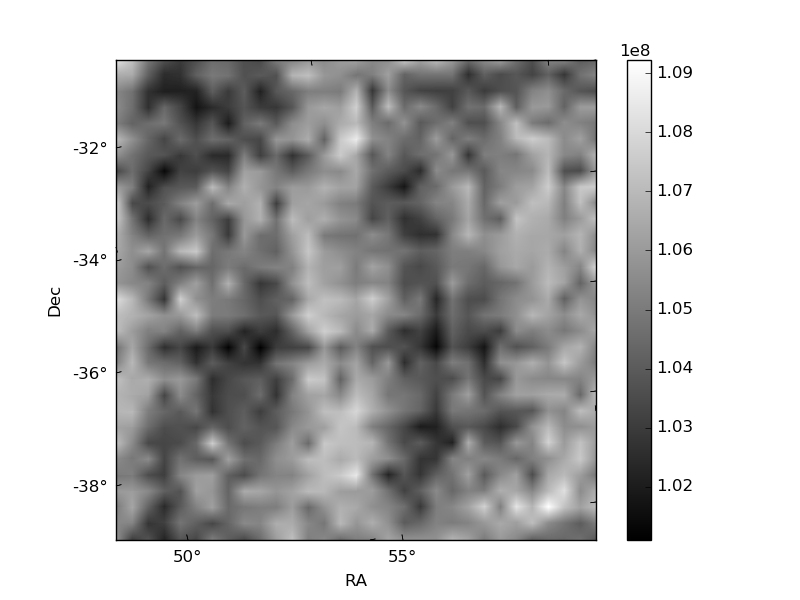
Histogram calculated using DETX and DETY for each event in the final _common_clean file
| Quadrant A | 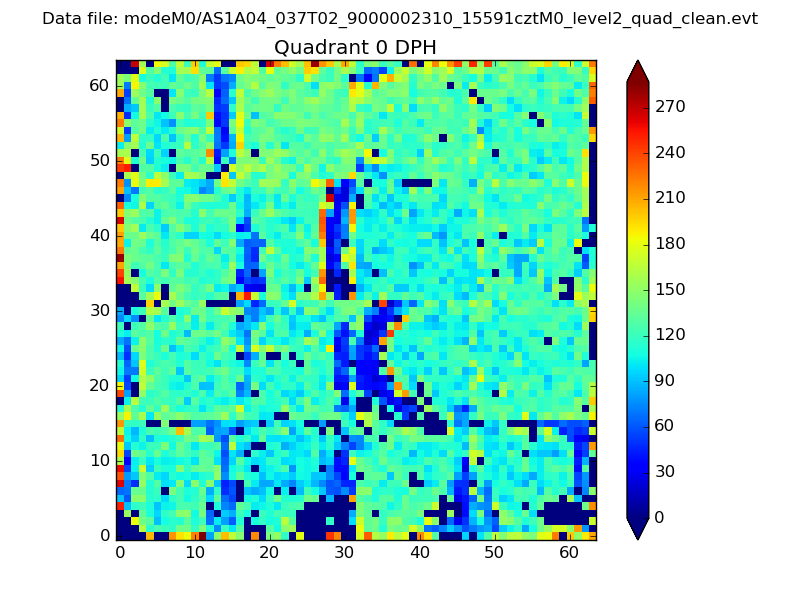 |
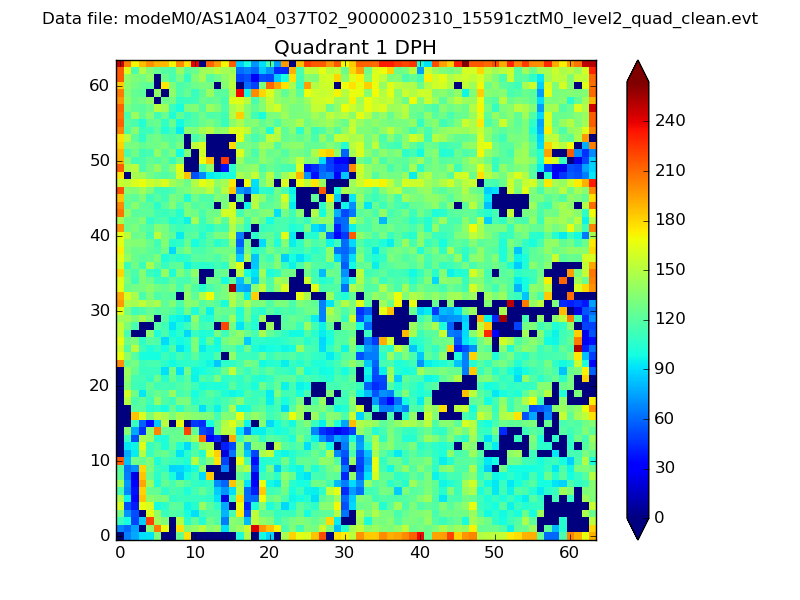 |
Quadrant B |
|---|---|---|---|
| Quadrant D |  |
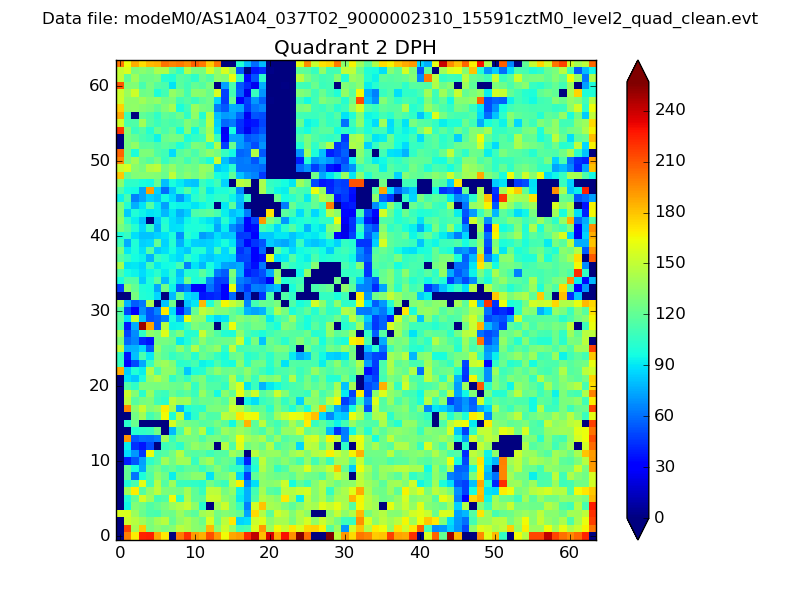 |
Quadrant C |
| Plot type | Count rate plots | Images |
|---|---|---|
| Comparison with Poisson distribution Blue bars denote a histogram of data divided into 1 sec bins. Red curve is a Poisson curve with rate = median count rate of data. |
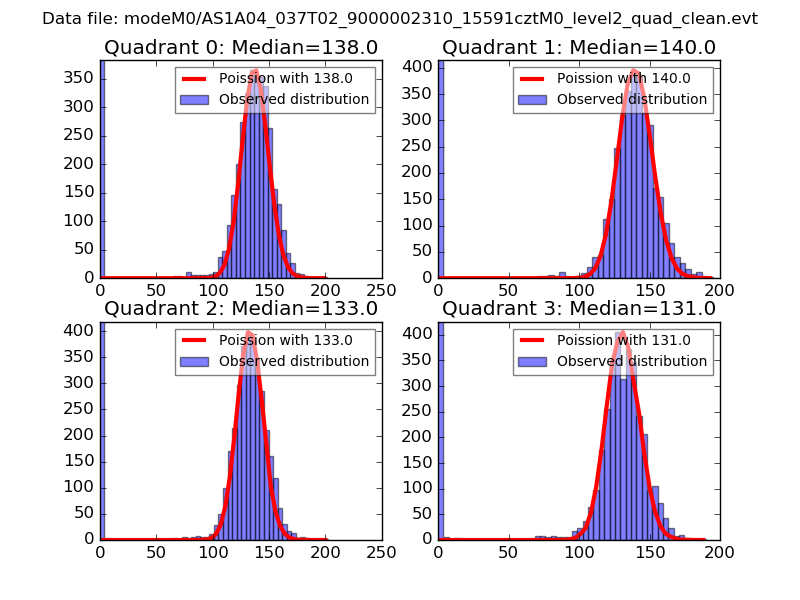 |
 |
| Quadrant-wise count rates Data is divided into 100 sec bins |
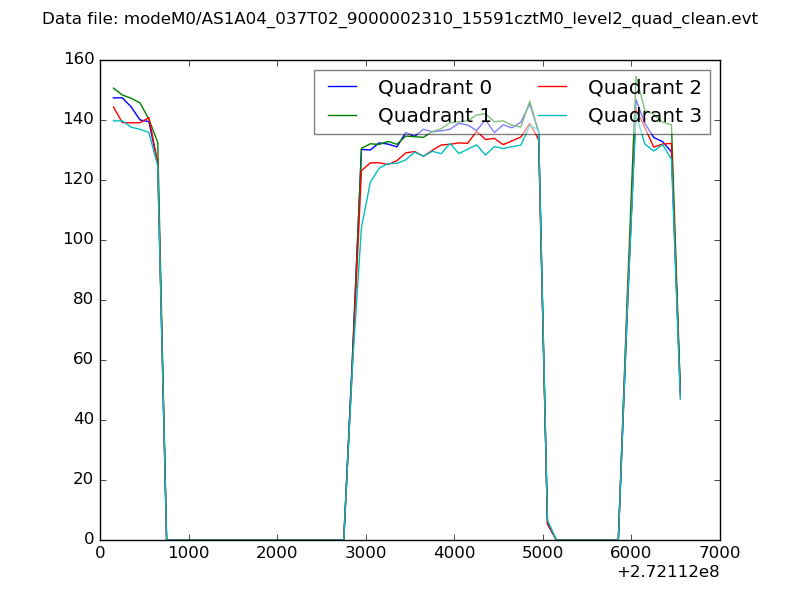 |
|
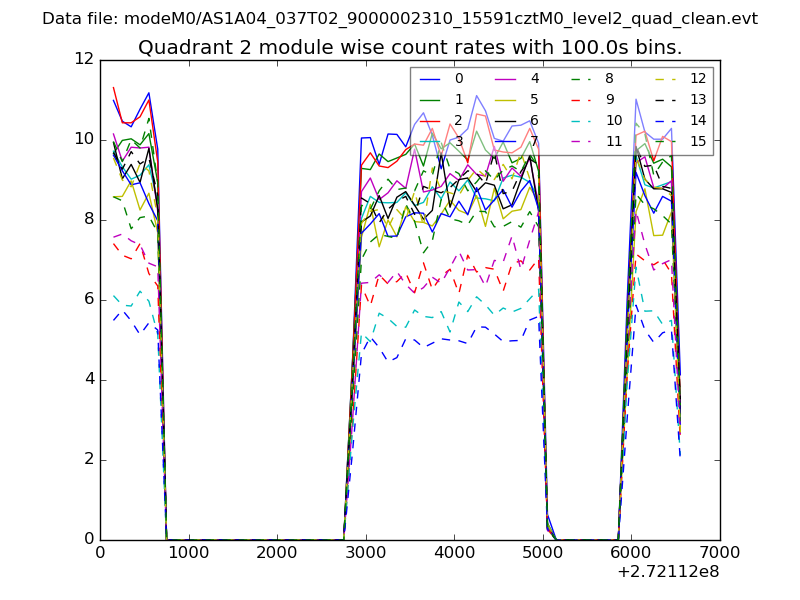
| Module-wise count rates for Quadrant A Data is divided into 100 sec bins |
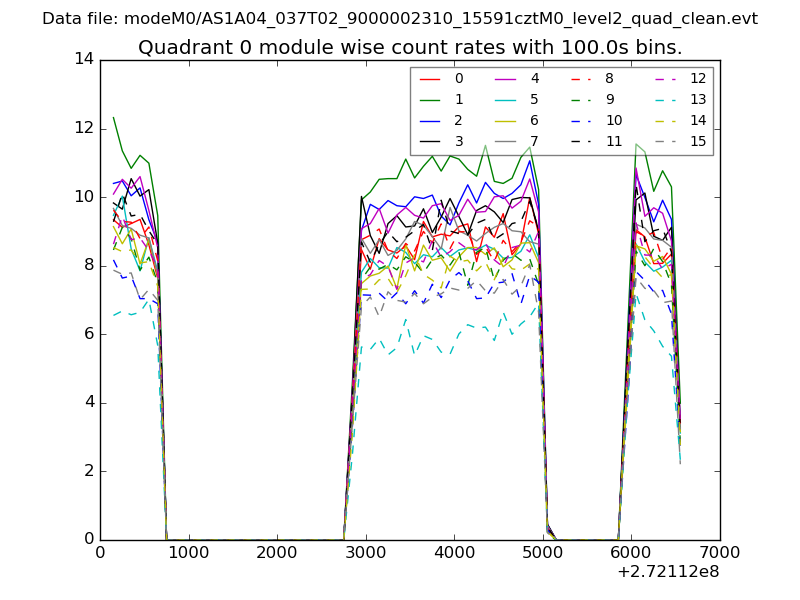 |
 |
| Module-wise count rates for Quadrant B Data is divided into 100 sec bins |
 |
 |
| Module-wise count rates for Quadrant C Data is divided into 100 sec bins |
 |
 |
| Module-wise count rates for Quadrant D Data is divided into 100 sec bins |
 |
 |
| Parameter | Plot |
|---|---|
| CZT HV Monitor | 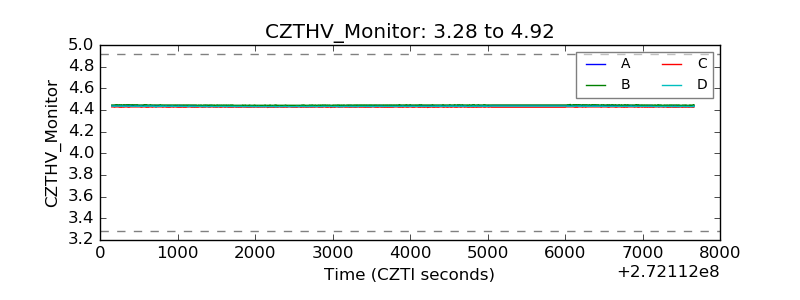 |
| D_VDD | 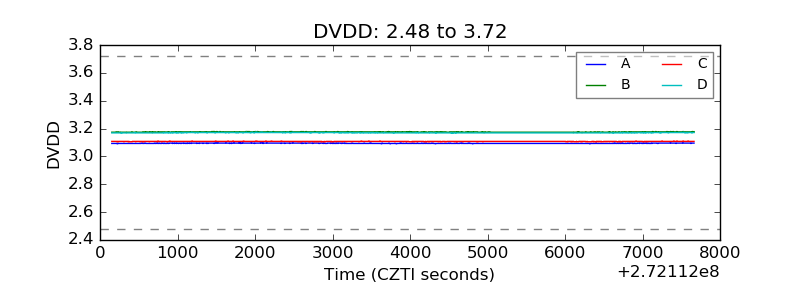 |
| Temperature 1 | 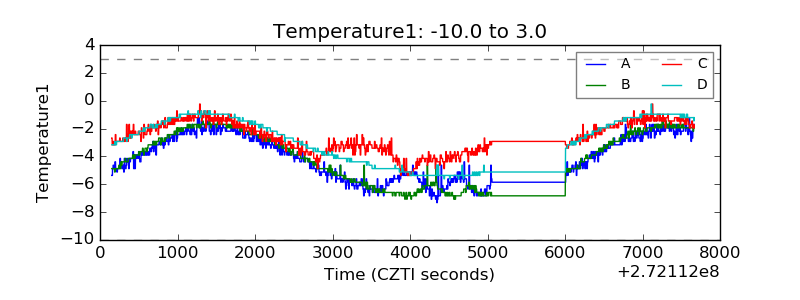 |
| Veto HV Monitor | 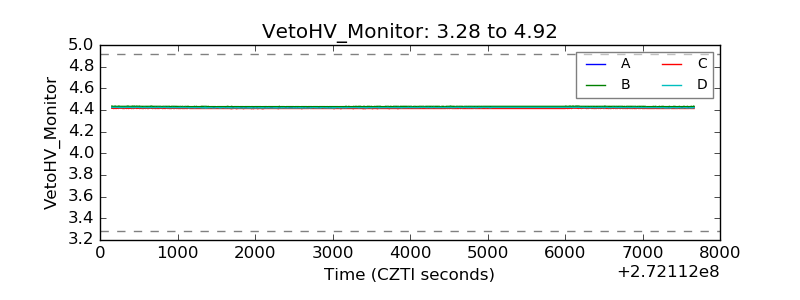 |
| Veto LLD | 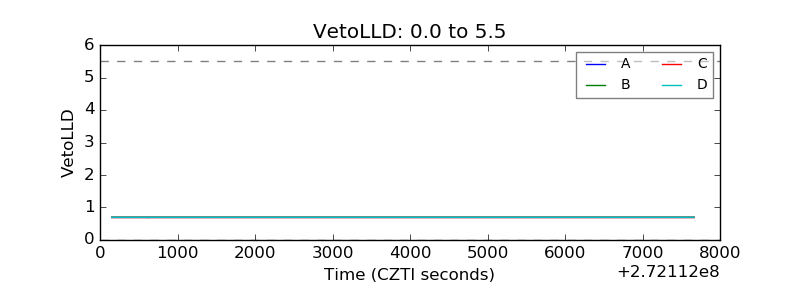 |
| Alpha Counter | 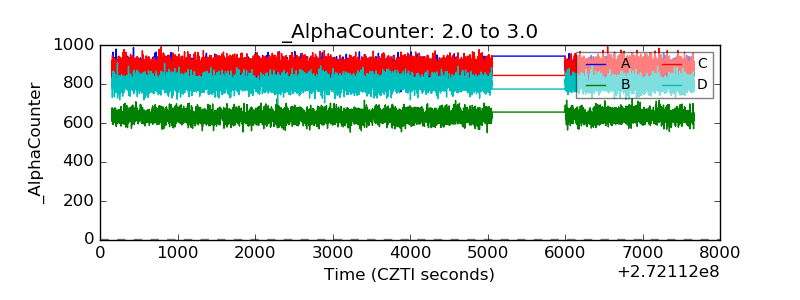 |
| _CPM_Rate | 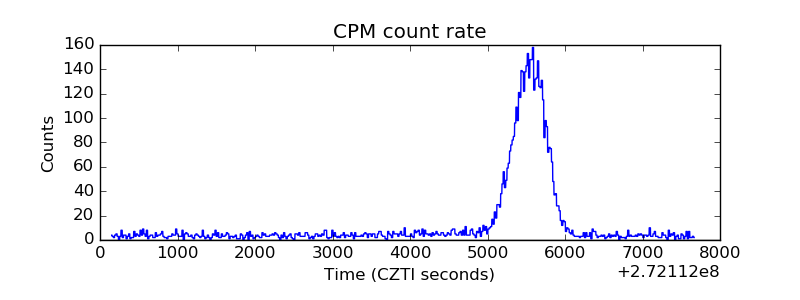 |
| CZT Counter | 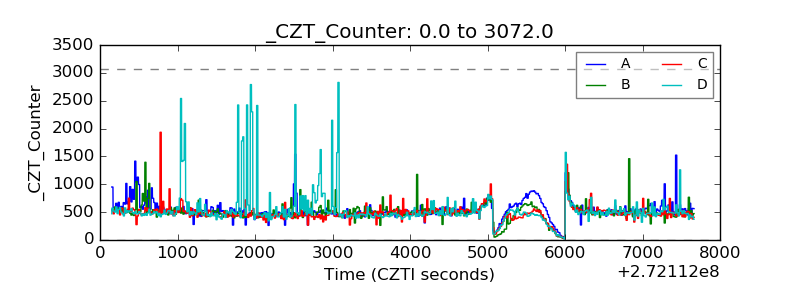 |
| +2.5 Volts monitor |  |
| +5 Volts monitor |  |
| _ROLL_ROT |  |
| _Roll_DEC | 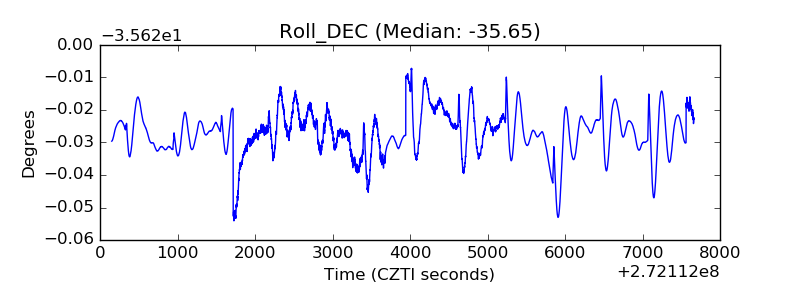 |
| _Roll_RA | 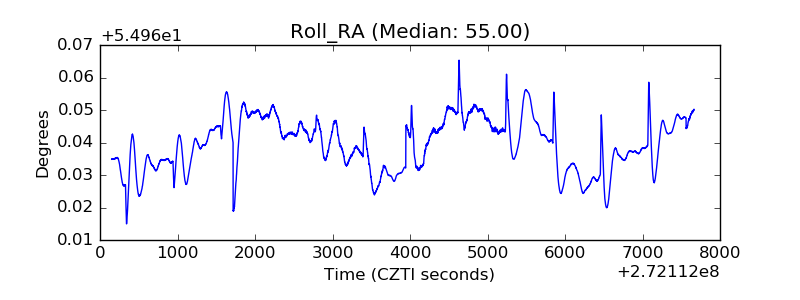 |
| Veto Counter |  |