| Param | Original file | Final file |
|---|---|---|
| Filename | modeM0/AS1A04_037T02_9000002310_15592cztM0_level2.evt | modeM0/AS1A04_037T02_9000002310_15592cztM0_level2_quad_clean.evt |
| Size (bytes) | 495,743,040 | 74,208,960 |
| Size | 472.8 MB | 70.8 MB |
| Events in quadrant A | 3,796,545 | 443,727 |
| Events in quadrant B | 3,463,658 | 453,217 |
| Events in quadrant C | 3,400,443 | 434,608 |
| Events in quadrant D | 3,877,072 | 427,469 |
| Mode SS | |||
|---|---|---|---|
| Quadrant | BADHDUFLAG | Total packets | Discarded packets |
| A | 0 | 142 | 0 |
| B | 0 | 142 | 0 |
| C | 0 | 142 | 0 |
| D | 0 | 142 | 0 |
| Mode M0 | |||
|---|---|---|---|
| Quadrant | BADHDUFLAG | Total packets | Discarded packets |
| A | 0 | 15572 | 3 |
| B | 0 | 14643 | 2 |
| C | 0 | 14479 | 2 |
| D | 0 | 16101 | 2 |
| Mode M9 | |||
|---|---|---|---|
| Quadrant | BADHDUFLAG | Total packets | Discarded packets |
| A | 0 | 5 | 0 |
| B | 0 | 5 | 0 |
| C | 0 | 5 | 0 |
| D | 0 | 5 | 0 |
| Quadrant | Total seconds | Saturated seconds | Saturation percentage |
|---|---|---|---|
| A | 7005 | 125 | 1.784440% |
| B | 7005 | 135 | 1.927195% |
| C | 7005 | 116 | 1.655960% |
| D | 7005 | 184 | 2.626695% |
Noise dominated data is calculated using 1-second bins in cleaned event files. If a bin has >2000 counts, and if more than 50% of those come from <1% of pixels, then it is considered to be noise-dominated and hence unusable.
| Quadrant | # 1 sec bins | Bins with >0 counts | Bins with >2000 counts | High rate bins dominated by noise | Noise dominated (total time) | Noise dominated (detector-on time) | Marked lightcurve |
|---|---|---|---|---|---|---|---|
| A | 7541 | 7006 | 7 | 7 | 0.09% | 0.10% |  |
| B | 7541 | 7006 | 6 | 6 | 0.08% | 0.09% |  |
| C | 7541 | 7006 | 0 | 0 | 0.00% | 0.00% |  |
| D | 7541 | 7006 | 74 | 74 | 0.98% | 1.06% |  |
Top three noisy pixels from each quadrant. If the there are fewer than three noisy pixels in the level2.evt file, extra rows are filled as -1
| Pixel properties | Quadrant properties | ||||||
|---|---|---|---|---|---|---|---|
| Quadrant | DetID | PixID | Counts | Sigma | Mean | Median | Sigma |
| A | 0 | 253 | 443592 | 2507.62 | 864 | 844 | 176.6 |
| A | 13 | 248 | 11800 | 62.05 | 864 | 844 | 176.6 |
| A | 15 | 239 | 7867 | 39.78 | 864 | 844 | 176.6 |
| B | 0 | 189 | 42610 | 252.07 | 858 | 835 | 165.7 |
| B | 12 | 111 | 18927 | 109.17 | 858 | 835 | 165.7 |
| B | 11 | 111 | 16608 | 95.18 | 858 | 835 | 165.7 |
| C | 14 | 238 | 127056 | 652.52 | 827 | 832 | 193.4 |
| C | 3 | 233 | 45981 | 233.4 | 827 | 832 | 193.4 |
| C | 13 | 61 | 5838 | 25.88 | 827 | 832 | 193.4 |
| D | 4 | 95 | 238801 | 1162.34 | 841 | 818 | 204.7 |
| D | 5 | 51 | 209782 | 1020.61 | 841 | 818 | 204.7 |
| D | 12 | 222 | 48630 | 233.52 | 841 | 818 | 204.7 |
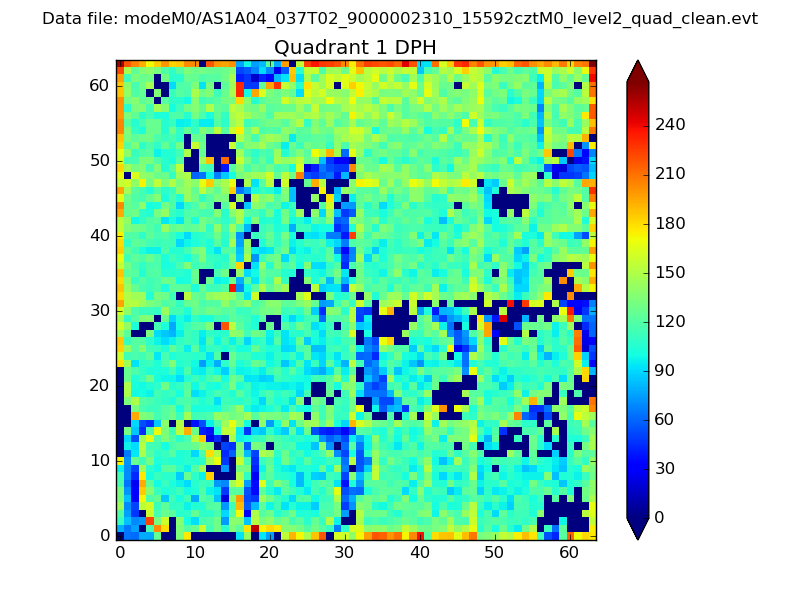
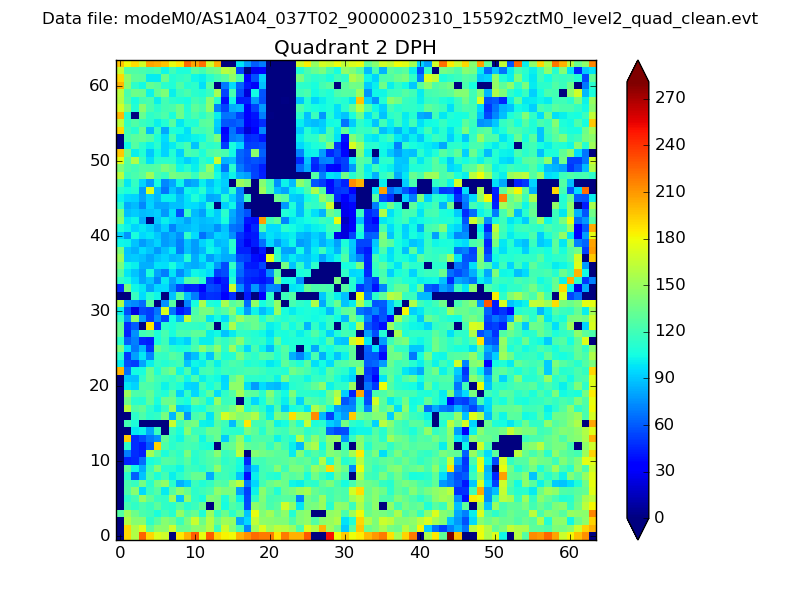
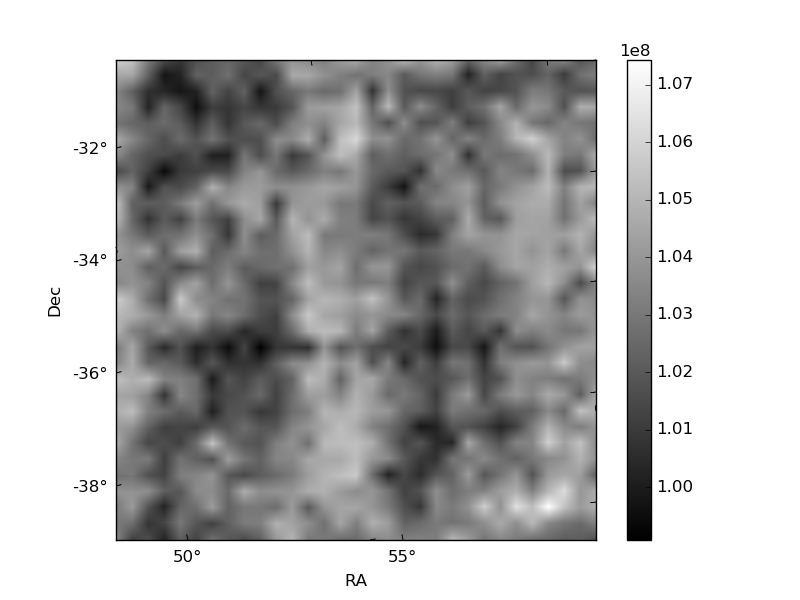
Histogram calculated using DETX and DETY for each event in the final _common_clean file
| Quadrant A | 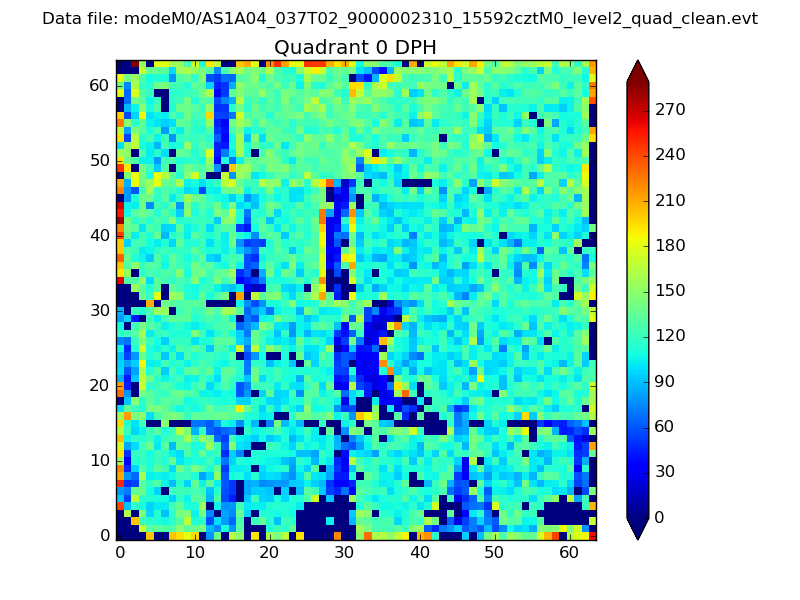 |
 |
Quadrant B |
|---|---|---|---|
| Quadrant D | 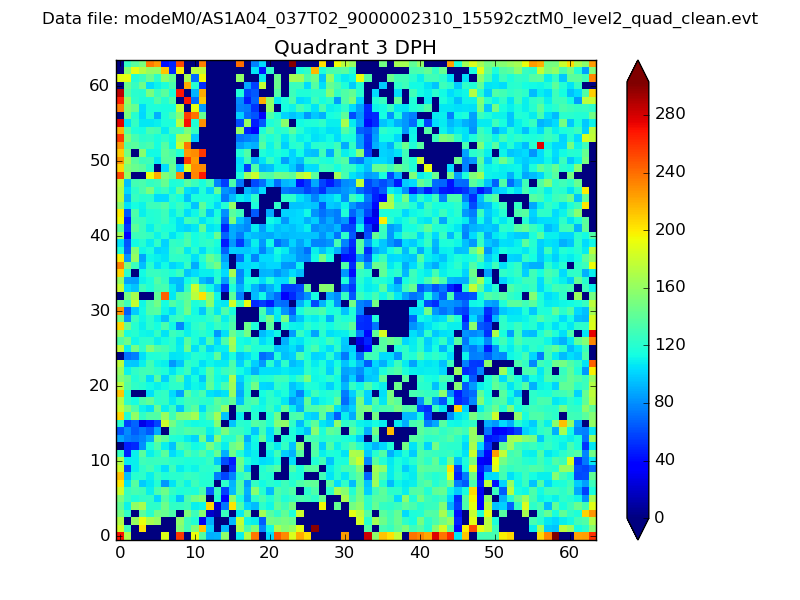 |
 |
Quadrant C |
| Plot type | Count rate plots | Images |
|---|---|---|
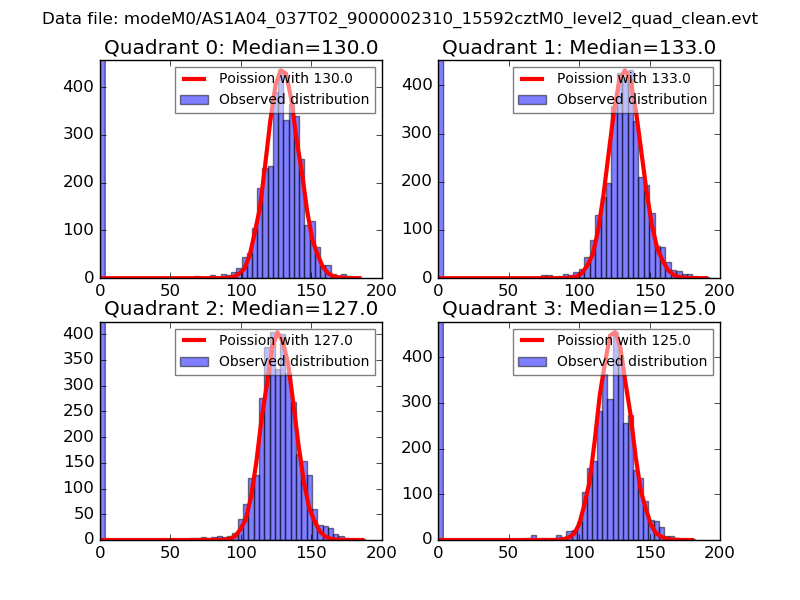
| Comparison with Poisson distribution Blue bars denote a histogram of data divided into 1 sec bins. Red curve is a Poisson curve with rate = median count rate of data. |
 |
 |
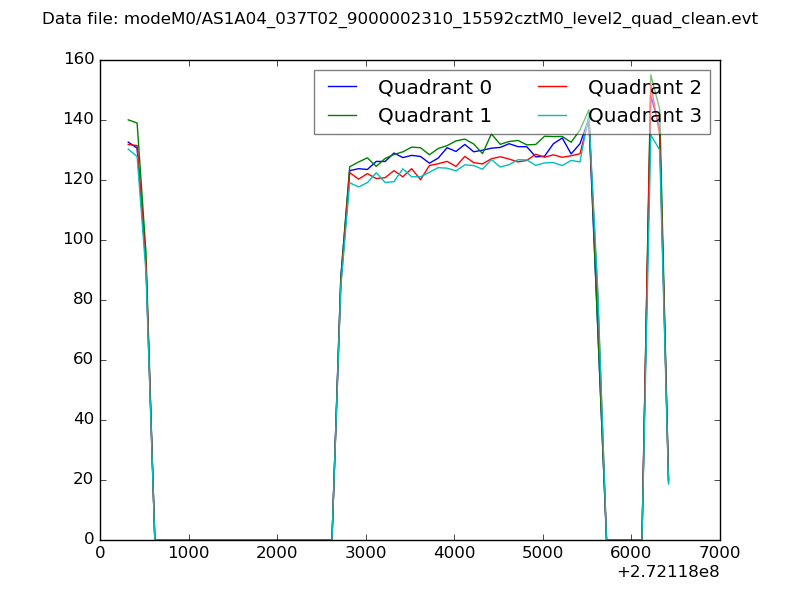
| Quadrant-wise count rates Data is divided into 100 sec bins |
 |
|
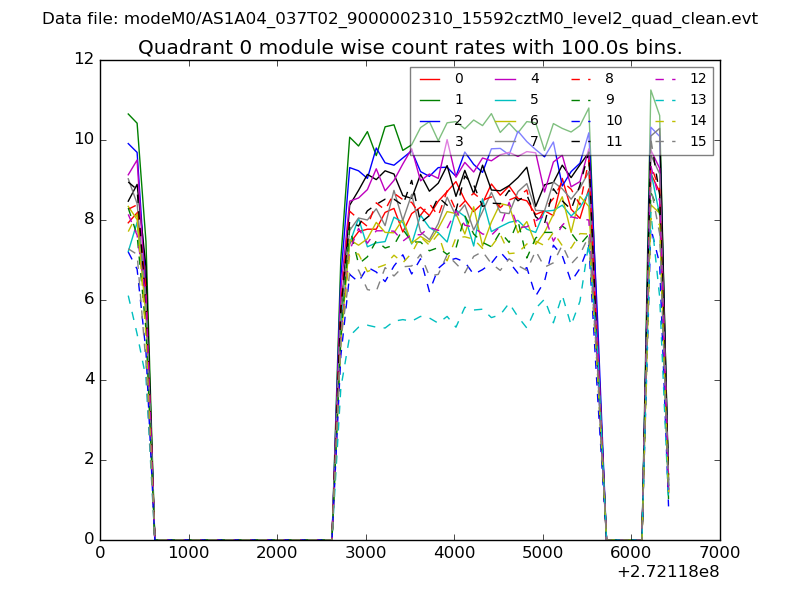
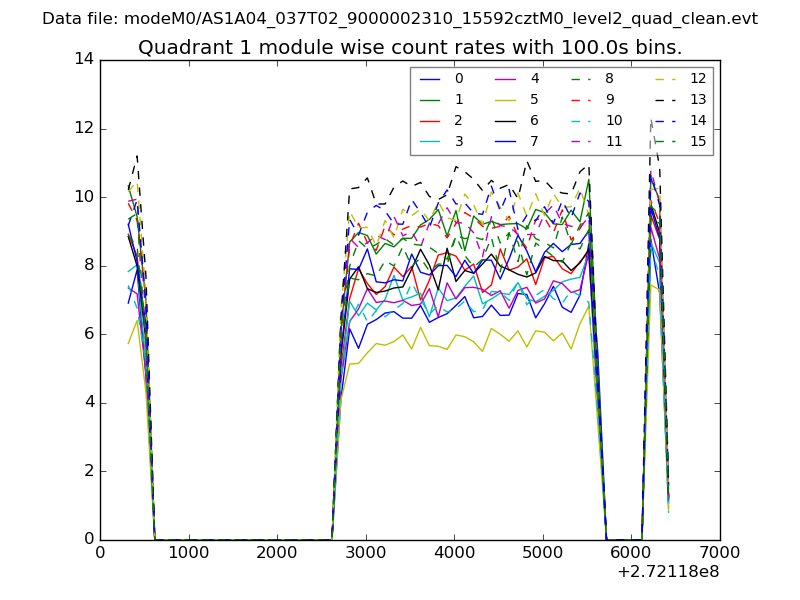
| Module-wise count rates for Quadrant A Data is divided into 100 sec bins |
 |
 |
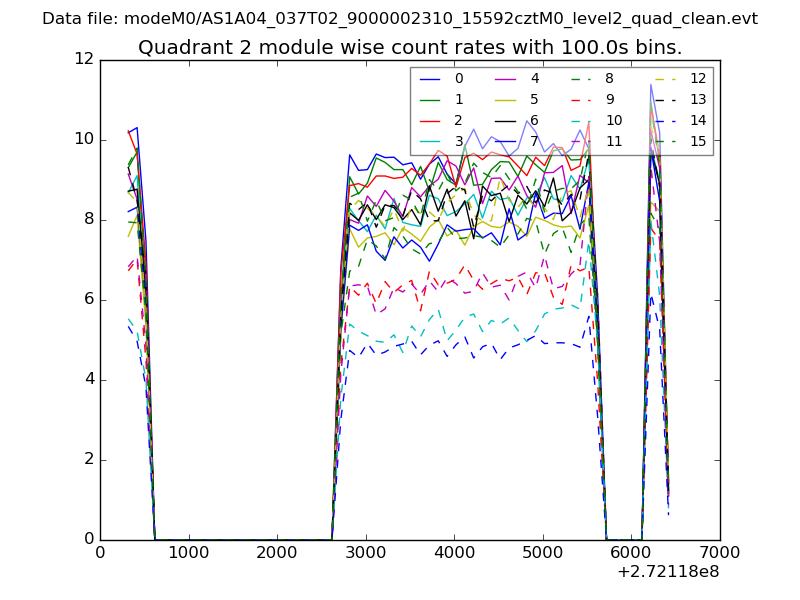
| Module-wise count rates for Quadrant B Data is divided into 100 sec bins |
 |
 |
| Module-wise count rates for Quadrant C Data is divided into 100 sec bins |
 |
 |
| Module-wise count rates for Quadrant D Data is divided into 100 sec bins |
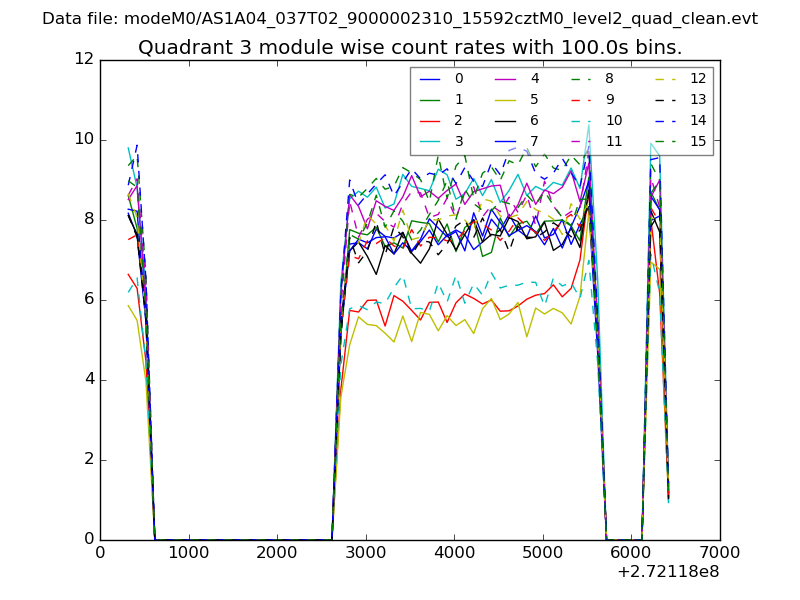 |
 |
| Parameter | Plot |
|---|---|
| CZT HV Monitor | 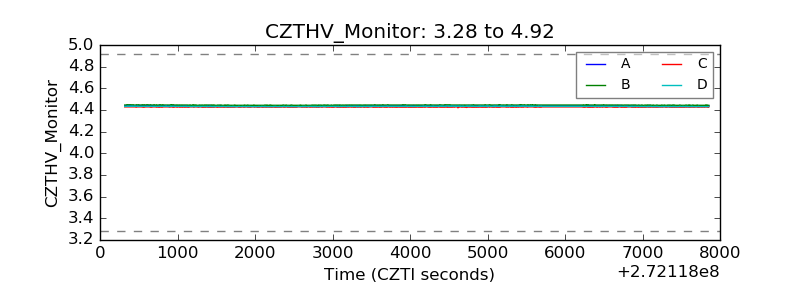 |
| D_VDD | 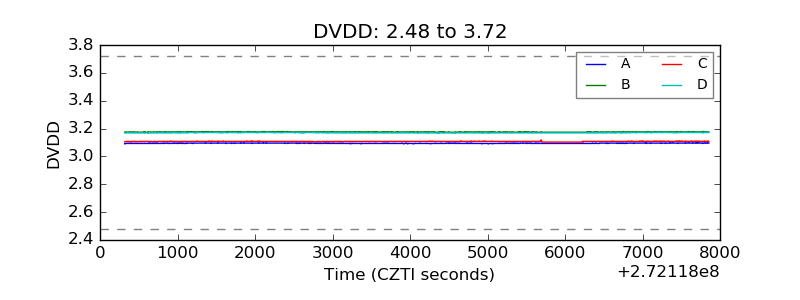 |
| Temperature 1 | 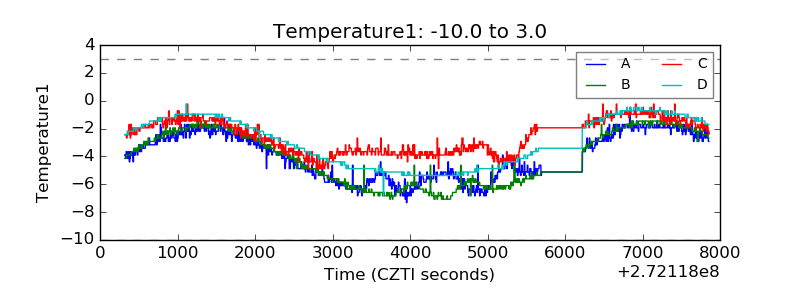 |
| Veto HV Monitor | 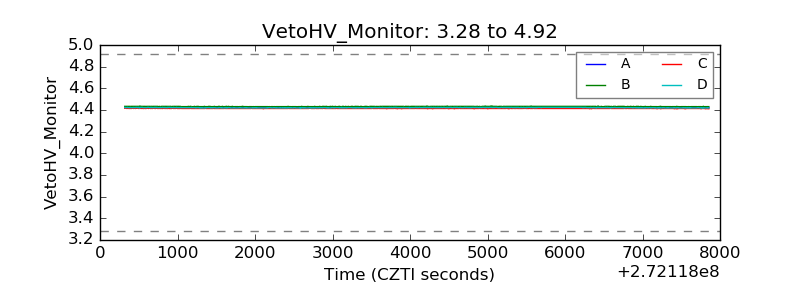 |
| Veto LLD | 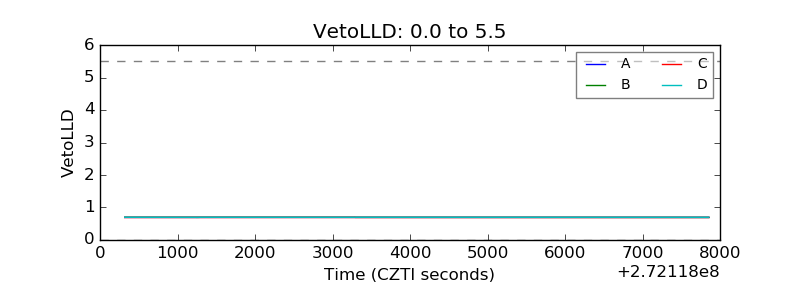 |
| Alpha Counter | 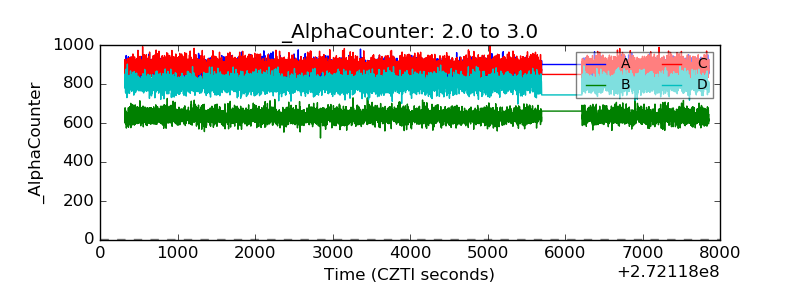 |
| _CPM_Rate | 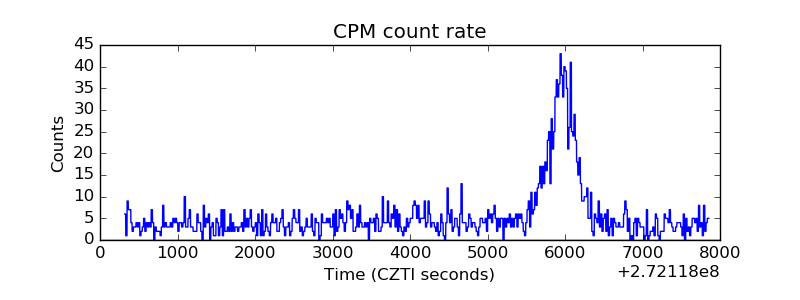 |
| CZT Counter | 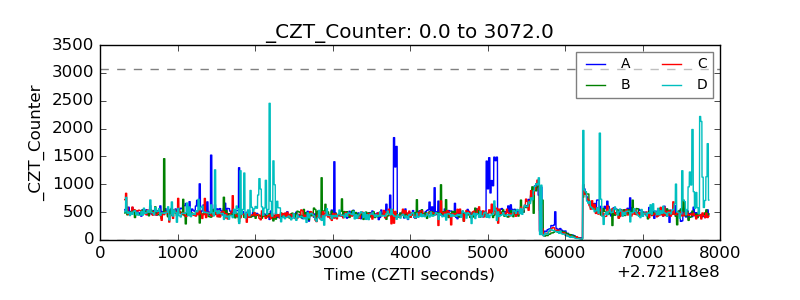 |
| +2.5 Volts monitor |  |
| +5 Volts monitor |  |
| _ROLL_ROT | 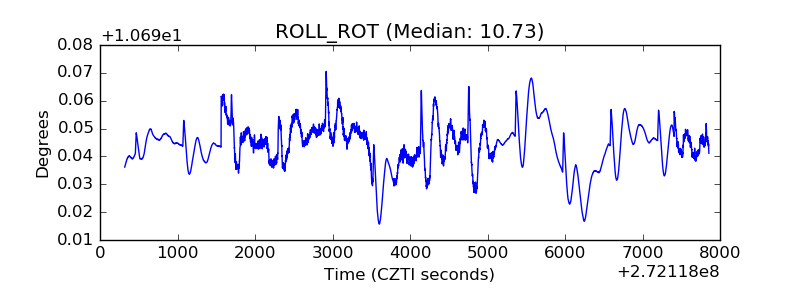 |
| _Roll_DEC | 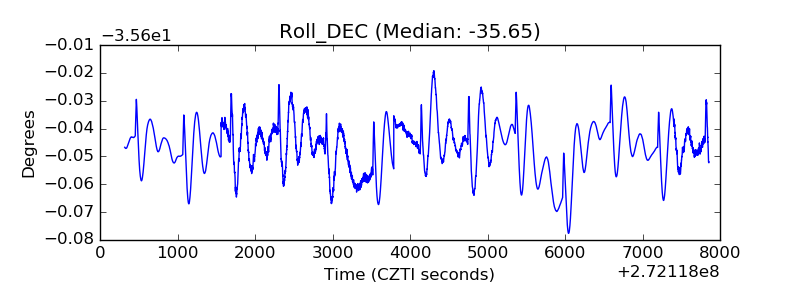 |
| _Roll_RA | 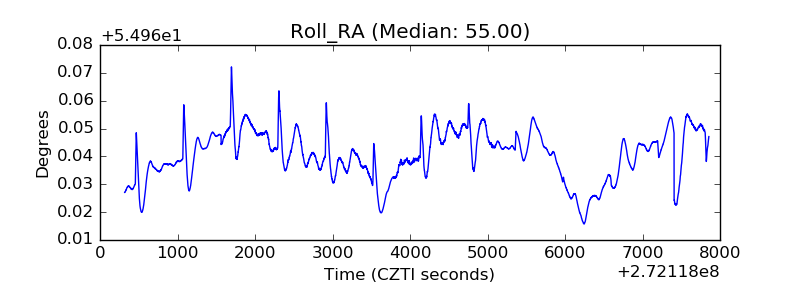 |
| Veto Counter | 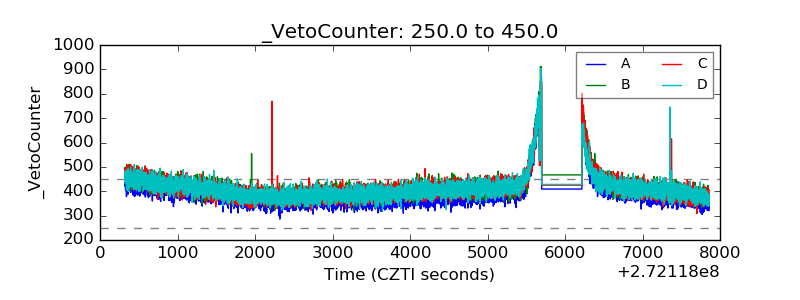 |