| Param | Original file | Final file |
|---|---|---|
| Filename | modeM0/AS1A04_037T02_9000002310_15593cztM0_level2.evt | modeM0/AS1A04_037T02_9000002310_15593cztM0_level2_quad_clean.evt |
| Size (bytes) | 514,670,400 | 76,596,480 |
| Size | 490.8 MB | 73.0 MB |
| Events in quadrant A | 3,708,264 | 459,943 |
| Events in quadrant B | 3,623,195 | 467,172 |
| Events in quadrant C | 3,539,242 | 445,368 |
| Events in quadrant D | 4,222,598 | 440,764 |
| Mode SS | |||
|---|---|---|---|
| Quadrant | BADHDUFLAG | Total packets | Discarded packets |
| A | 0 | 148 | 0 |
| B | 0 | 148 | 0 |
| C | 0 | 148 | 0 |
| D | 0 | 148 | 0 |
| Mode M0 | |||
|---|---|---|---|
| Quadrant | BADHDUFLAG | Total packets | Discarded packets |
| A | 0 | 15688 | 2 |
| B | 0 | 15313 | 1 |
| C | 0 | 15143 | 1 |
| D | 0 | 17314 | 1 |
| Mode M9 | |||
|---|---|---|---|
| Quadrant | BADHDUFLAG | Total packets | Discarded packets |
| A | 0 | 2 | 0 |
| B | 0 | 2 | 0 |
| C | 0 | 2 | 0 |
| D | 0 | 2 | 0 |
| Quadrant | Total seconds | Saturated seconds | Saturation percentage |
|---|---|---|---|
| A | 7264 | 186 | 2.560573% |
| B | 7264 | 160 | 2.202643% |
| C | 7264 | 150 | 2.064978% |
| D | 7264 | 197 | 2.712004% |
Noise dominated data is calculated using 1-second bins in cleaned event files. If a bin has >2000 counts, and if more than 50% of those come from <1% of pixels, then it is considered to be noise-dominated and hence unusable.
| Quadrant | # 1 sec bins | Bins with >0 counts | Bins with >2000 counts | High rate bins dominated by noise | Noise dominated (total time) | Noise dominated (detector-on time) | Marked lightcurve |
|---|---|---|---|---|---|---|---|
| A | 7470 | 7265 | 2 | 2 | 0.03% | 0.03% |  |
| B | 7470 | 7265 | 5 | 5 | 0.07% | 0.07% |  |
| C | 7470 | 7266 | 7 | 7 | 0.09% | 0.10% |  |
| D | 7470 | 7266 | 113 | 113 | 1.51% | 1.56% |  |
Top three noisy pixels from each quadrant. If the there are fewer than three noisy pixels in the level2.evt file, extra rows are filled as -1
| Pixel properties | Quadrant properties | ||||||
|---|---|---|---|---|---|---|---|
| Quadrant | DetID | PixID | Counts | Sigma | Mean | Median | Sigma |
| A | 0 | 253 | 249558 | 1375.48 | 891 | 870 | 180.8 |
| A | 13 | 248 | 15280 | 79.7 | 891 | 870 | 180.8 |
| A | 9 | 143 | 9013 | 45.04 | 891 | 870 | 180.8 |
| B | 0 | 189 | 33387 | 189.62 | 890 | 867 | 171.5 |
| B | 4 | 216 | 32997 | 187.34 | 890 | 867 | 171.5 |
| B | 12 | 111 | 19954 | 111.29 | 890 | 867 | 171.5 |
| C | 14 | 238 | 130767 | 644.18 | 854 | 857 | 201.7 |
| C | 3 | 233 | 46742 | 227.53 | 854 | 857 | 201.7 |
| C | 10 | 187 | 29710 | 143.07 | 854 | 857 | 201.7 |
| D | 4 | 95 | 593052 | 2778.86 | 870 | 843 | 213.1 |
| D | 12 | 110 | 88588 | 411.73 | 870 | 843 | 213.1 |
| D | 14 | 128 | 49324 | 227.49 | 870 | 843 | 213.1 |
Histogram calculated using DETX and DETY for each event in the final _common_clean file
| Quadrant A |  |
 |
Quadrant B |
|---|---|---|---|
| Quadrant D |  |
 |
Quadrant C |
| Plot type | Count rate plots | Images |
|---|---|---|
| Comparison with Poisson distribution Blue bars denote a histogram of data divided into 1 sec bins. Red curve is a Poisson curve with rate = median count rate of data. |
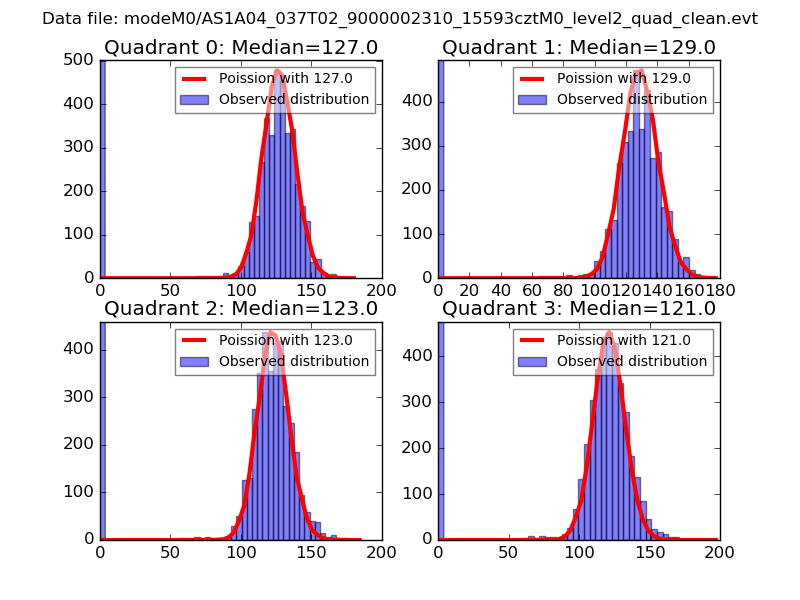 |
 |
| Quadrant-wise count rates Data is divided into 100 sec bins |
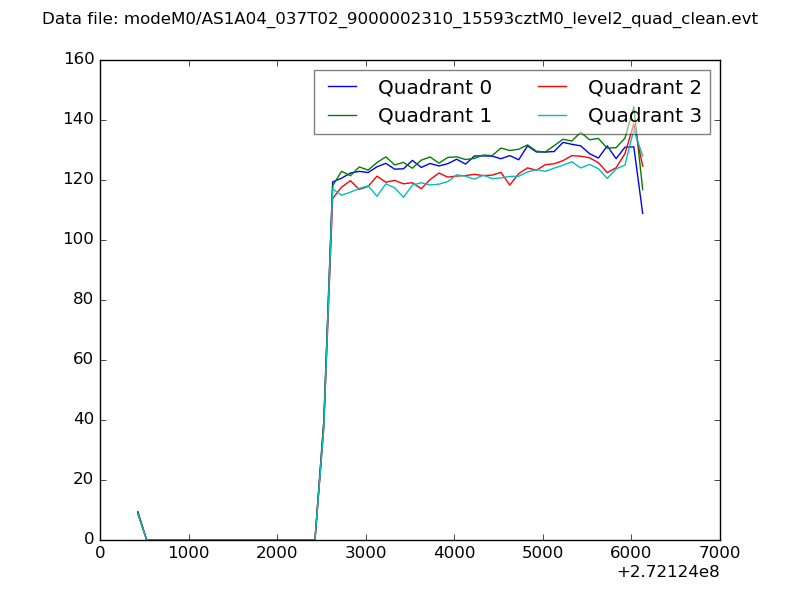 |
|
| Module-wise count rates for Quadrant A Data is divided into 100 sec bins |
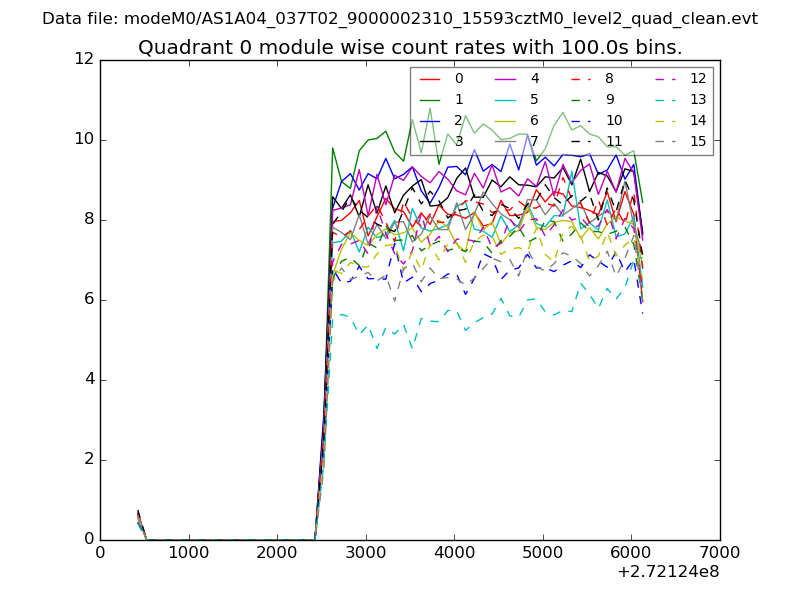 |
 |
| Module-wise count rates for Quadrant B Data is divided into 100 sec bins |
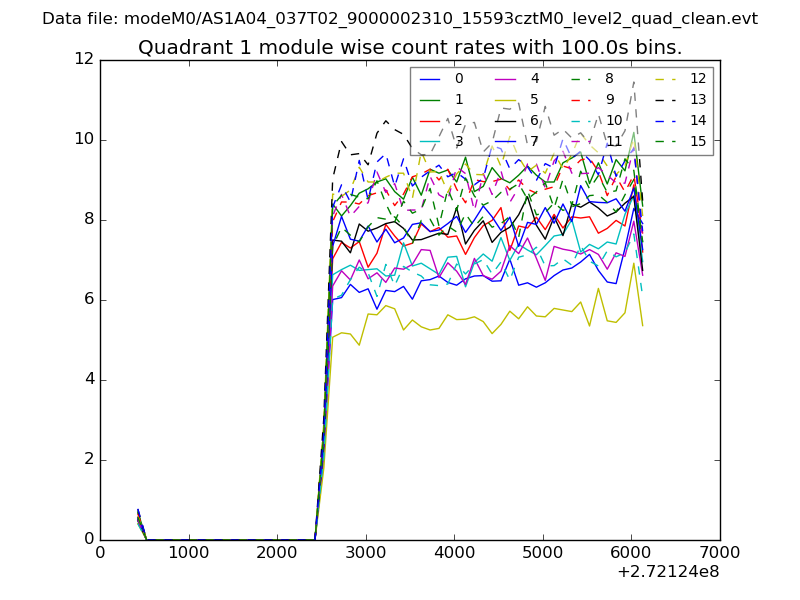 |
 |
| Module-wise count rates for Quadrant C Data is divided into 100 sec bins |
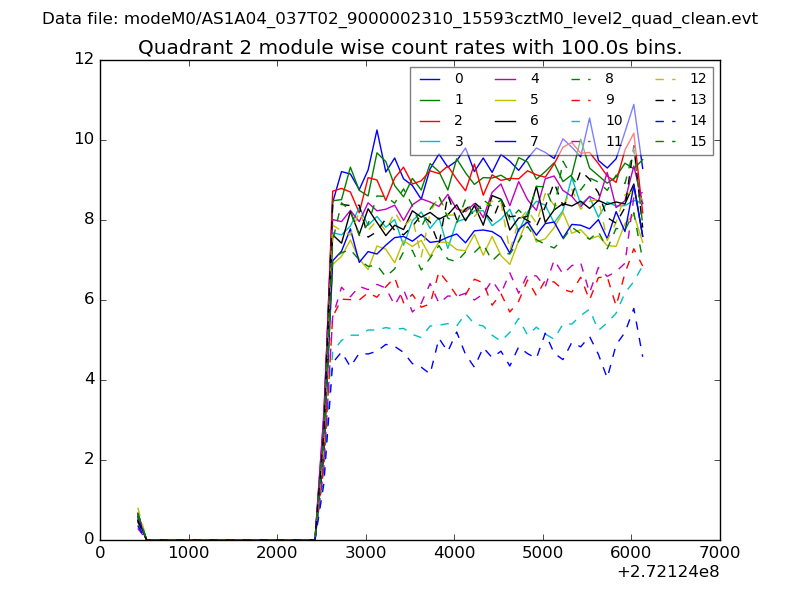 |
 |
| Module-wise count rates for Quadrant D Data is divided into 100 sec bins |
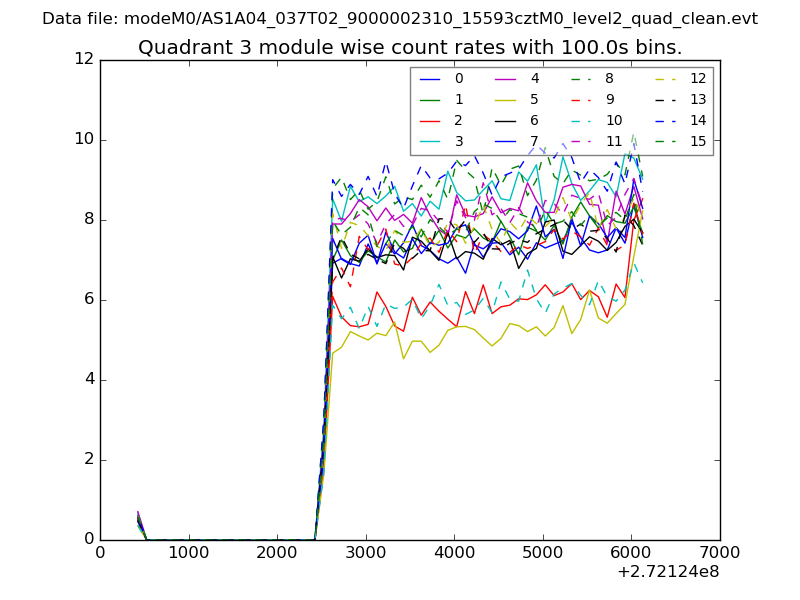 |
 |
| Parameter | Plot |
|---|---|
| CZT HV Monitor | 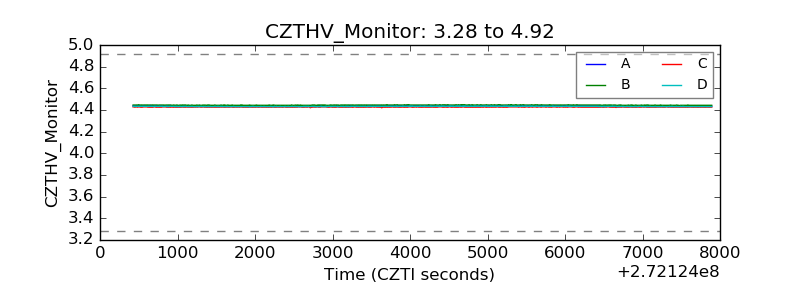 |
| D_VDD |  |
| Temperature 1 |  |
| Veto HV Monitor |  |
| Veto LLD |  |
| Alpha Counter | 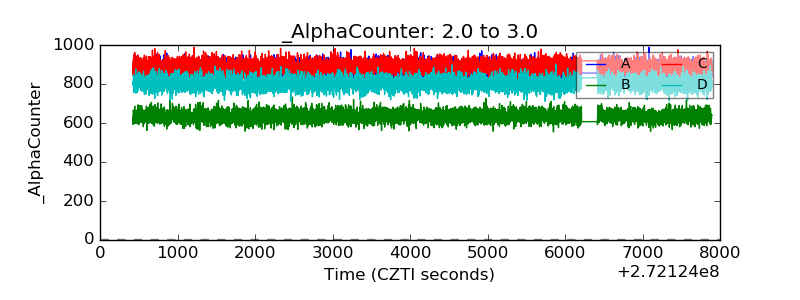 |
| _CPM_Rate | 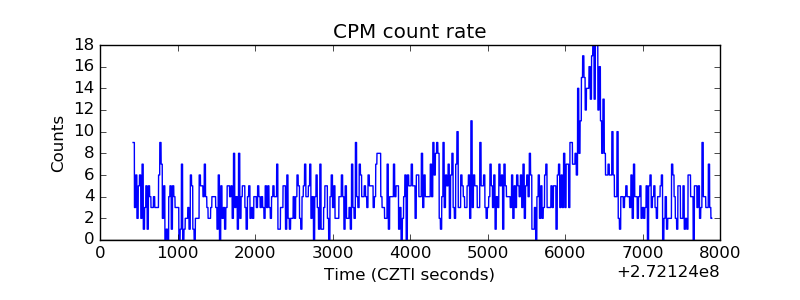 |
| CZT Counter |  |
| +2.5 Volts monitor |  |
| +5 Volts monitor |  |
| _ROLL_ROT | 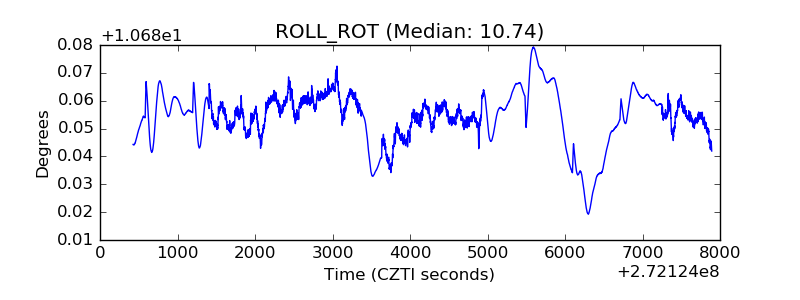 |
| _Roll_DEC | 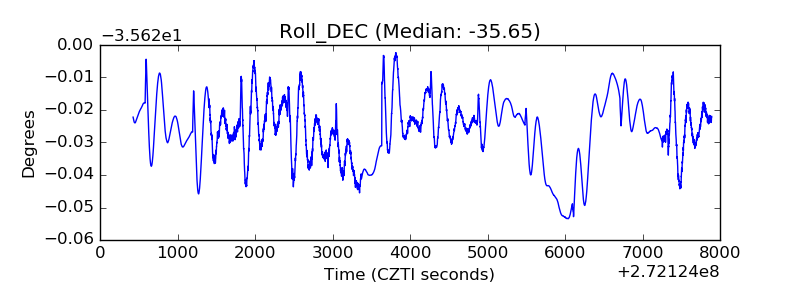 |
| _Roll_RA |  |
| Veto Counter | 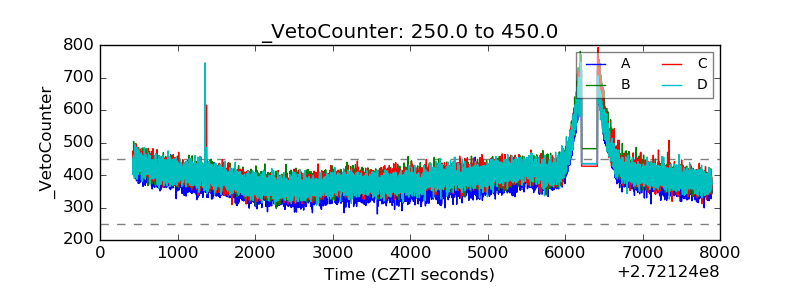 |