| Param | Original file | Final file |
|---|---|---|
| Filename | modeM0/AS1A04_037T02_9000002310_15594cztM0_level2.evt | modeM0/AS1A04_037T02_9000002310_15594cztM0_level2_quad_clean.evt |
| Size (bytes) | 522,567,360 | 76,682,880 |
| Size | 498.4 MB | 73.1 MB |
| Events in quadrant A | 3,929,369 | 457,732 |
| Events in quadrant B | 3,678,179 | 462,543 |
| Events in quadrant C | 3,740,577 | 444,138 |
| Events in quadrant D | 3,970,401 | 437,576 |
| Mode SS | |||
|---|---|---|---|
| Quadrant | BADHDUFLAG | Total packets | Discarded packets |
| A | 0 | 152 | 0 |
| B | 0 | 152 | 0 |
| C | 0 | 152 | 0 |
| D | 0 | 152 | 0 |
| Mode M0 | |||
|---|---|---|---|
| Quadrant | BADHDUFLAG | Total packets | Discarded packets |
| A | 0 | 16585 | 2 |
| B | 0 | 15676 | 1 |
| C | 0 | 15722 | 1 |
| D | 0 | 16815 | 1 |
| Mode M9 | |||
|---|---|---|---|
| Quadrant | BADHDUFLAG | Total packets | Discarded packets |
| A | 0 | 2 | 0 |
| B | 0 | 2 | 0 |
| C | 0 | 2 | 0 |
| D | 0 | 2 | 0 |
| Quadrant | Total seconds | Saturated seconds | Saturation percentage |
|---|---|---|---|
| A | 7470 | 121 | 1.619813% |
| B | 7470 | 132 | 1.767068% |
| C | 7470 | 147 | 1.967871% |
| D | 7470 | 140 | 1.874163% |
Noise dominated data is calculated using 1-second bins in cleaned event files. If a bin has >2000 counts, and if more than 50% of those come from <1% of pixels, then it is considered to be noise-dominated and hence unusable.
| Quadrant | # 1 sec bins | Bins with >0 counts | Bins with >2000 counts | High rate bins dominated by noise | Noise dominated (total time) | Noise dominated (detector-on time) | Marked lightcurve |
|---|---|---|---|---|---|---|---|
| A | 7716 | 7471 | 2 | 2 | 0.03% | 0.03% | 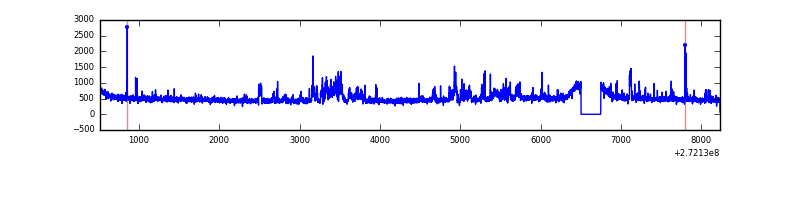 |
| B | 7716 | 7471 | 1 | 1 | 0.01% | 0.01% | 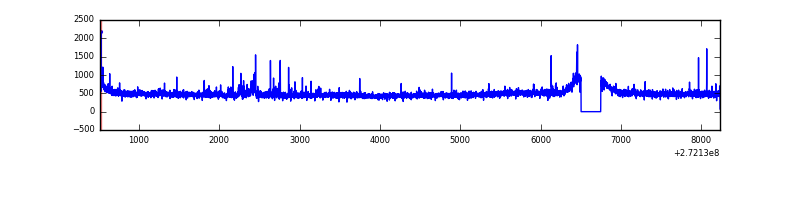 |
| C | 7716 | 7471 | 0 | 0 | 0.00% | 0.00% | 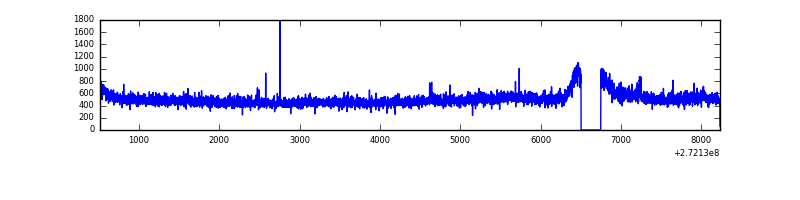 |
| D | 7716 | 7472 | 66 | 66 | 0.86% | 0.88% | 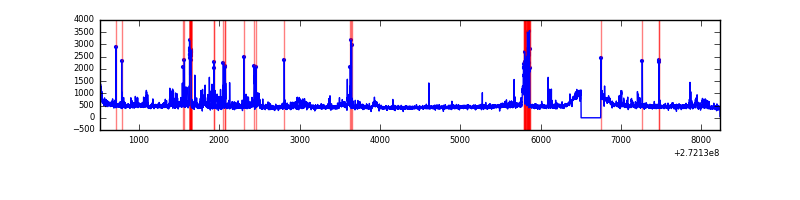 |
Top three noisy pixels from each quadrant. If the there are fewer than three noisy pixels in the level2.evt file, extra rows are filled as -1
| Pixel properties | Quadrant properties | ||||||
|---|---|---|---|---|---|---|---|
| Quadrant | DetID | PixID | Counts | Sigma | Mean | Median | Sigma |
| A | 0 | 253 | 372360 | 1991.29 | 912 | 893 | 186.5 |
| A | 13 | 248 | 27365 | 141.91 | 912 | 893 | 186.5 |
| A | 9 | 143 | 16757 | 85.04 | 912 | 893 | 186.5 |
| B | 0 | 189 | 53581 | 301.77 | 908 | 885 | 174.6 |
| B | 12 | 111 | 19954 | 109.2 | 908 | 885 | 174.6 |
| B | 11 | 111 | 17468 | 94.96 | 908 | 885 | 174.6 |
| C | 3 | 233 | 205558 | 999.38 | 870 | 873 | 204.8 |
| C | 14 | 238 | 133863 | 649.33 | 870 | 873 | 204.8 |
| C | 10 | 22 | 6982 | 29.83 | 870 | 873 | 204.8 |
| D | 12 | 110 | 288611 | 1324.85 | 887 | 860 | 217.2 |
| D | 15 | 0 | 113170 | 517.09 | 887 | 860 | 217.2 |
| D | 14 | 128 | 49546 | 224.16 | 887 | 860 | 217.2 |
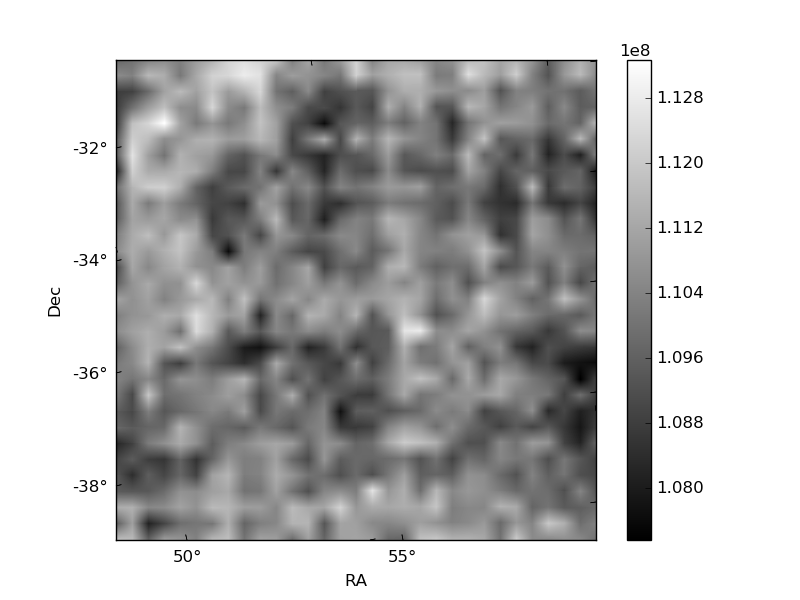
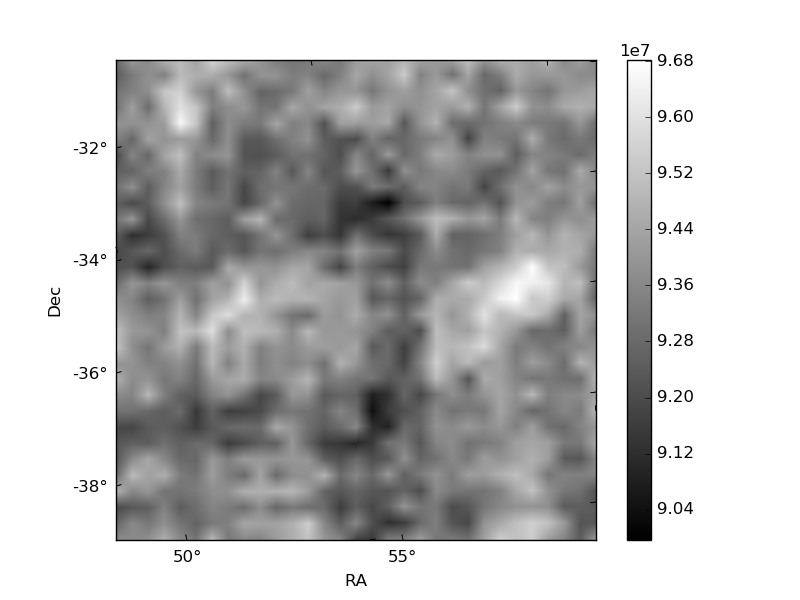
Histogram calculated using DETX and DETY for each event in the final _common_clean file
| Quadrant A |  |
 |
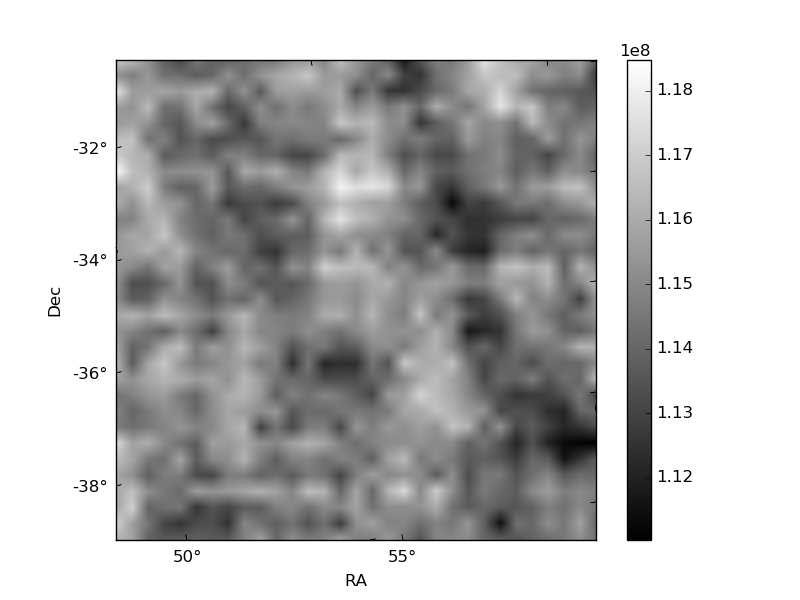
Quadrant B |
|---|---|---|---|
| Quadrant D |  |
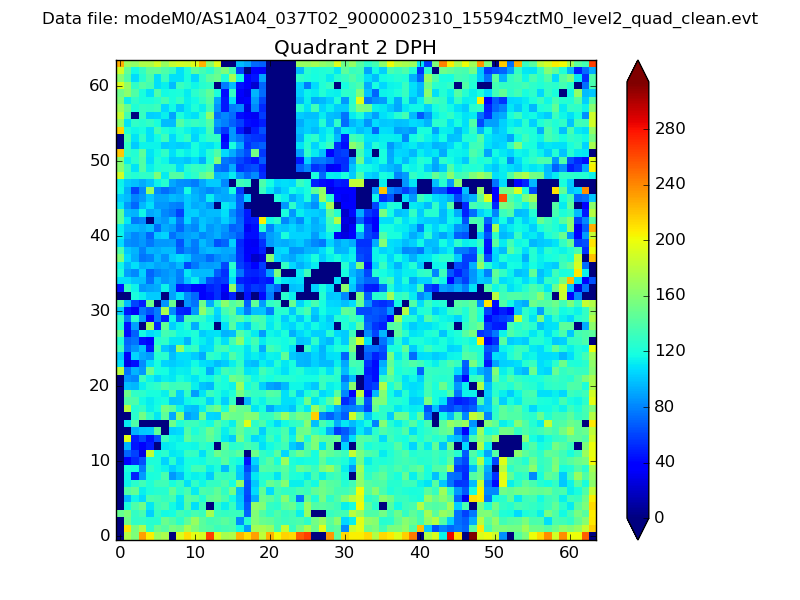 |
Quadrant C |
| Plot type | Count rate plots | Images |
|---|---|---|
| Comparison with Poisson distribution Blue bars denote a histogram of data divided into 1 sec bins. Red curve is a Poisson curve with rate = median count rate of data. |
 |
 |
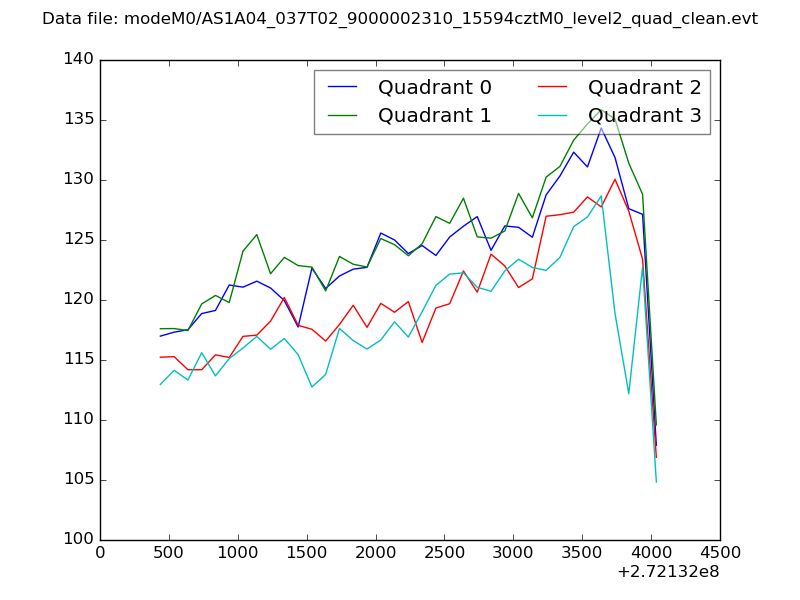
| Quadrant-wise count rates Data is divided into 100 sec bins |
 |
|
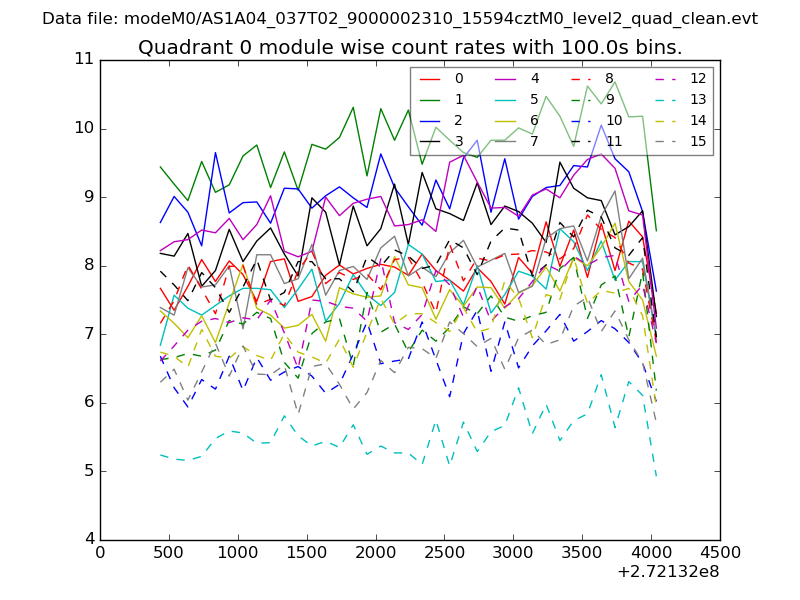
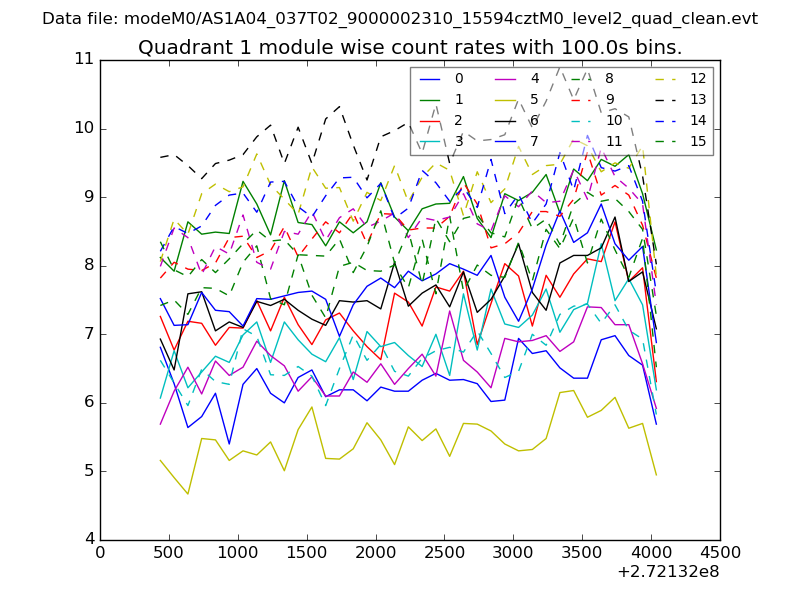
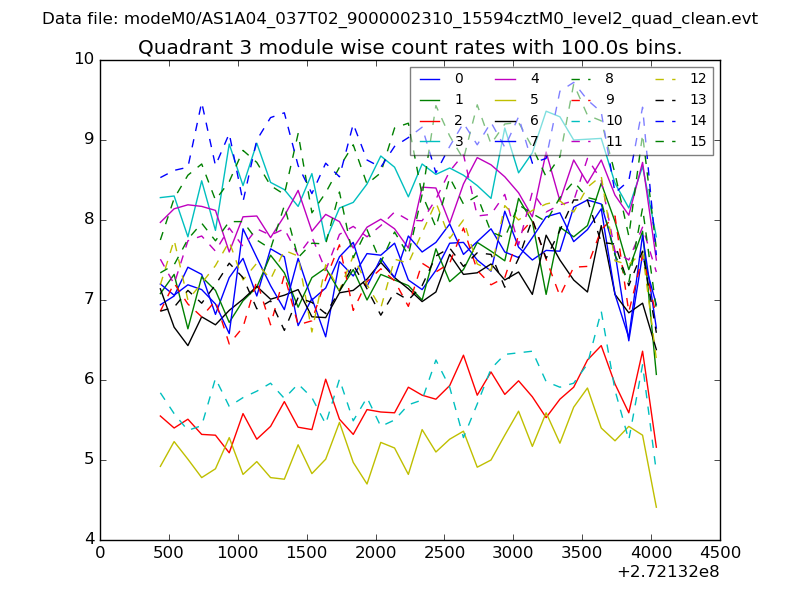
| Module-wise count rates for Quadrant A Data is divided into 100 sec bins |
 |
 |
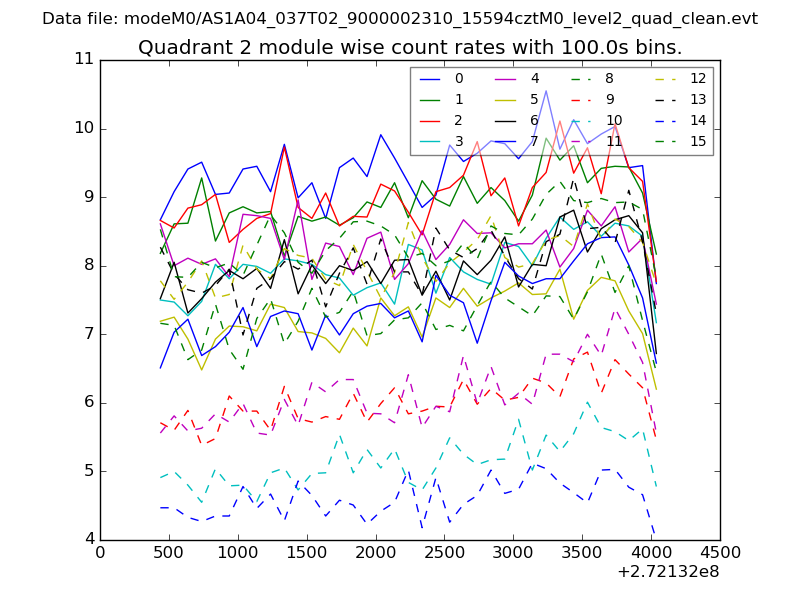
| Module-wise count rates for Quadrant B Data is divided into 100 sec bins |
 |
 |
| Module-wise count rates for Quadrant C Data is divided into 100 sec bins |
 |
 |
| Module-wise count rates for Quadrant D Data is divided into 100 sec bins |
 |
 |
| Parameter | Plot |
|---|---|
| CZT HV Monitor | 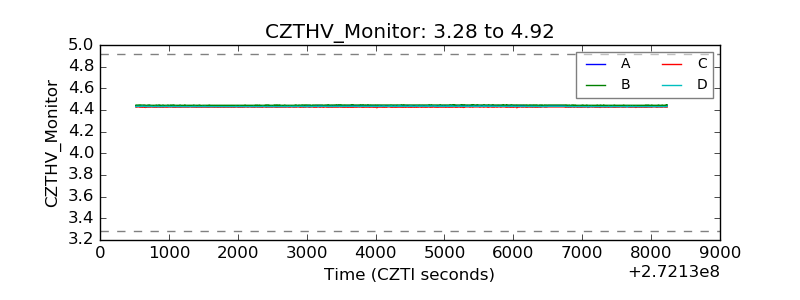 |
| D_VDD | 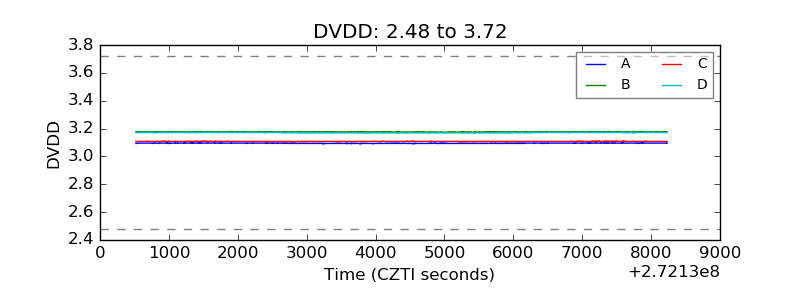 |
| Temperature 1 |  |
| Veto HV Monitor | 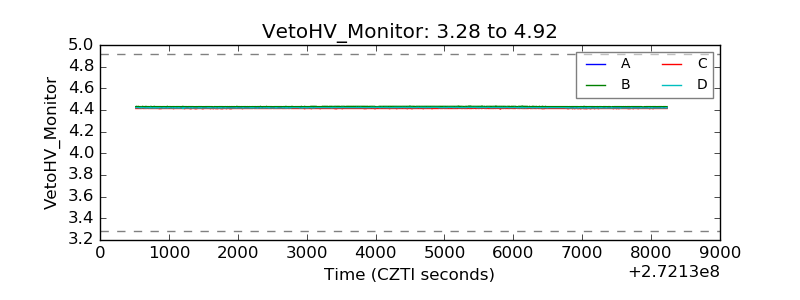 |
| Veto LLD | 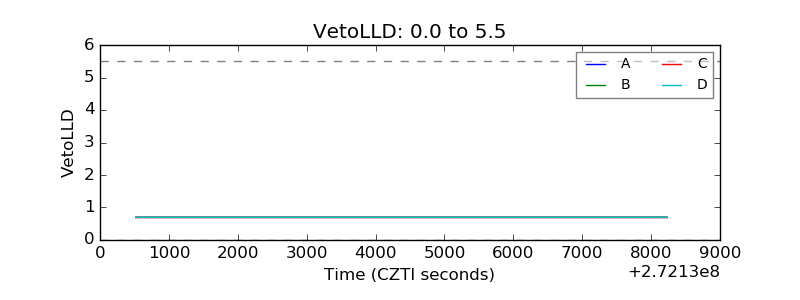 |
| Alpha Counter | 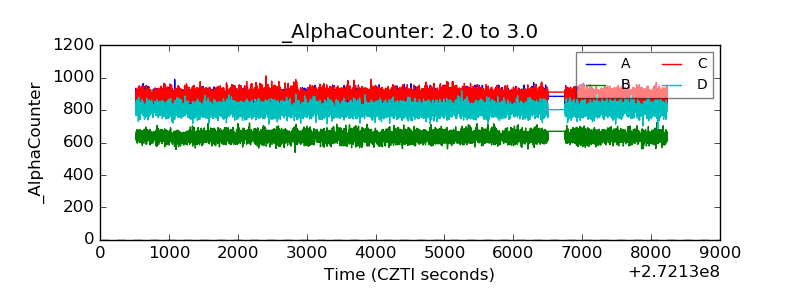 |
| _CPM_Rate | 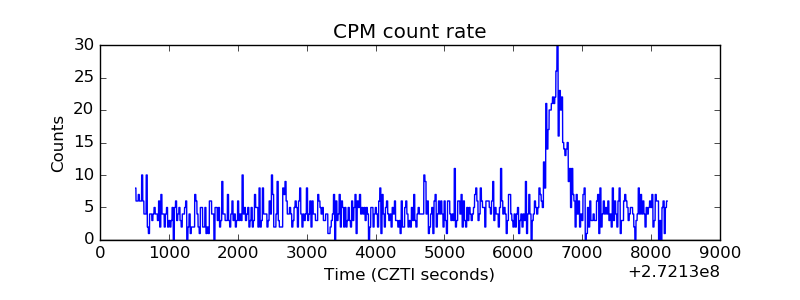 |
| CZT Counter | 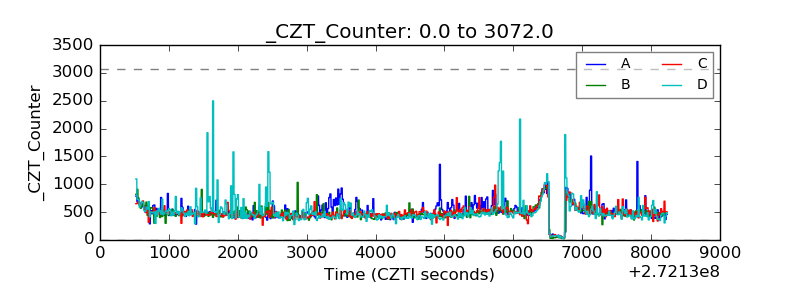 |
| +2.5 Volts monitor |  |
| +5 Volts monitor |  |
| _ROLL_ROT | 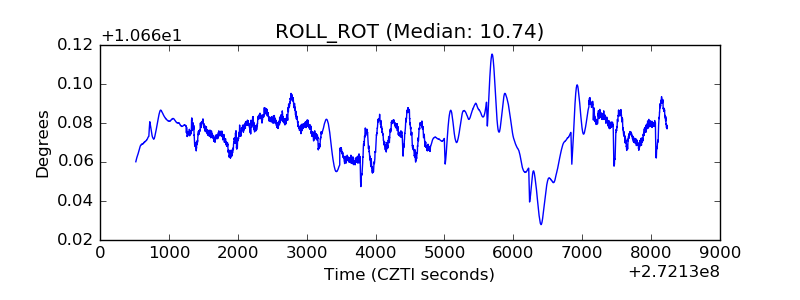 |
| _Roll_DEC | 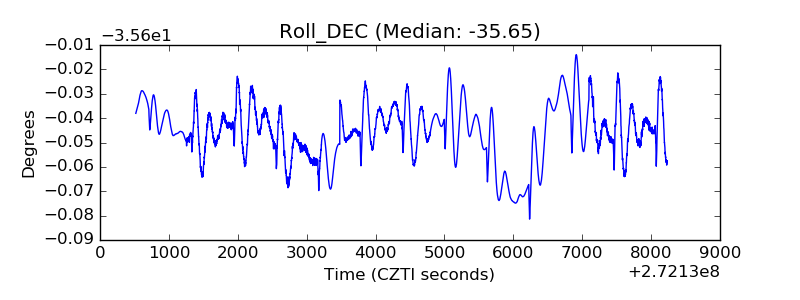 |
| _Roll_RA | 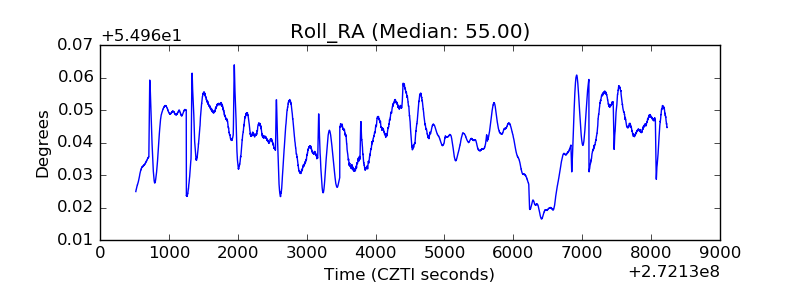 |
| Veto Counter | 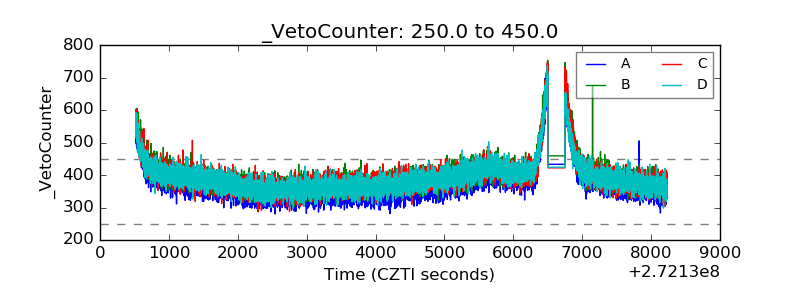 |