| Param | Original file | Final file |
|---|---|---|
| Filename | modeM0/AS1A04_037T02_9000002310_15597cztM0_level2.evt | modeM0/AS1A04_037T02_9000002310_15597cztM0_level2_quad_clean.evt |
| Size (bytes) | 178,980,480 | 24,549,120 |
| Size | 170.7 MB | 23.4 MB |
| Events in quadrant A | 1,348,480 | 140,463 |
| Events in quadrant B | 1,307,381 | 141,113 |
| Events in quadrant C | 1,330,683 | 135,752 |
| Events in quadrant D | 1,251,004 | 135,135 |
| Mode SS | |||
|---|---|---|---|
| Quadrant | BADHDUFLAG | Total packets | Discarded packets |
| A | 0 | 52 | 0 |
| B | 0 | 52 | 0 |
| C | 0 | 52 | 0 |
| D | 0 | 52 | 0 |
| Mode M0 | |||
|---|---|---|---|
| Quadrant | BADHDUFLAG | Total packets | Discarded packets |
| A | 0 | 5781 | 0 |
| B | 0 | 5589 | 0 |
| C | 0 | 5628 | 0 |
| D | 0 | 5579 | 0 |
| Quadrant | Total seconds | Saturated seconds | Saturation percentage |
|---|---|---|---|
| A | 2660 | 13 | 0.488722% |
| B | 2660 | 11 | 0.413534% |
| C | 2660 | 19 | 0.714286% |
| D | 2660 | 6 | 0.225564% |
Noise dominated data is calculated using 1-second bins in cleaned event files. If a bin has >2000 counts, and if more than 50% of those come from <1% of pixels, then it is considered to be noise-dominated and hence unusable.
| Quadrant | # 1 sec bins | Bins with >0 counts | Bins with >2000 counts | High rate bins dominated by noise | Noise dominated (total time) | Noise dominated (detector-on time) | Marked lightcurve |
|---|---|---|---|---|---|---|---|
| A | 2661 | 2661 | 4 | 4 | 0.15% | 0.15% | 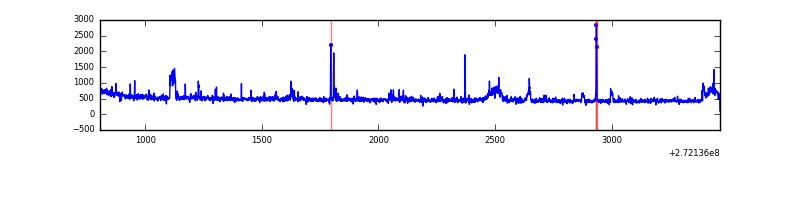 |
| B | 2661 | 2661 | 0 | 0 | 0.00% | 0.00% | 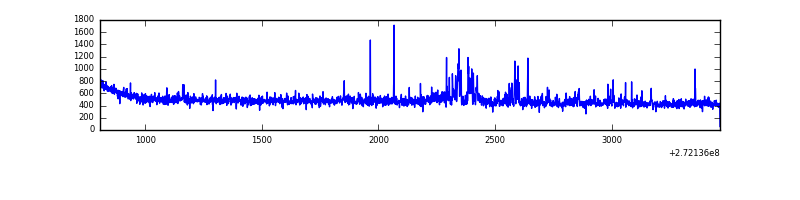 |
| C | 2661 | 2661 | 0 | 0 | 0.00% | 0.00% | 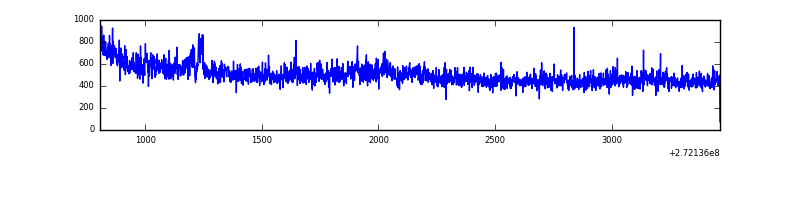 |
| D | 2661 | 2661 | 3 | 3 | 0.11% | 0.11% | 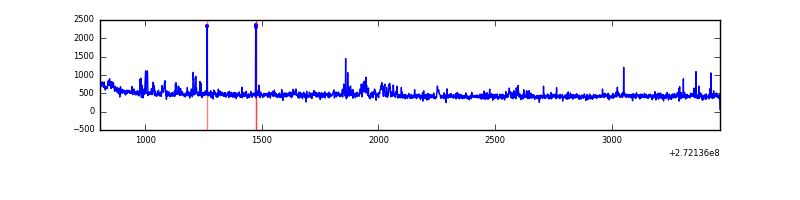 |
Top three noisy pixels from each quadrant. If the there are fewer than three noisy pixels in the level2.evt file, extra rows are filled as -1
| Pixel properties | Quadrant properties | ||||||
|---|---|---|---|---|---|---|---|
| Quadrant | DetID | PixID | Counts | Sigma | Mean | Median | Sigma |
| A | 0 | 253 | 90338 | 1381.48 | 314 | 306 | 65.2 |
| A | 13 | 248 | 21534 | 325.72 | 314 | 306 | 65.2 |
| A | 9 | 143 | 13230 | 198.3 | 314 | 306 | 65.2 |
| B | 0 | 189 | 33698 | 537.51 | 315 | 307 | 62.1 |
| B | 4 | 216 | 15624 | 246.56 | 315 | 307 | 62.1 |
| B | 0 | 197 | 6921 | 106.46 | 315 | 307 | 62.1 |
| C | 3 | 233 | 121977 | 1693.69 | 298 | 299 | 71.8 |
| C | 14 | 238 | 44944 | 621.43 | 298 | 299 | 71.8 |
| C | 13 | 61 | 2138 | 25.6 | 298 | 299 | 71.8 |
| D | 12 | 110 | 59442 | 781.59 | 302 | 292 | 75.7 |
| D | 2 | 234 | 13847 | 179.11 | 302 | 292 | 75.7 |
| D | 5 | 51 | 11701 | 150.75 | 302 | 292 | 75.7 |
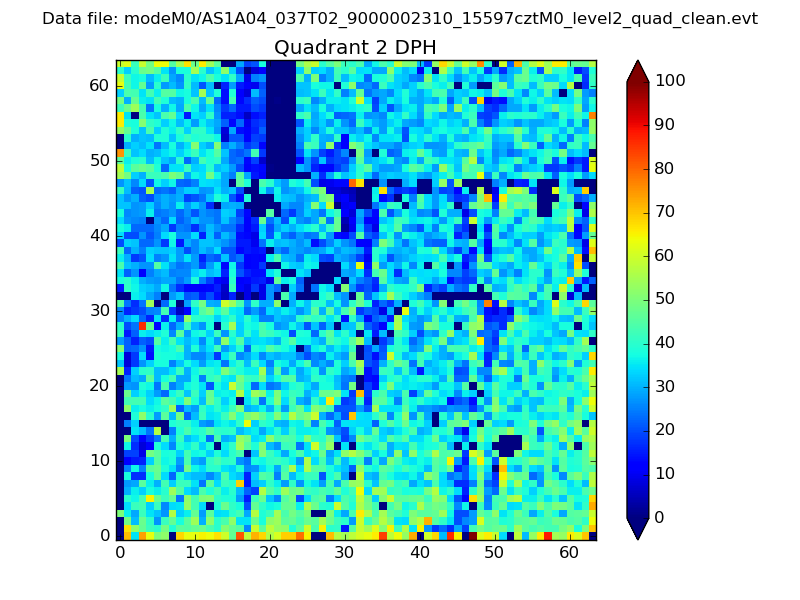
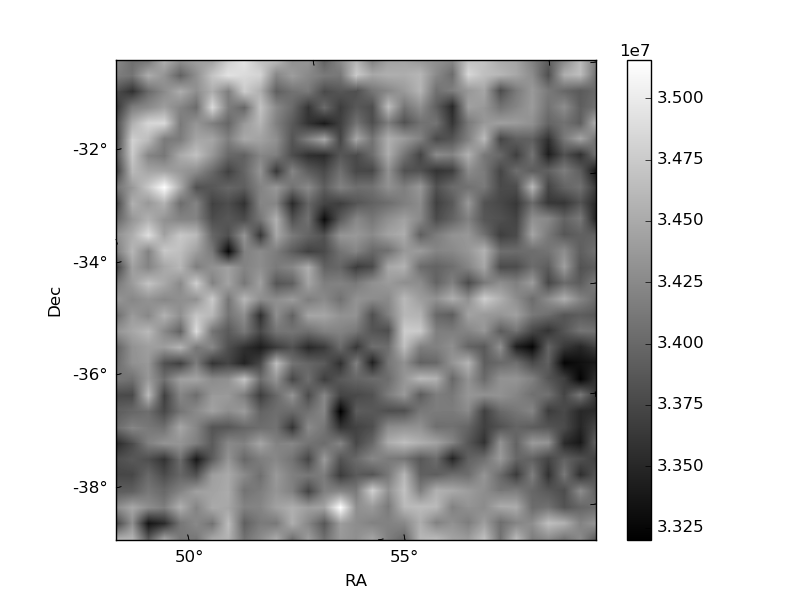
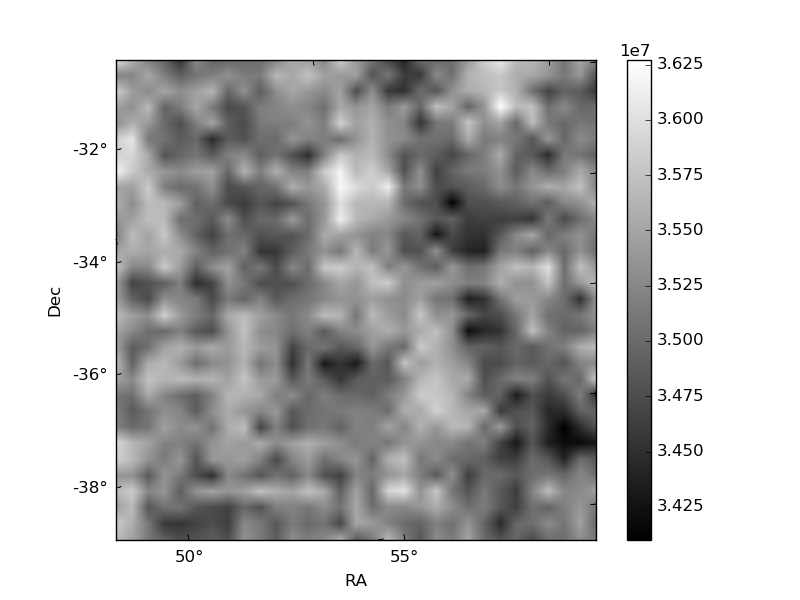
Histogram calculated using DETX and DETY for each event in the final _common_clean file
| Quadrant A | 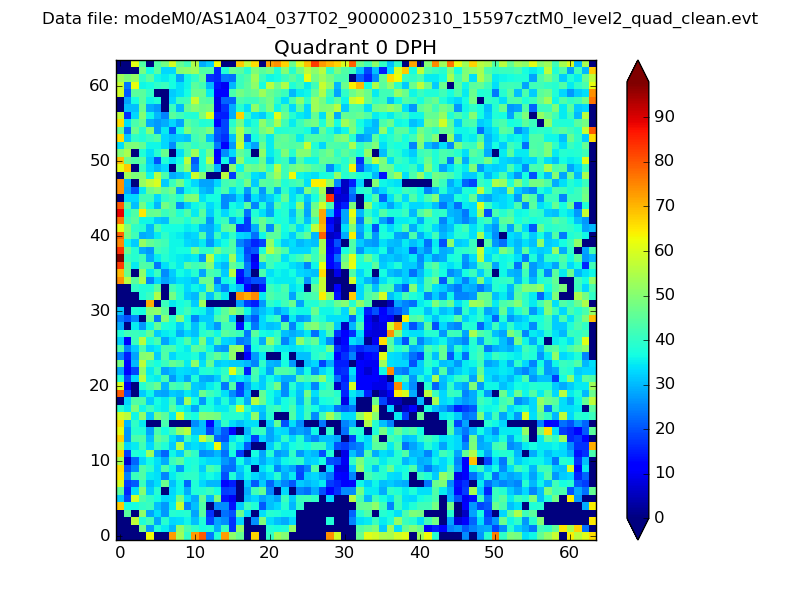 |
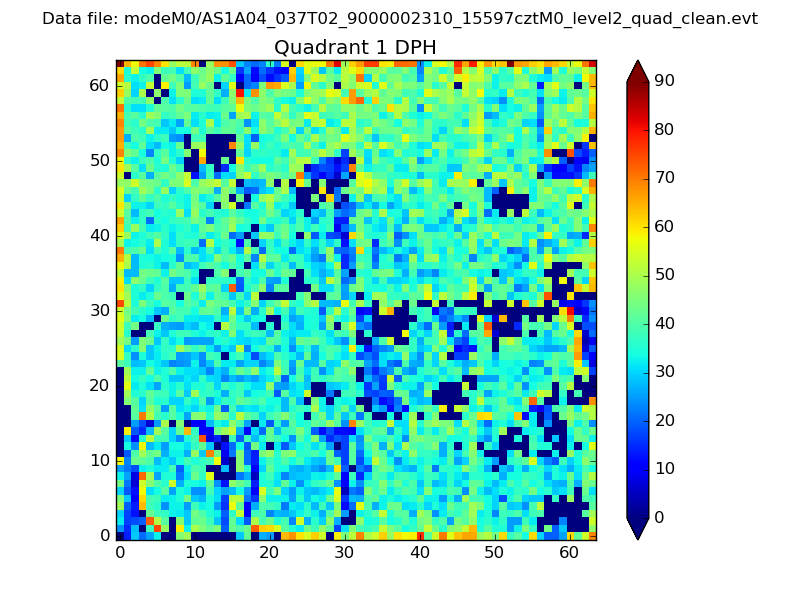 |
Quadrant B |
|---|---|---|---|
| Quadrant D | 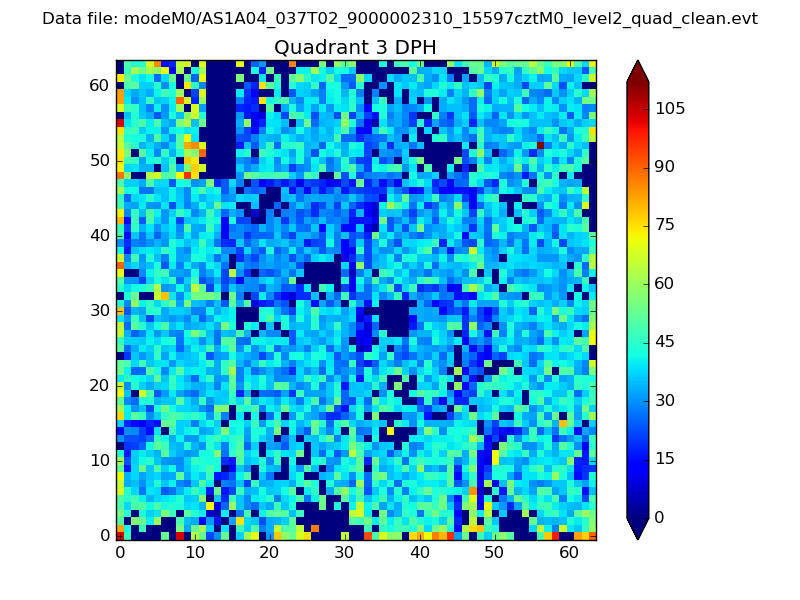 |
 |
Quadrant C |
| Plot type | Count rate plots | Images |
|---|---|---|
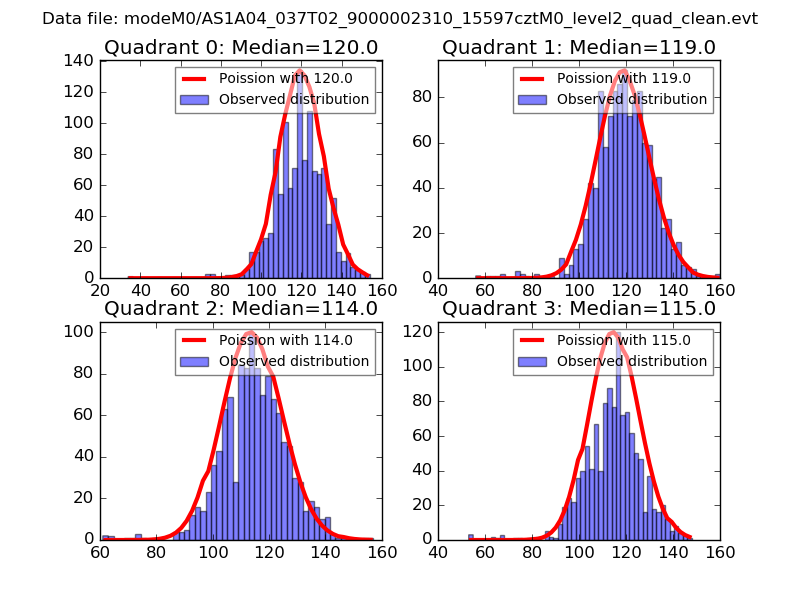
| Comparison with Poisson distribution Blue bars denote a histogram of data divided into 1 sec bins. Red curve is a Poisson curve with rate = median count rate of data. |
 |
 |
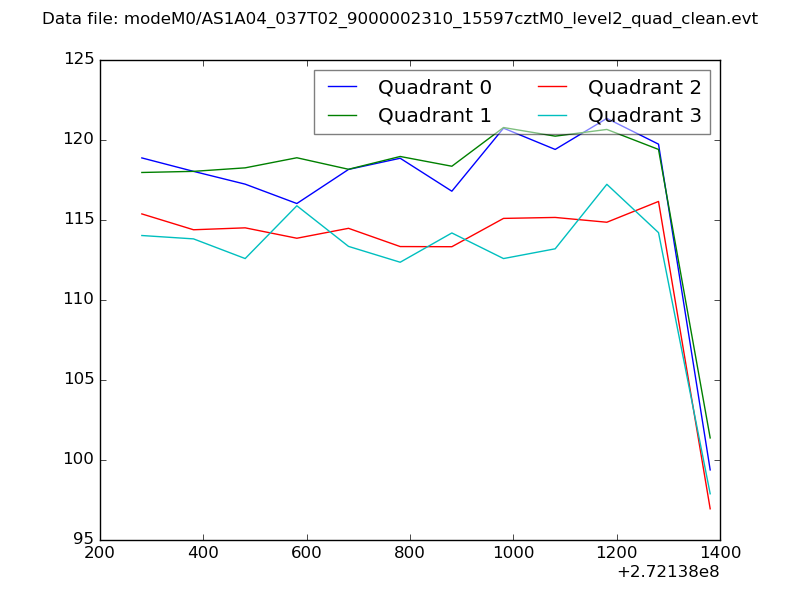
| Quadrant-wise count rates Data is divided into 100 sec bins |
 |
|
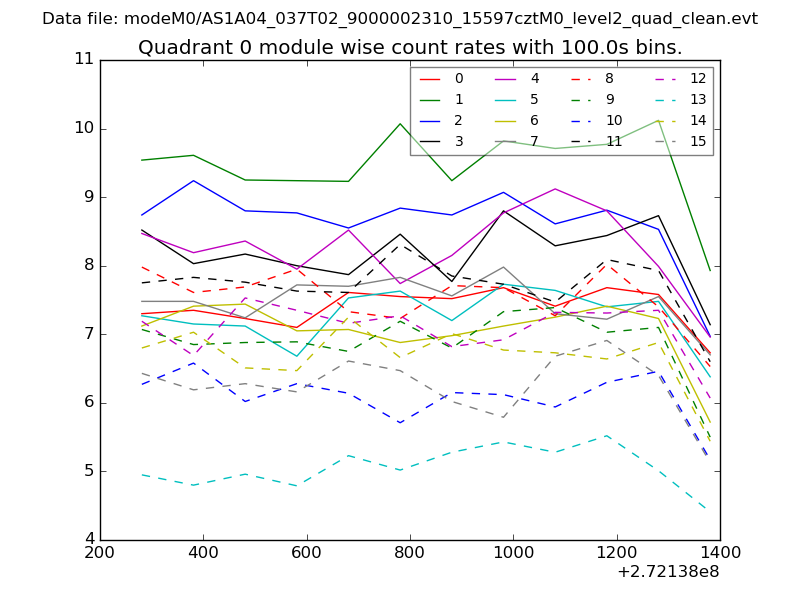
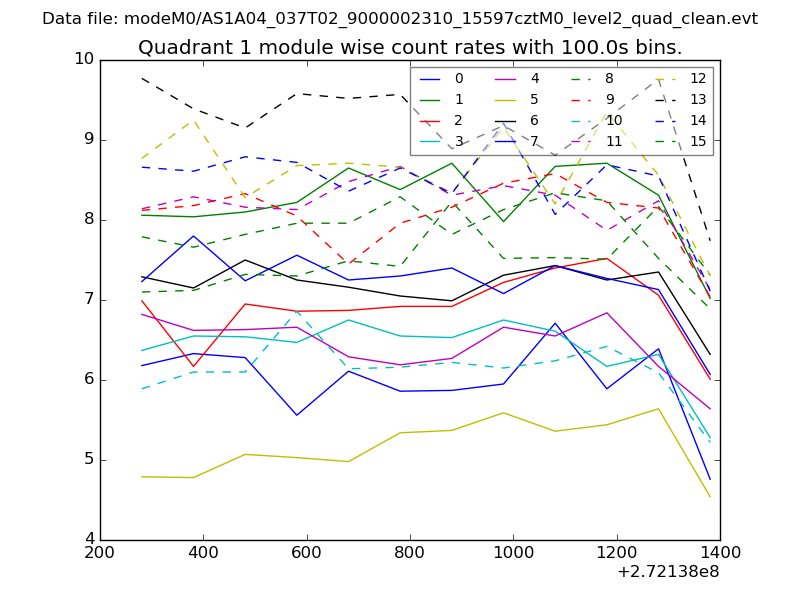
| Module-wise count rates for Quadrant A Data is divided into 100 sec bins |
 |
 |
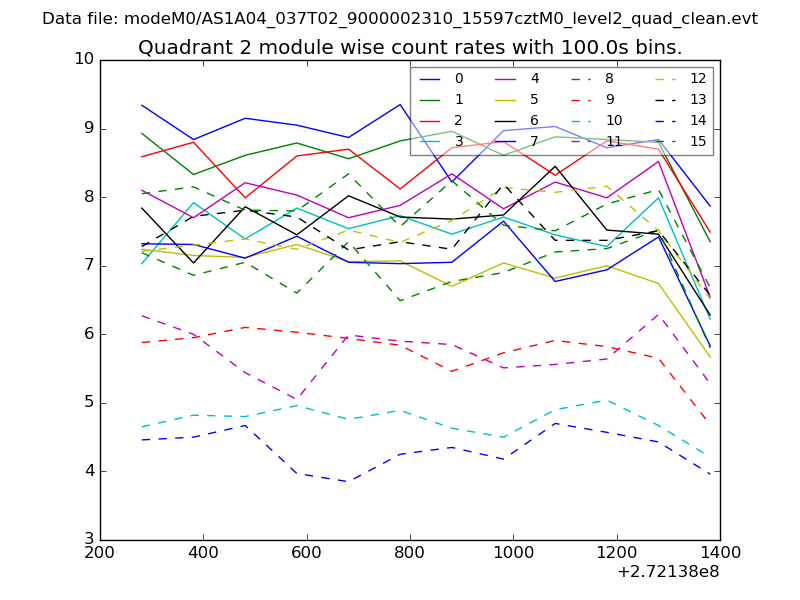
| Module-wise count rates for Quadrant B Data is divided into 100 sec bins |
 |
 |
| Module-wise count rates for Quadrant C Data is divided into 100 sec bins |
 |
 |
| Module-wise count rates for Quadrant D Data is divided into 100 sec bins |
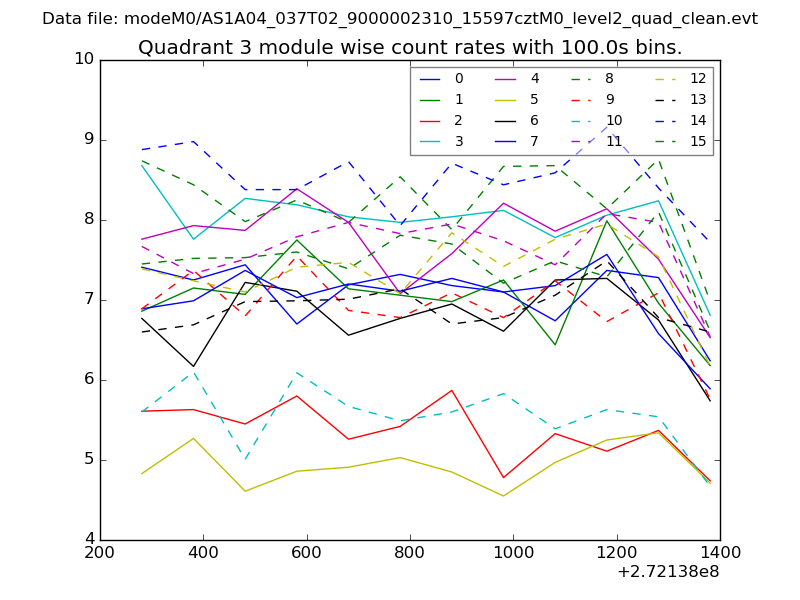 |
 |
| Parameter | Plot |
|---|---|
| CZT HV Monitor | 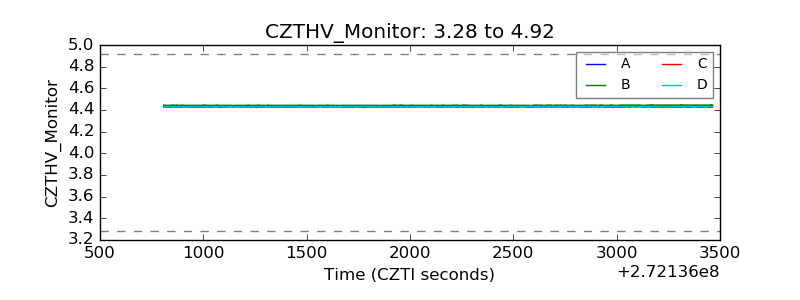 |
| D_VDD | 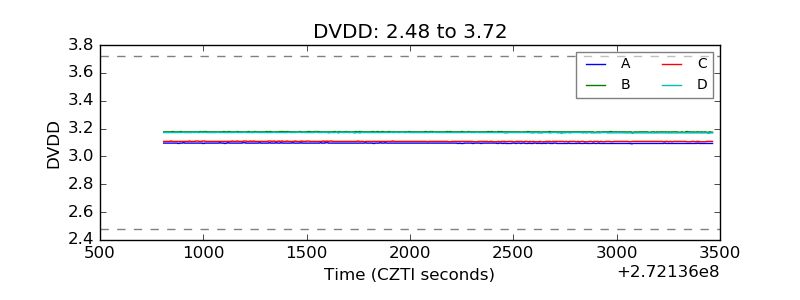 |
| Temperature 1 | 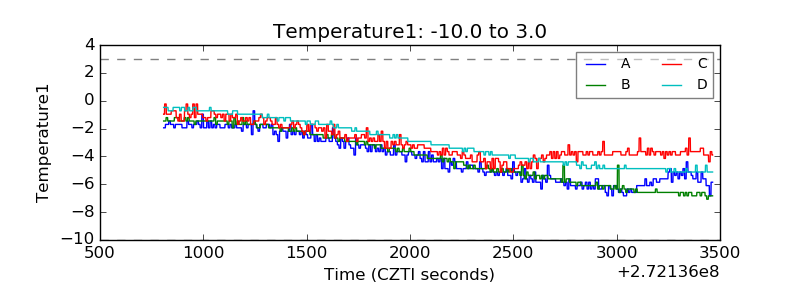 |
| Veto HV Monitor | 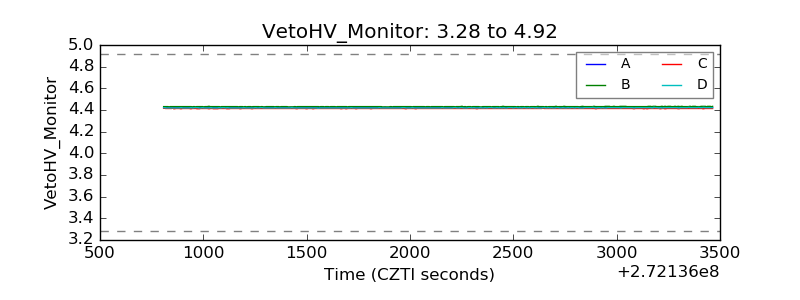 |
| Veto LLD |  |
| Alpha Counter | 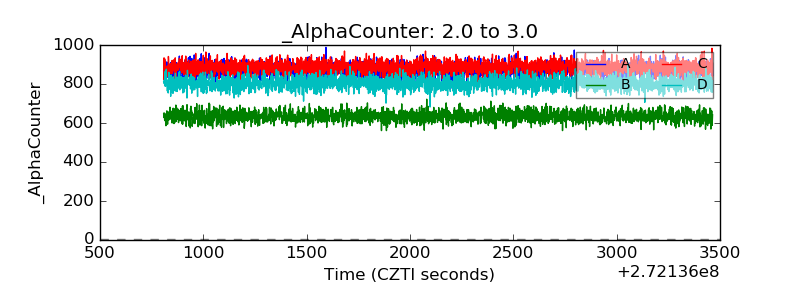 |
| _CPM_Rate | 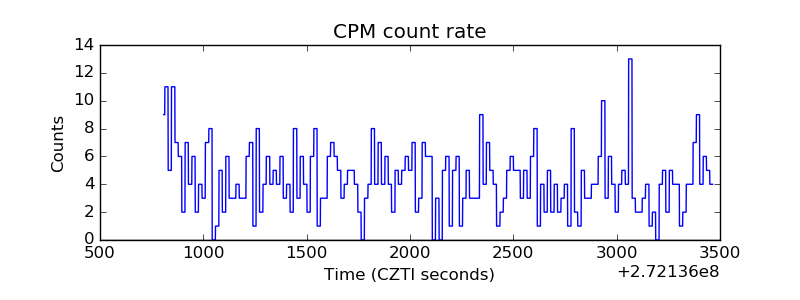 |
| CZT Counter | 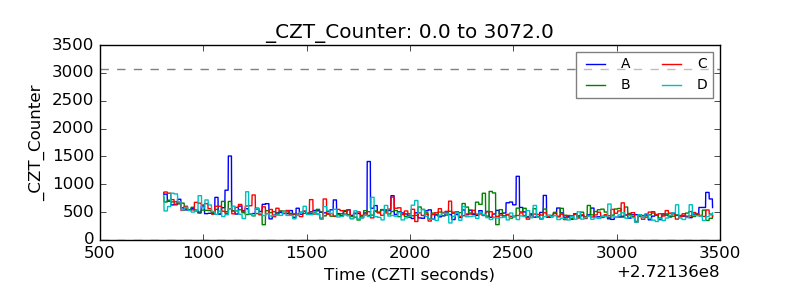 |
| +2.5 Volts monitor |  |
| +5 Volts monitor |  |
| _ROLL_ROT | 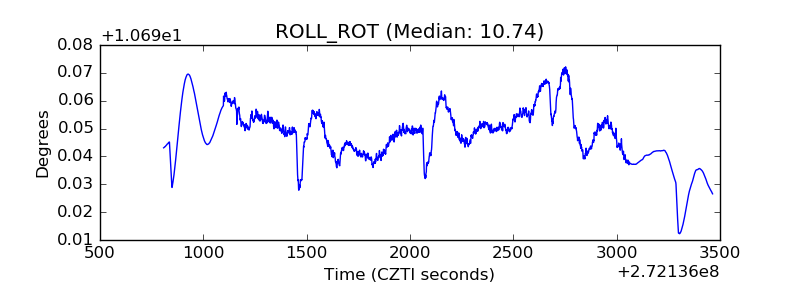 |
| _Roll_DEC | 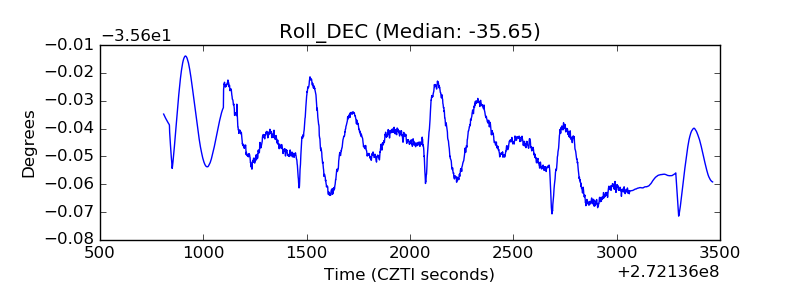 |
| _Roll_RA | 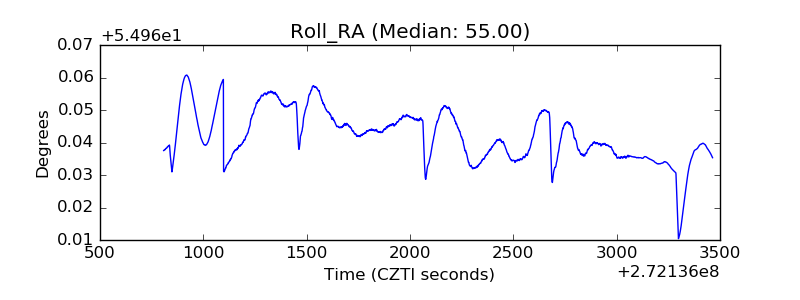 |
| Veto Counter | 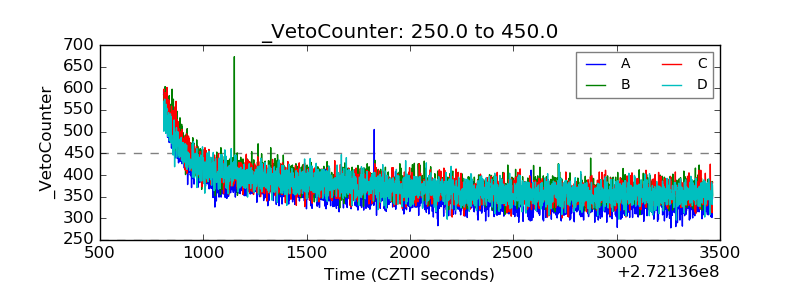 |