| Param | Original file | Final file |
|---|---|---|
| Filename | modeM0/AS1A04_037T01_9000002312cztM0_level2.fits | modeM0/AS1A04_037T01_9000002312cztM0_level2_quad_clean.evt |
| Size (bytes) | 684,293,760 | 519,598,080 |
| Size | 652.6 MB | 495.5 MB |
| Events in quadrant A | 4,193,298 | 2,848,073 |
| Events in quadrant B | 4,011,488 | 2,866,530 |
| Events in quadrant C | 4,093,802 | 2,704,188 |
| Events in quadrant D | 3,641,890 | 2,531,733 |
| Mode SS | |||
|---|---|---|---|
| Quadrant | BADHDUFLAG | Total packets | Discarded packets |
| A | 0 | 1418 | 0 |
| B | 0 | 1418 | 0 |
| C | 0 | 1418 | 0 |
| D | 0 | 1418 | 0 |
| Mode M0 | |||
|---|---|---|---|
| Quadrant | BADHDUFLAG | Total packets | Discarded packets |
| A | 0 | 150726 | 0 |
| B | 0 | 152566 | 0 |
| C | 0 | 151385 | 0 |
| D | 0 | 146698 | 0 |
| Mode M9 | |||
|---|---|---|---|
| Quadrant | BADHDUFLAG | Total packets | Discarded packets |
| A | 0 | 116 | 0 |
| B | 0 | 116 | 0 |
| C | 0 | 116 | 0 |
| D | 0 | 116 | 0 |
| Quadrant | Total seconds | Saturated seconds | Saturation percentage |
|---|---|---|---|
| A | 69769 | 1134 | 1.625364% |
| B | 69769 | 982 | 1.407502% |
| C | 69769 | 1272 | 1.823159% |
| D | 69769 | 740 | 1.060643% |
Noise dominated data is calculated using 1-second bins in cleaned event files. If a bin has >2000 counts, and if more than 50% of those come from <1% of pixels, then it is considered to be noise-dominated and hence unusable.
| Quadrant | # 1 sec bins | Bins with >0 counts | Bins with >2000 counts | High rate bins dominated by noise | Noise dominated (total time) | Noise dominated (detector-on time) | Marked lightcurve |
|---|---|---|---|---|---|---|---|
| A | 81254 | 69755 | 0 | 0 | 0.00% | 0.00% | 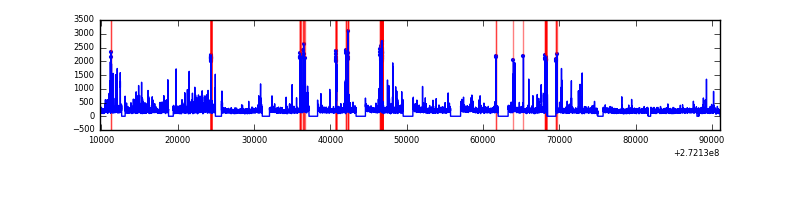 |
| B | 81254 | 69760 | 0 | 0 | 0.00% | 0.00% | 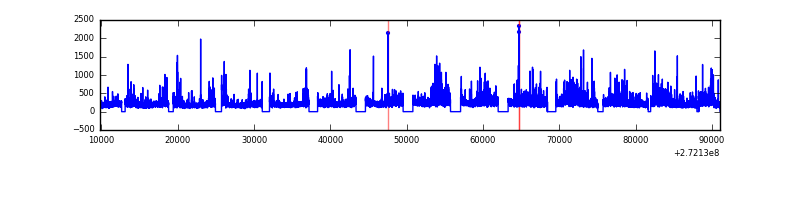 |
| C | 81254 | 69758 | 0 | 0 | 0.00% | 0.00% | 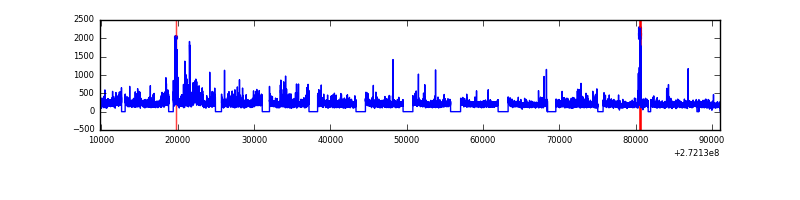 |
| D | 81254 | 69758 | 0 | 0 | 0.00% | 0.00% |  |
Top three noisy pixels from each quadrant. If the there are fewer than three noisy pixels in the level2.evt file, extra rows are filled as -1
| Pixel properties | Quadrant properties | ||||||
|---|---|---|---|---|---|---|---|
| Quadrant | DetID | PixID | Counts | Sigma | Mean | Median | Sigma |
| A | 0 | 29 | 3982 | 11.06 | 1091 | 1023 | 267.5 |
| A | 7 | 110 | 3295 | 8.49 | 1091 | 1023 | 267.5 |
| A | 9 | 19 | 3174 | 8.04 | 1091 | 1023 | 267.5 |
| B | 2 | 9 | 3366 | 11.46 | 1057 | 1008 | 205.7 |
| B | 2 | 8 | 2761 | 8.52 | 1057 | 1008 | 205.7 |
| B | 3 | 17 | 2715 | 8.3 | 1057 | 1008 | 205.7 |
| C | 12 | 241 | 2858 | 6.68 | 1081 | 1008 | 277.0 |
| C | 3 | 126 | 2698 | 6.1 | 1081 | 1008 | 277.0 |
| C | 9 | 233 | 2679 | 6.03 | 1081 | 1008 | 277.0 |
| D | 6 | 231 | 2600 | 6.03 | 1039 | 947 | 274.1 |
| D | 3 | 14 | 2591 | 6.0 | 1039 | 947 | 274.1 |
| D | 10 | 189 | 2572 | 5.93 | 1039 | 947 | 274.1 |
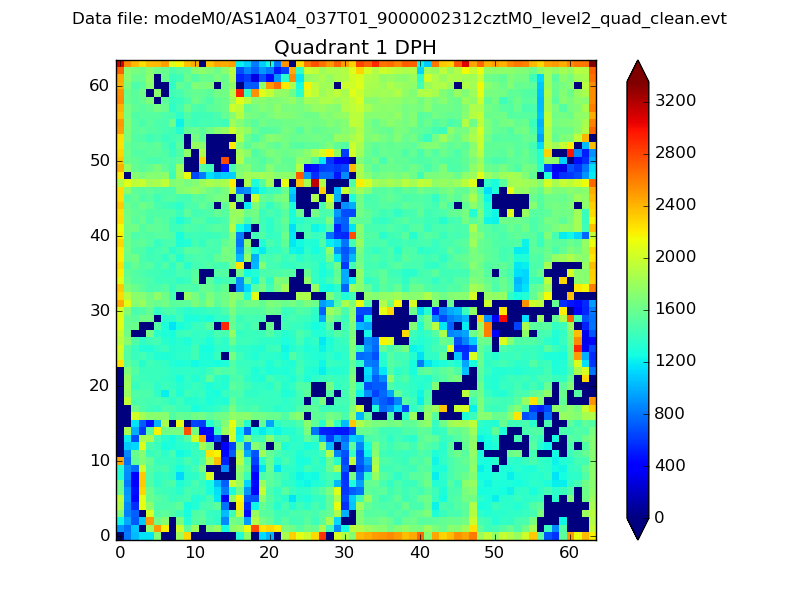
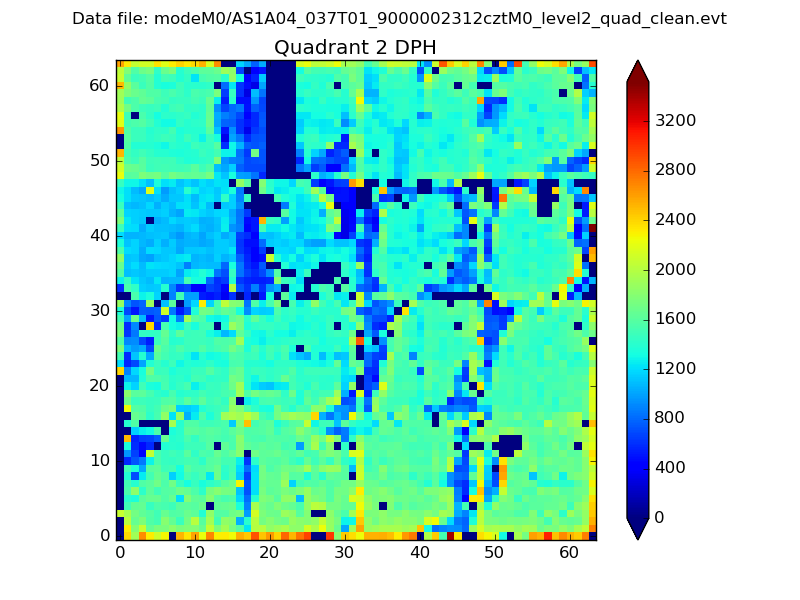
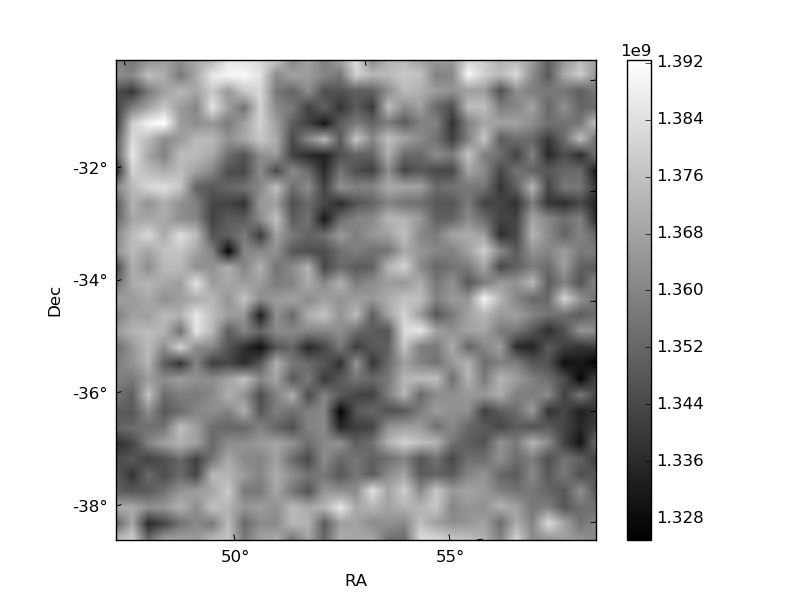
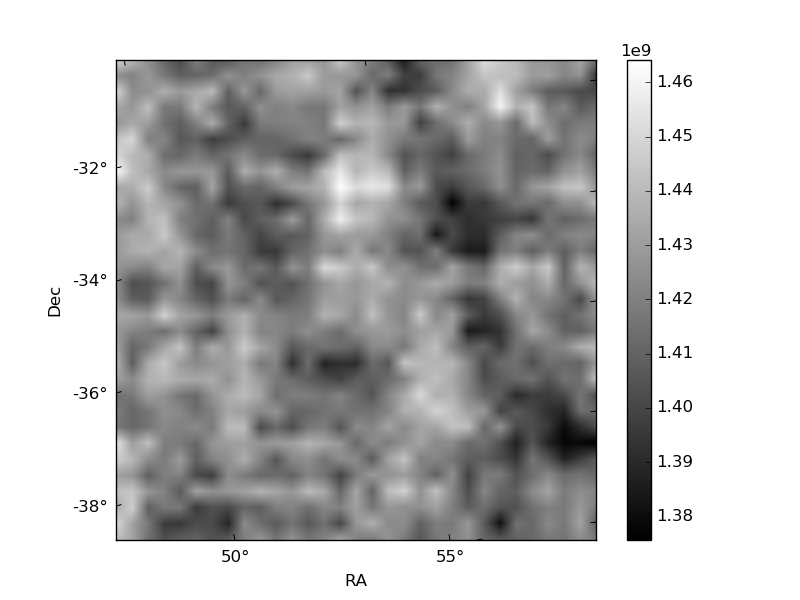
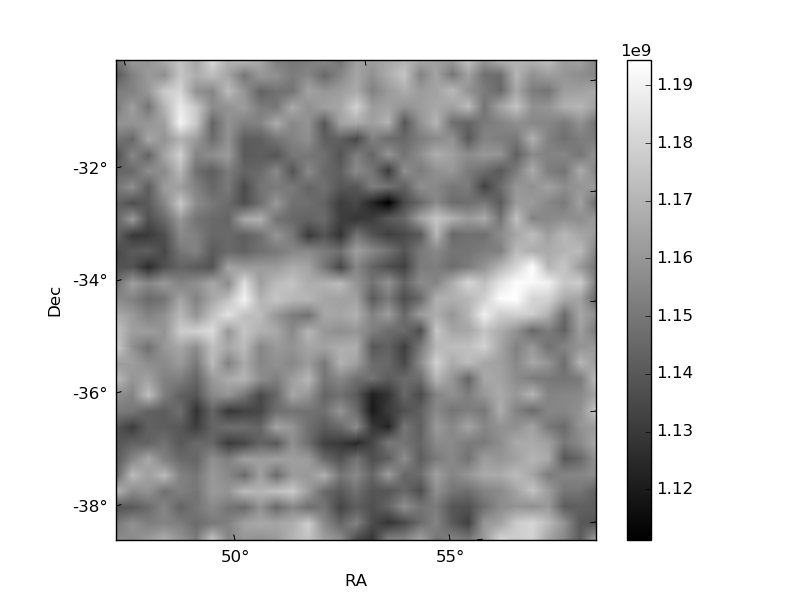
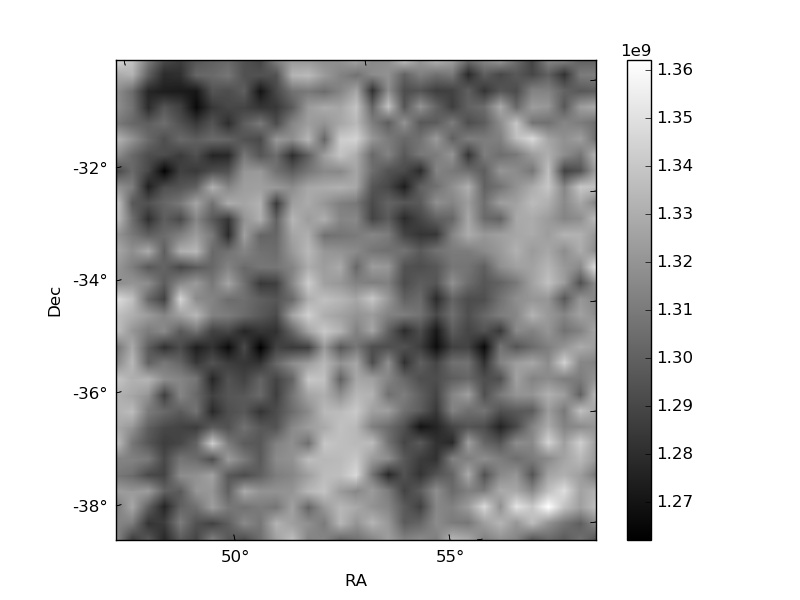
Histogram calculated using DETX and DETY for each event in the final _common_clean file
| Quadrant A | 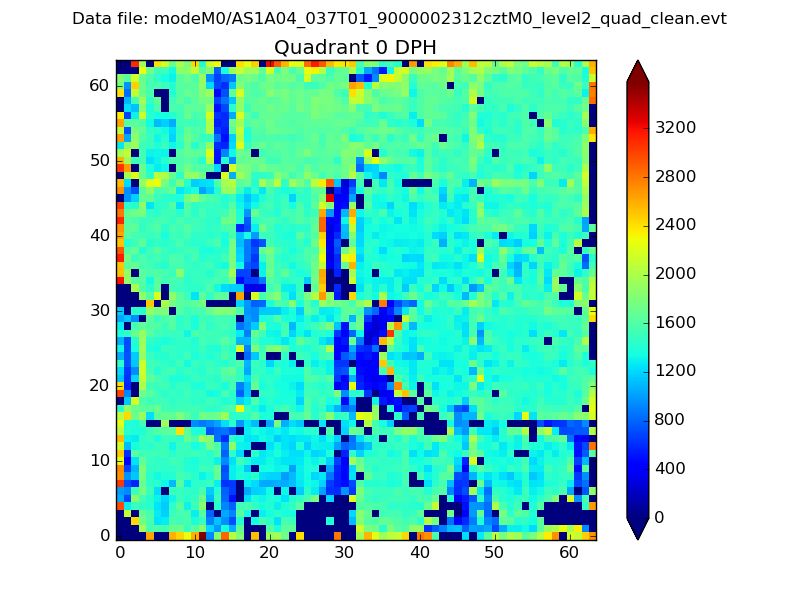 |
 |
Quadrant B |
|---|---|---|---|
| Quadrant D | 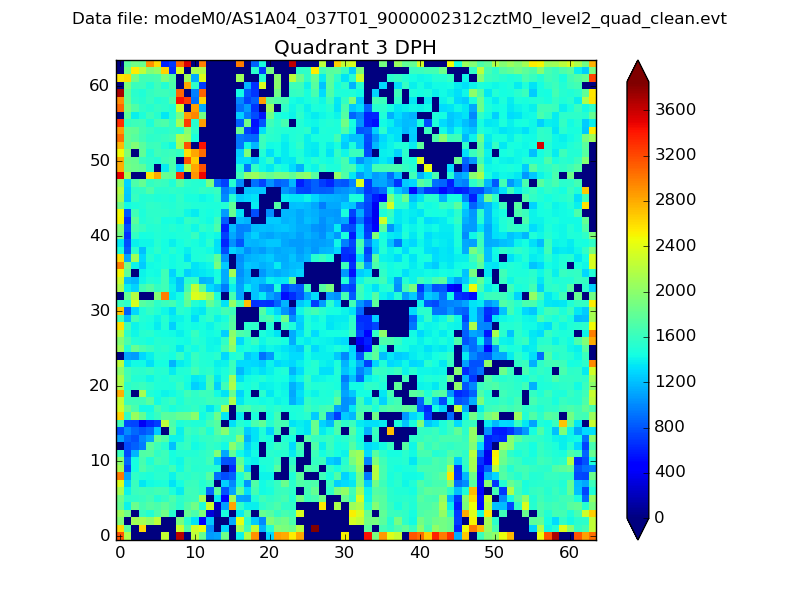 |
 |
Quadrant C |
| Plot type | Count rate plots | Images |
|---|---|---|
| Comparison with Poisson distribution Blue bars denote a histogram of data divided into 1 sec bins. Red curve is a Poisson curve with rate = median count rate of data. |
 |
 |
| Quadrant-wise count rates Data is divided into 100 sec bins |
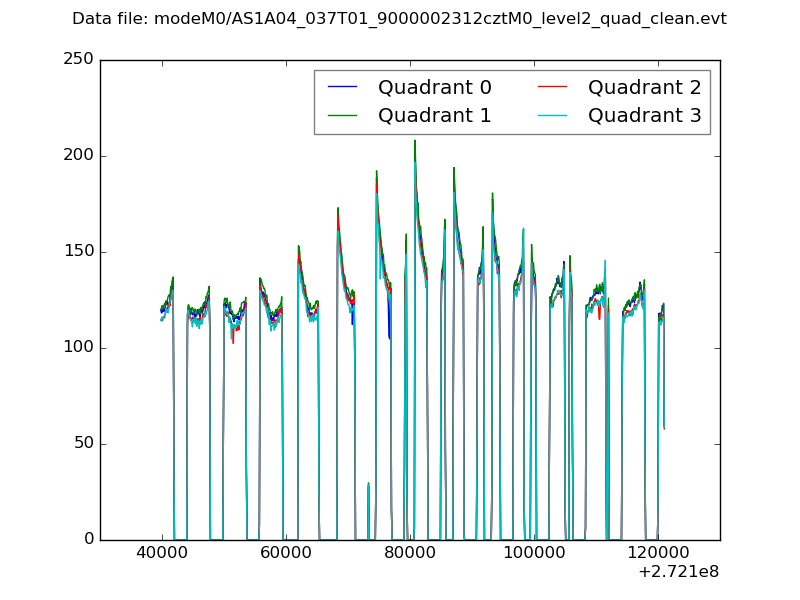 |
|
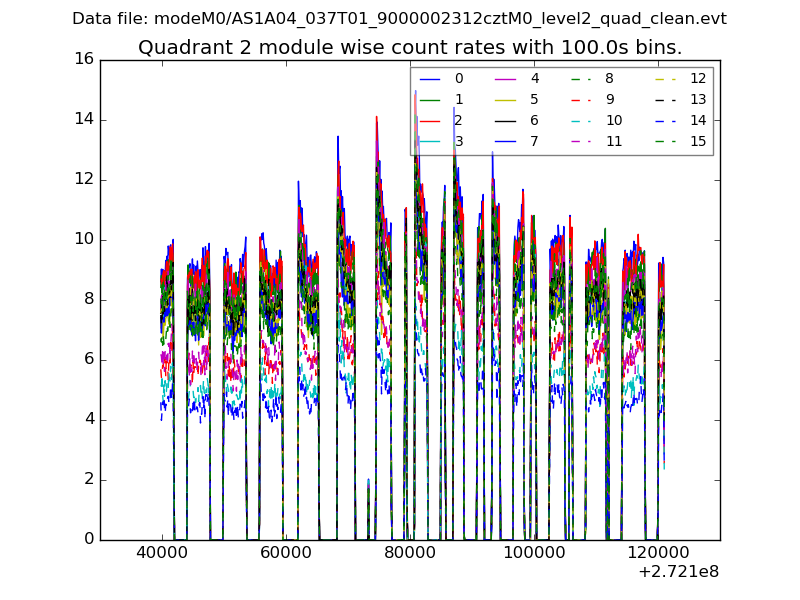
| Module-wise count rates for Quadrant A Data is divided into 100 sec bins |
 |
 |
| Module-wise count rates for Quadrant B Data is divided into 100 sec bins |
 |
 |
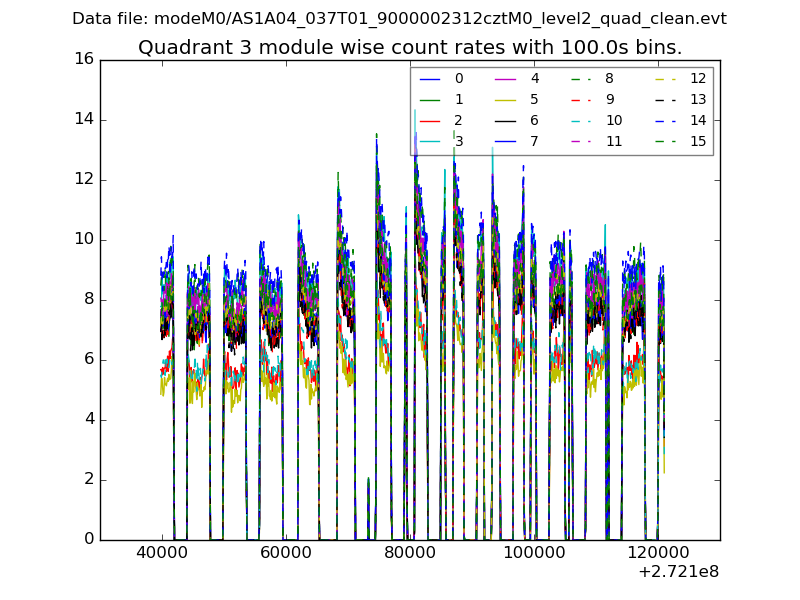
| Module-wise count rates for Quadrant C Data is divided into 100 sec bins |
 |
 |
| Module-wise count rates for Quadrant D Data is divided into 100 sec bins |
 |
 |
| Parameter | Plot |
|---|---|
| CZT HV Monitor |  |
| D_VDD | 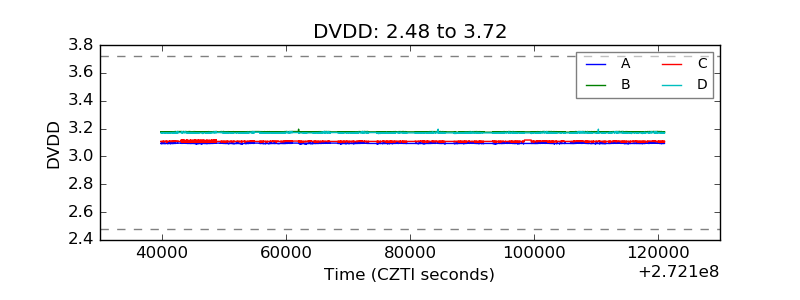 |
| Temperature 1 | 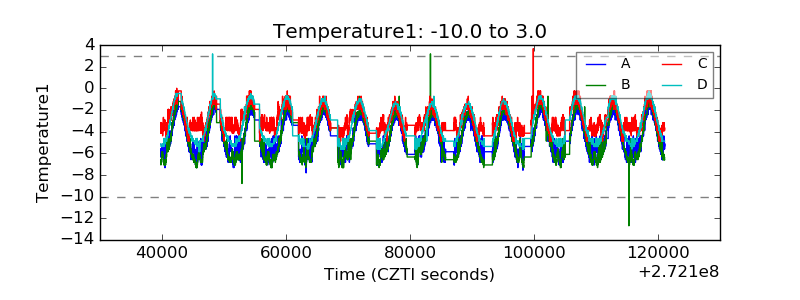 |
| Veto HV Monitor |  |
| Veto LLD | 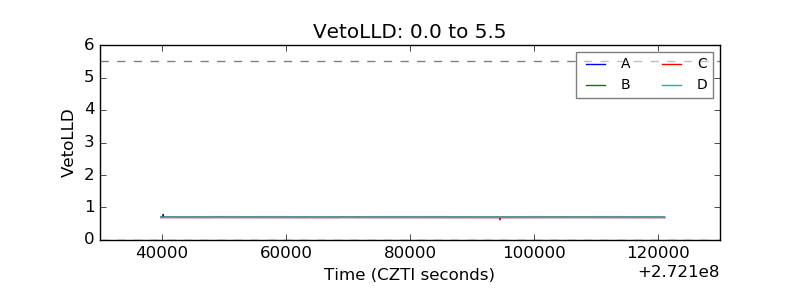 |
| Alpha Counter |  |
| _CPM_Rate | 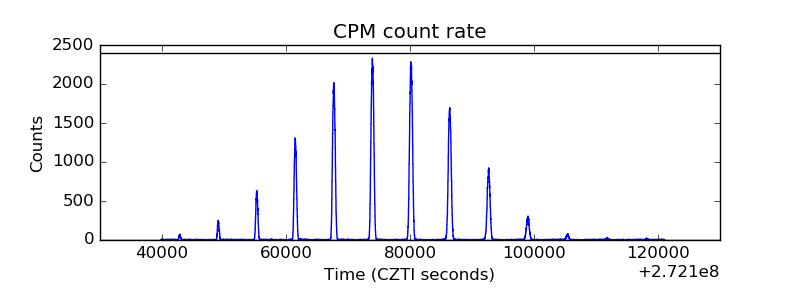 |
| CZT Counter | 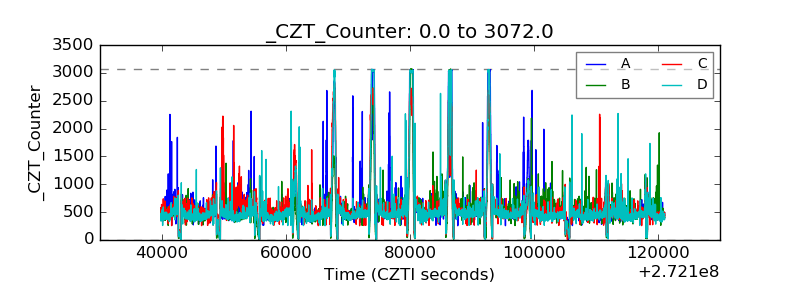 |
| +2.5 Volts monitor |  |
| +5 Volts monitor |  |
| _ROLL_ROT | 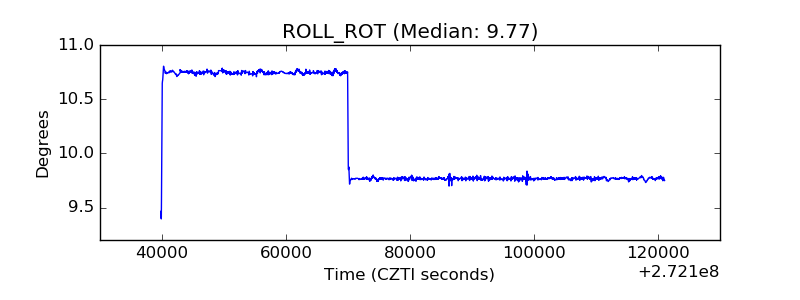 |
| _Roll_DEC | 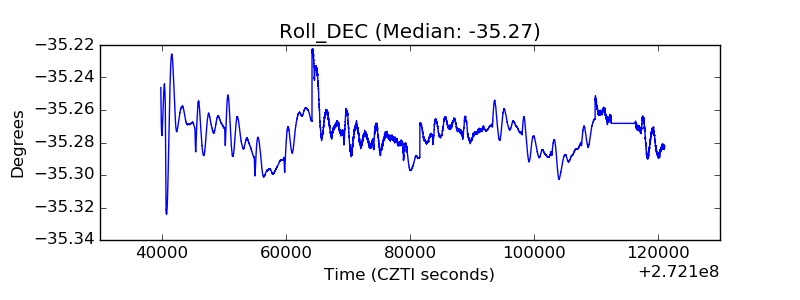 |
| _Roll_RA | 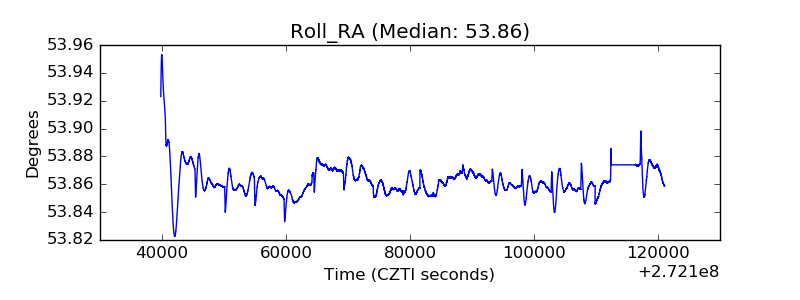 |
| Veto Counter | 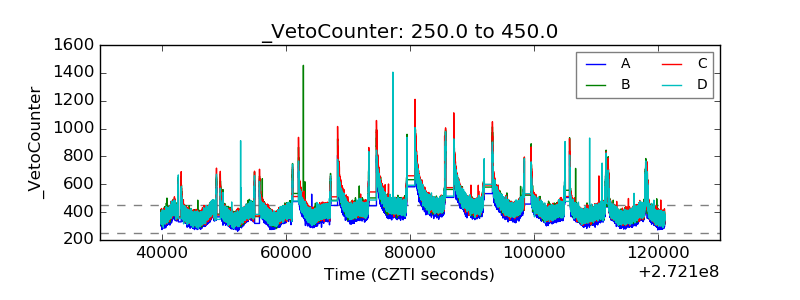 |