| Param | Original file | Final file |
|---|---|---|
| Filename | modeM0/AS1A04_037T01_9000002312_15597cztM0_level2.evt | modeM0/AS1A04_037T01_9000002312_15597cztM0_level2_quad_clean.evt |
| Size (bytes) | 1,086,975,360 | 208,437,120 |
| Size | 1.0 GB | 198.8 MB |
| Events in quadrant A | 8,113,627 | 1,326,956 |
| Events in quadrant B | 7,556,181 | 1,347,152 |
| Events in quadrant C | 8,962,854 | 1,286,146 |
| Events in quadrant D | 7,237,259 | 1,282,451 |
| Mode SS | |||
|---|---|---|---|
| Quadrant | BADHDUFLAG | Total packets | Discarded packets |
| A | 0 | 314 | 0 |
| B | 0 | 314 | 0 |
| C | 0 | 314 | 0 |
| D | 0 | 314 | 0 |
| Mode M0 | |||
|---|---|---|---|
| Quadrant | BADHDUFLAG | Total packets | Discarded packets |
| A | 0 | 34191 | 4 |
| B | 0 | 32476 | 3 |
| C | 0 | 36273 | 3 |
| D | 0 | 32170 | 3 |
| Mode M9 | |||
|---|---|---|---|
| Quadrant | BADHDUFLAG | Total packets | Discarded packets |
| A | 0 | 20 | 0 |
| B | 0 | 20 | 0 |
| C | 0 | 20 | 0 |
| D | 0 | 20 | 0 |
| Quadrant | Total seconds | Saturated seconds | Saturation percentage |
|---|---|---|---|
| A | 15524 | 156 | 1.004896% |
| B | 15524 | 120 | 0.772997% |
| C | 15524 | 349 | 2.248132% |
| D | 15524 | 103 | 0.663489% |
Noise dominated data is calculated using 1-second bins in cleaned event files. If a bin has >2000 counts, and if more than 50% of those come from <1% of pixels, then it is considered to be noise-dominated and hence unusable.
| Quadrant | # 1 sec bins | Bins with >0 counts | Bins with >2000 counts | High rate bins dominated by noise | Noise dominated (total time) | Noise dominated (detector-on time) | Marked lightcurve |
|---|---|---|---|---|---|---|---|
| A | 17405 | 15527 | 47 | 47 | 0.27% | 0.30% | 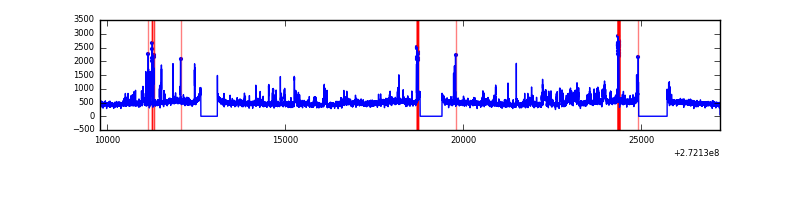 |
| B | 17405 | 15527 | 11 | 11 | 0.06% | 0.07% | 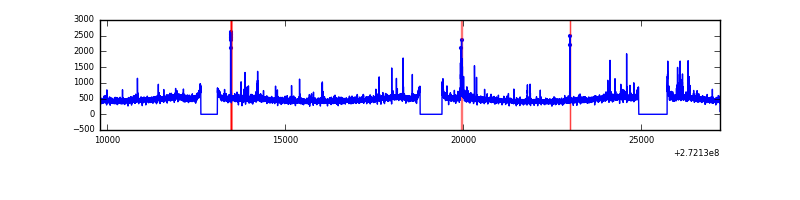 |
| C | 17405 | 15526 | 95 | 95 | 0.55% | 0.61% | 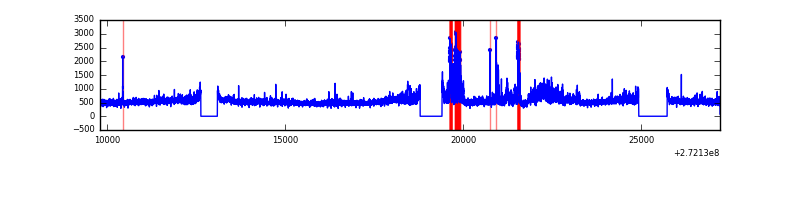 |
| D | 17405 | 15528 | 25 | 25 | 0.14% | 0.16% | 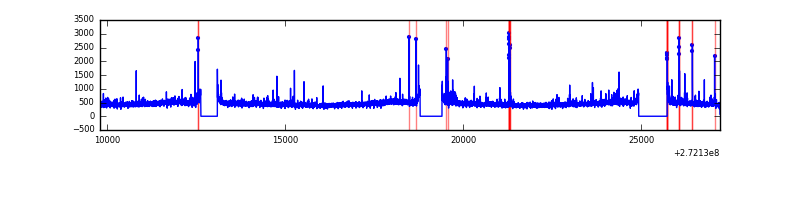 |
Top three noisy pixels from each quadrant. If the there are fewer than three noisy pixels in the level2.evt file, extra rows are filled as -1
| Pixel properties | Quadrant properties | ||||||
|---|---|---|---|---|---|---|---|
| Quadrant | DetID | PixID | Counts | Sigma | Mean | Median | Sigma |
| A | 0 | 253 | 853599 | 2282.74 | 1853 | 1811 | 373.1 |
| A | 4 | 2 | 93658 | 246.14 | 1853 | 1811 | 373.1 |
| A | 9 | 143 | 20696 | 50.61 | 1853 | 1811 | 373.1 |
| B | 0 | 189 | 72092 | 197.43 | 1856 | 1808 | 356.0 |
| B | 0 | 197 | 56970 | 154.95 | 1856 | 1808 | 356.0 |
| B | 12 | 111 | 41448 | 111.35 | 1856 | 1808 | 356.0 |
| C | 3 | 233 | 1658132 | 3954.67 | 1785 | 1797 | 418.8 |
| C | 14 | 238 | 274660 | 651.49 | 1785 | 1797 | 418.8 |
| C | 0 | 207 | 32053 | 72.24 | 1785 | 1797 | 418.8 |
| D | 4 | 95 | 78928 | 174.53 | 1820 | 1770 | 442.1 |
| D | 2 | 234 | 72353 | 159.66 | 1820 | 1770 | 442.1 |
| D | 10 | 70 | 54447 | 119.16 | 1820 | 1770 | 442.1 |
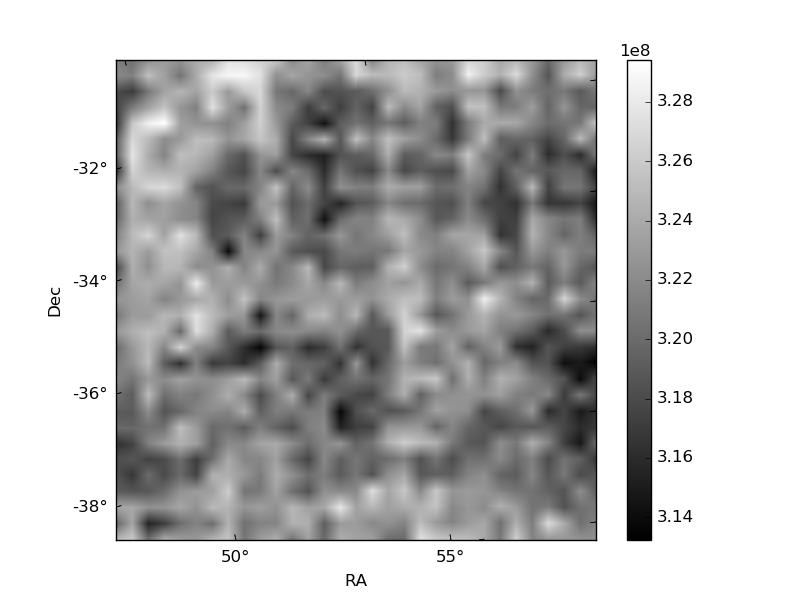
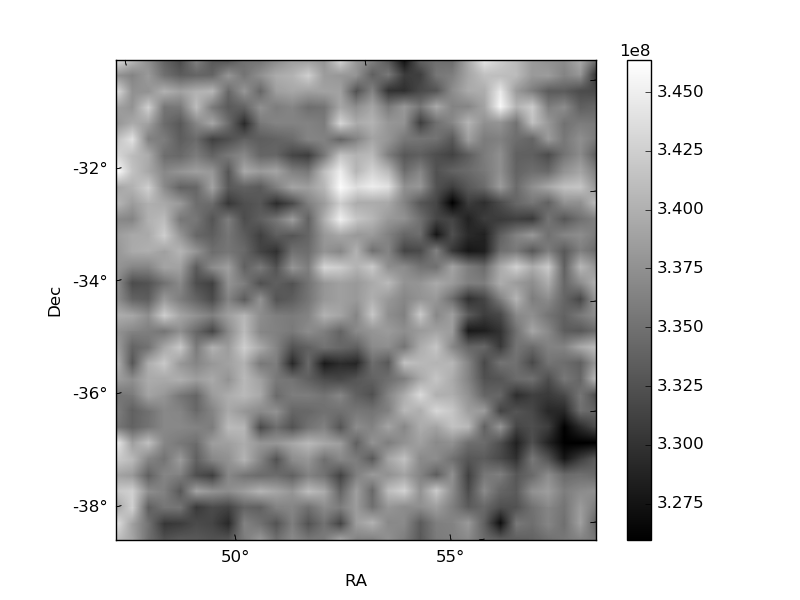
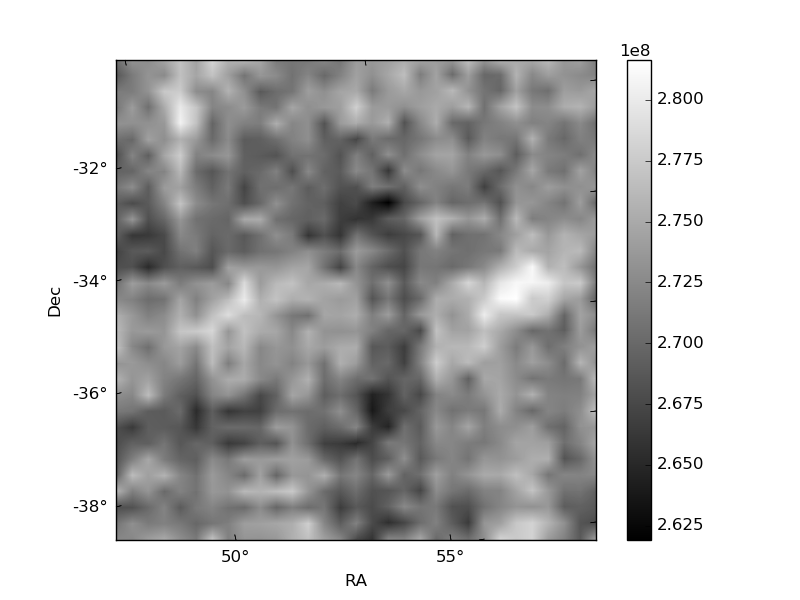
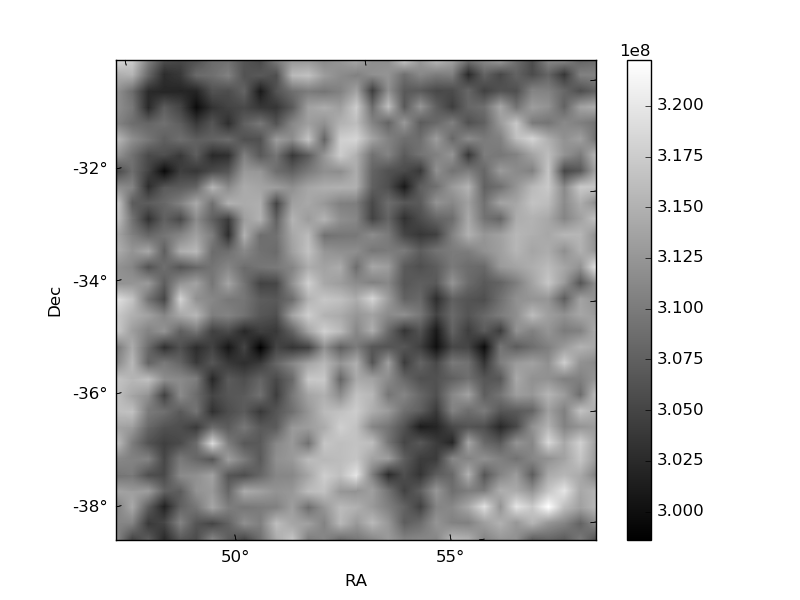
Histogram calculated using DETX and DETY for each event in the final _common_clean file
| Quadrant A | 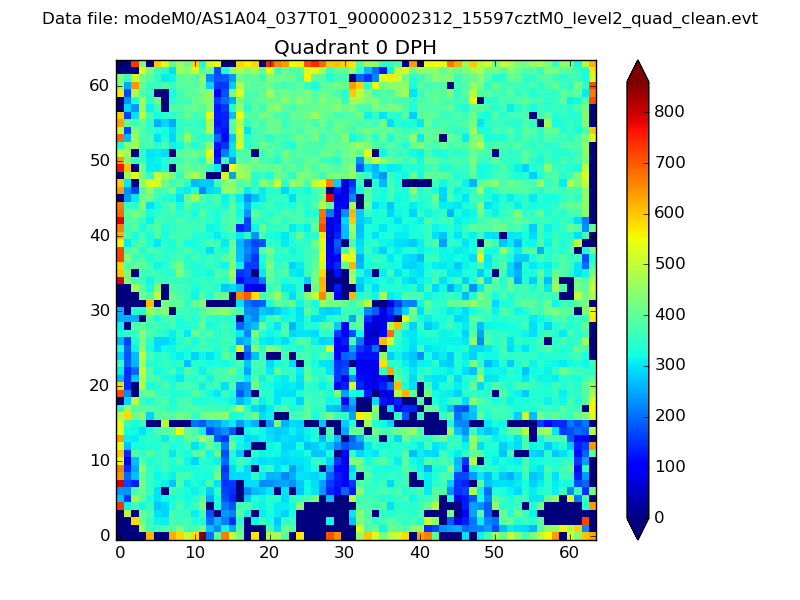 |
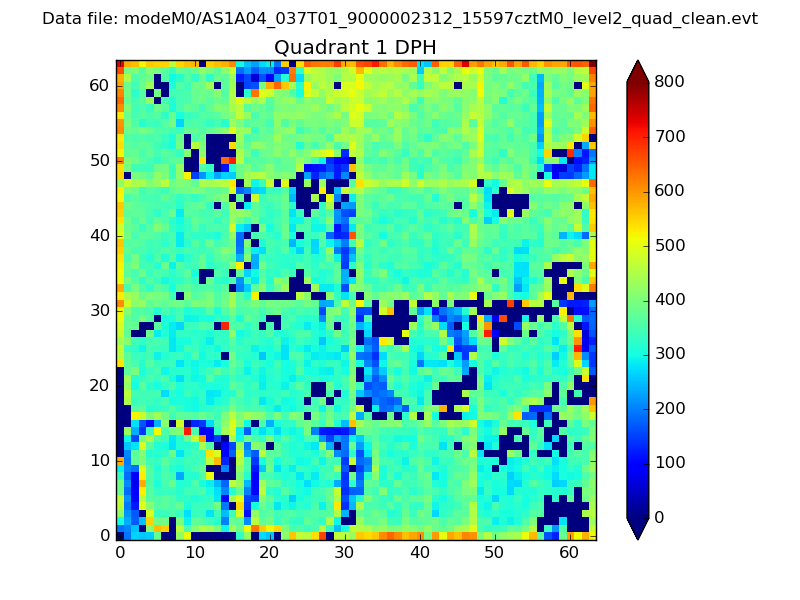 |
Quadrant B |
|---|---|---|---|
| Quadrant D | 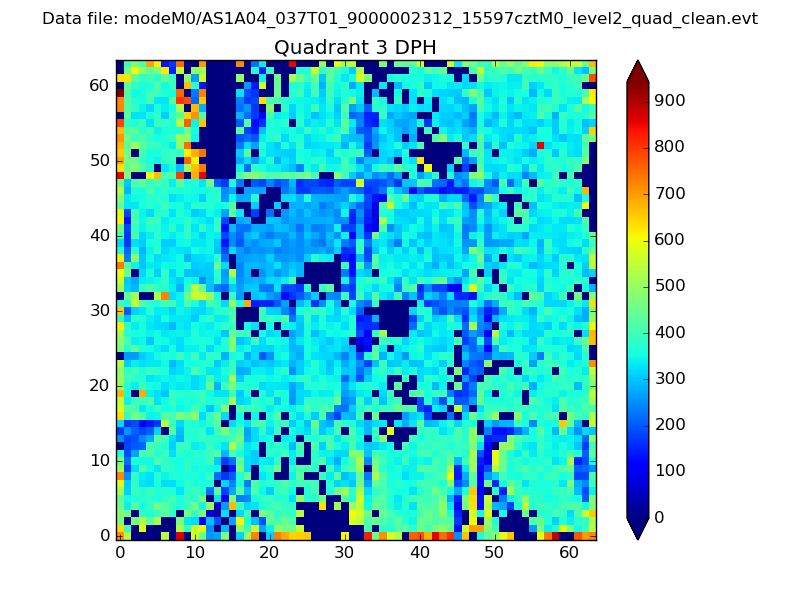 |
 |
Quadrant C |
| Plot type | Count rate plots | Images |
|---|---|---|
| Comparison with Poisson distribution Blue bars denote a histogram of data divided into 1 sec bins. Red curve is a Poisson curve with rate = median count rate of data. |
 |
 |
| Quadrant-wise count rates Data is divided into 100 sec bins |
 |
|
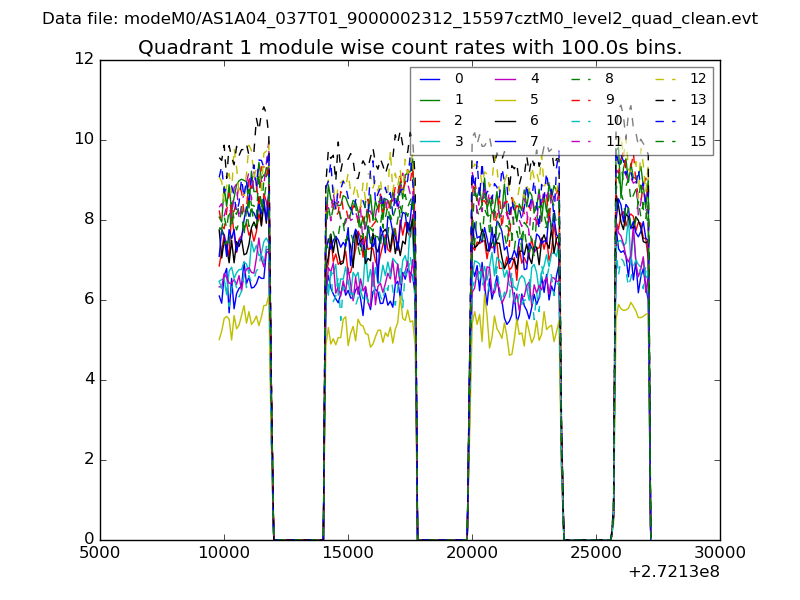
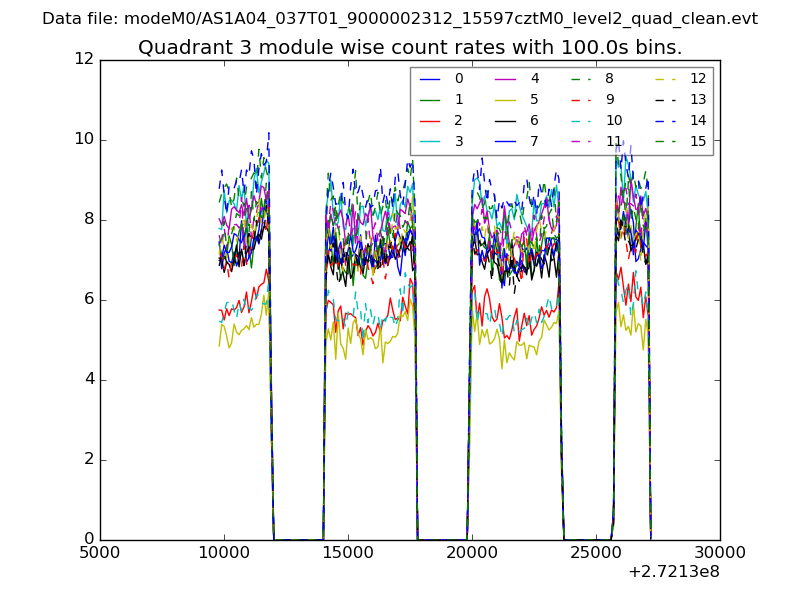
| Module-wise count rates for Quadrant A Data is divided into 100 sec bins |
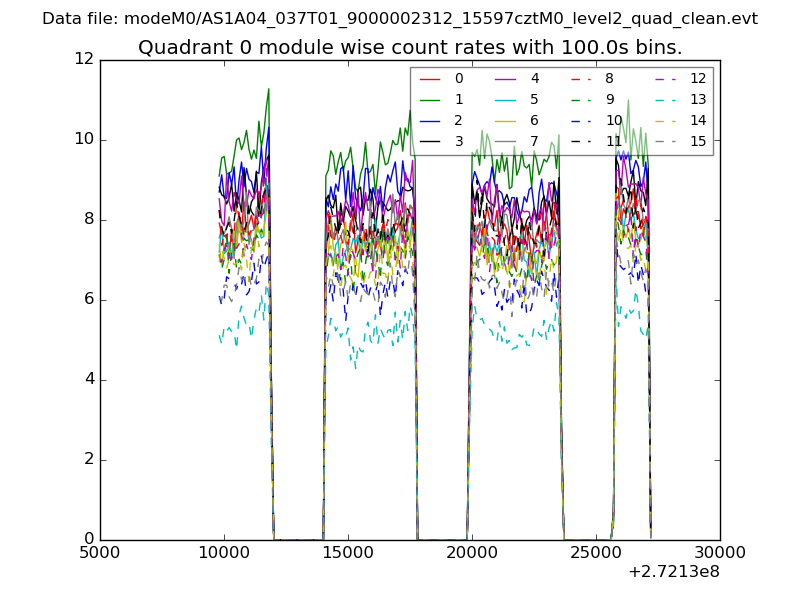 |
 |
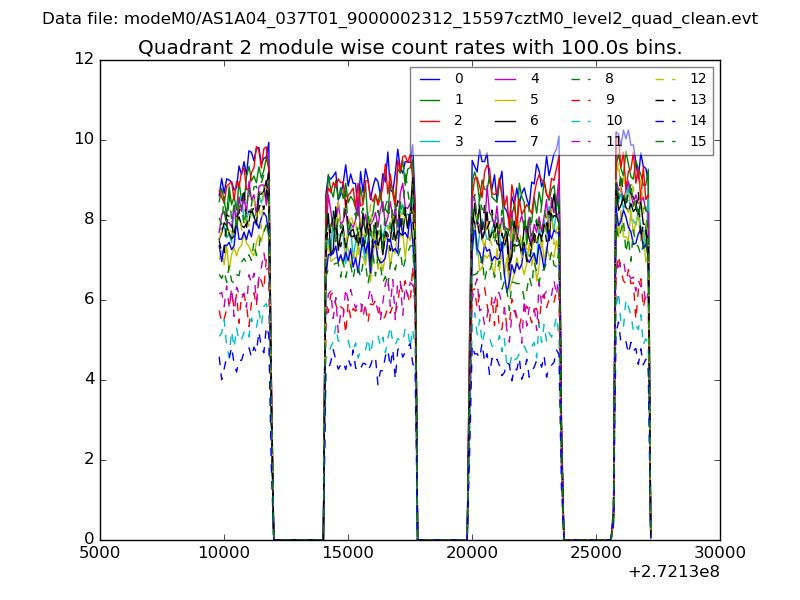
| Module-wise count rates for Quadrant B Data is divided into 100 sec bins |
 |
 |
| Module-wise count rates for Quadrant C Data is divided into 100 sec bins |
 |
 |
| Module-wise count rates for Quadrant D Data is divided into 100 sec bins |
 |
 |
| Parameter | Plot |
|---|---|
| CZT HV Monitor | 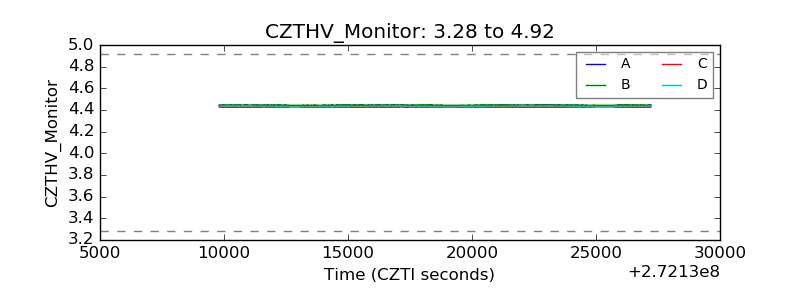 |
| D_VDD | 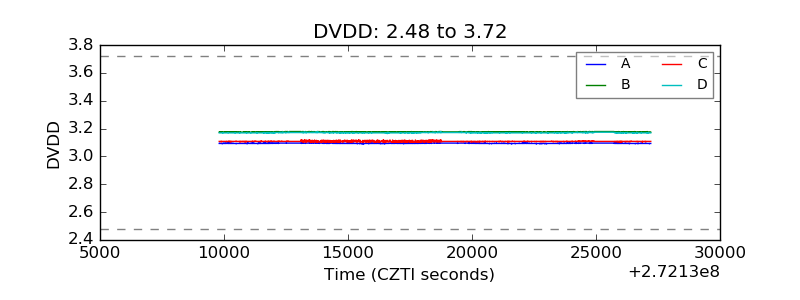 |
| Temperature 1 |  |
| Veto HV Monitor | 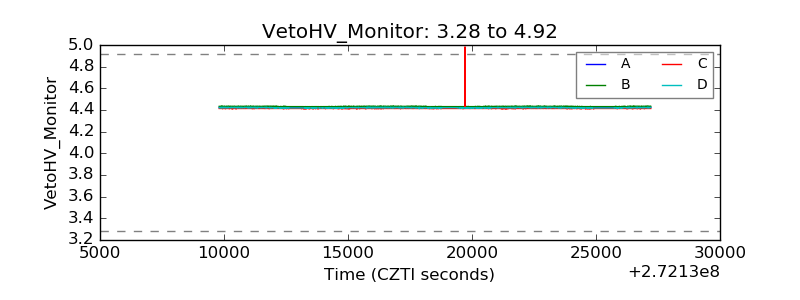 |
| Veto LLD | 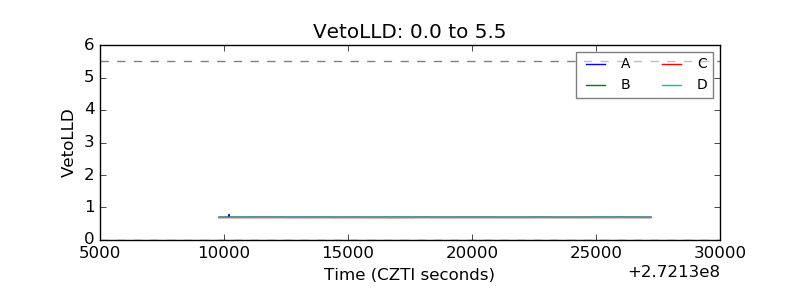 |
| Alpha Counter | 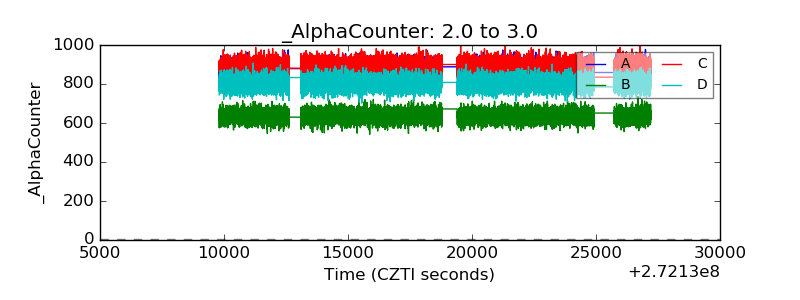 |
| _CPM_Rate | 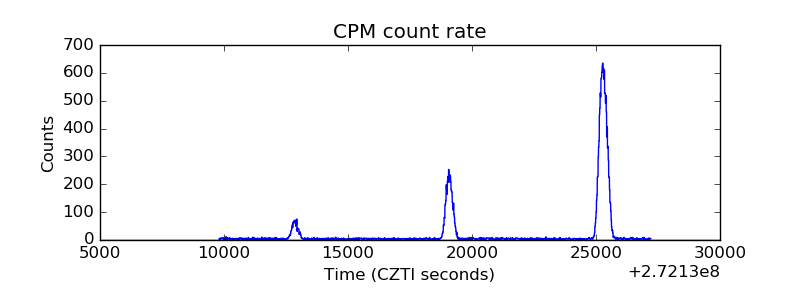 |
| CZT Counter |  |
| +2.5 Volts monitor |  |
| +5 Volts monitor |  |
| _ROLL_ROT | 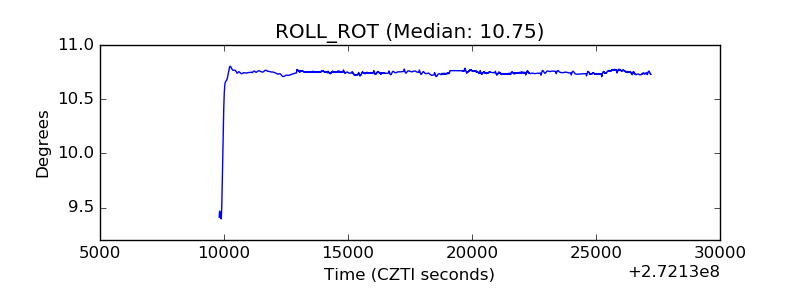 |
| _Roll_DEC | 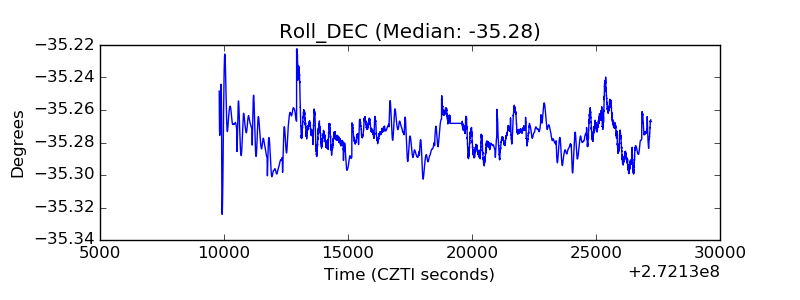 |
| _Roll_RA |  |
| Veto Counter | 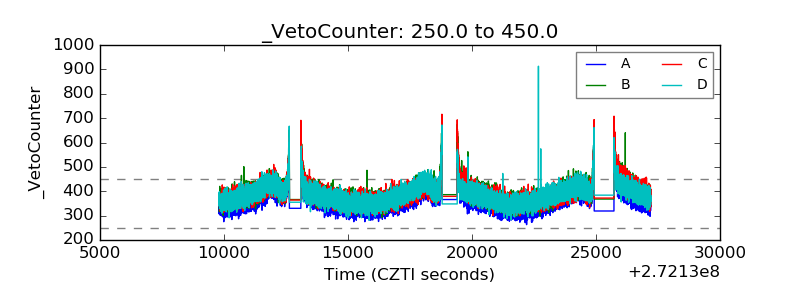 |