| Param | Original file | Final file |
|---|---|---|
| Filename | modeM0/AS1A04_037T01_9000002312_15602cztM0_level2.evt | modeM0/AS1A04_037T01_9000002312_15602cztM0_level2_quad_clean.evt |
| Size (bytes) | 460,336,320 | 96,531,840 |
| Size | 439.0 MB | 92.1 MB |
| Events in quadrant A | 3,535,744 | 623,133 |
| Events in quadrant B | 3,381,872 | 642,892 |
| Events in quadrant C | 3,301,717 | 618,912 |
| Events in quadrant D | 3,298,351 | 603,126 |
| Mode SS | |||
|---|---|---|---|
| Quadrant | BADHDUFLAG | Total packets | Discarded packets |
| A | 0 | 128 | 0 |
| B | 0 | 128 | 0 |
| C | 0 | 128 | 0 |
| D | 0 | 128 | 0 |
| Mode M0 | |||
|---|---|---|---|
| Quadrant | BADHDUFLAG | Total packets | Discarded packets |
| A | 0 | 14173 | 3 |
| B | 0 | 13854 | 2 |
| C | 0 | 13537 | 2 |
| D | 0 | 13698 | 2 |
| Mode M9 | |||
|---|---|---|---|
| Quadrant | BADHDUFLAG | Total packets | Discarded packets |
| A | 0 | 22 | 0 |
| B | 0 | 22 | 0 |
| C | 0 | 22 | 0 |
| D | 0 | 23 | 0 |
| Quadrant | Total seconds | Saturated seconds | Saturation percentage |
|---|---|---|---|
| A | 6233 | 144 | 2.310284% |
| B | 6233 | 68 | 1.090967% |
| C | 6233 | 76 | 1.219317% |
| D | 6233 | 94 | 1.508102% |
Noise dominated data is calculated using 1-second bins in cleaned event files. If a bin has >2000 counts, and if more than 50% of those come from <1% of pixels, then it is considered to be noise-dominated and hence unusable.
| Quadrant | # 1 sec bins | Bins with >0 counts | Bins with >2000 counts | High rate bins dominated by noise | Noise dominated (total time) | Noise dominated (detector-on time) | Marked lightcurve |
|---|---|---|---|---|---|---|---|
| A | 7514 | 6234 | 87 | 87 | 1.16% | 1.40% | 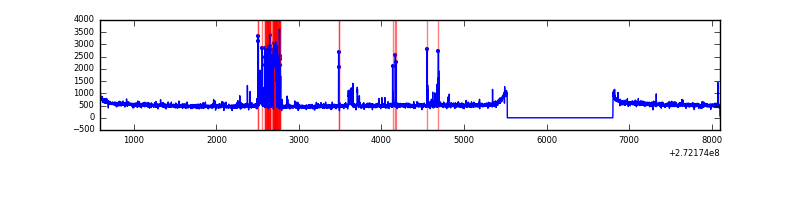 |
| B | 7514 | 6234 | 4 | 4 | 0.05% | 0.06% | 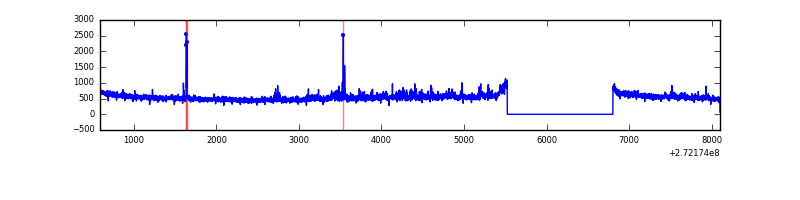 |
| C | 7514 | 6234 | 1 | 1 | 0.01% | 0.02% | 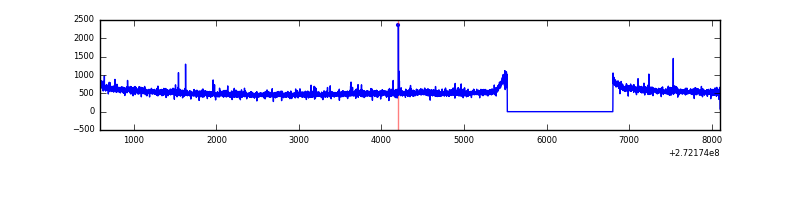 |
| D | 7514 | 6234 | 39 | 39 | 0.52% | 0.63% | 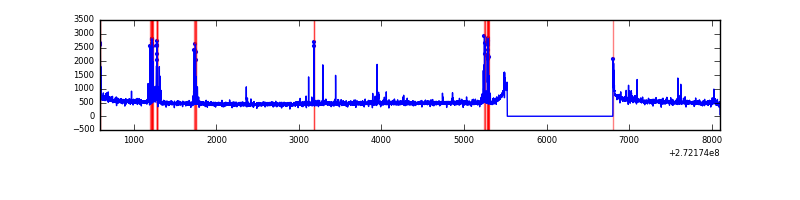 |
Top three noisy pixels from each quadrant. If the there are fewer than three noisy pixels in the level2.evt file, extra rows are filled as -1
| Pixel properties | Quadrant properties | ||||||
|---|---|---|---|---|---|---|---|
| Quadrant | DetID | PixID | Counts | Sigma | Mean | Median | Sigma |
| A | 4 | 2 | 337376 | 2071.63 | 819 | 802 | 162.5 |
| A | 9 | 143 | 26755 | 159.74 | 819 | 802 | 162.5 |
| A | 0 | 253 | 23022 | 136.77 | 819 | 802 | 162.5 |
| B | 4 | 251 | 114983 | 747.5 | 817 | 798 | 152.8 |
| B | 4 | 48 | 24224 | 153.36 | 817 | 798 | 152.8 |
| B | 0 | 189 | 20176 | 126.86 | 817 | 798 | 152.8 |
| C | 14 | 238 | 122829 | 655.22 | 800 | 808 | 186.2 |
| C | 3 | 233 | 46254 | 244.03 | 800 | 808 | 186.2 |
| C | 10 | 187 | 6607 | 31.14 | 800 | 808 | 186.2 |
| D | 10 | 70 | 166823 | 843.66 | 811 | 791 | 196.8 |
| D | 12 | 222 | 32771 | 162.5 | 811 | 791 | 196.8 |
| D | 2 | 234 | 28366 | 140.12 | 811 | 791 | 196.8 |
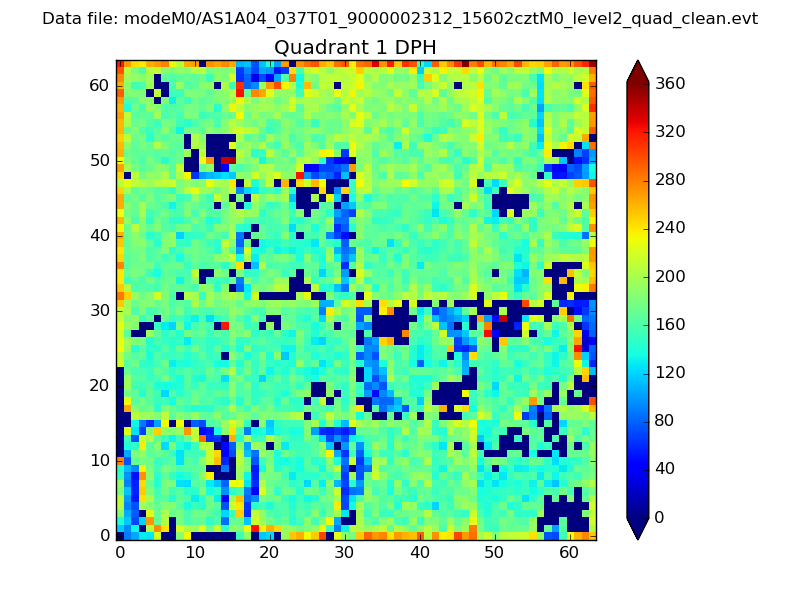
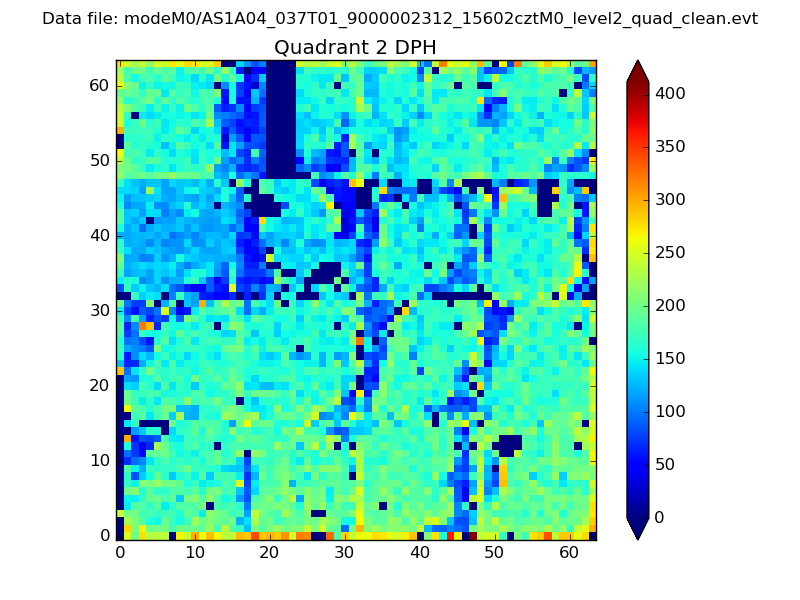
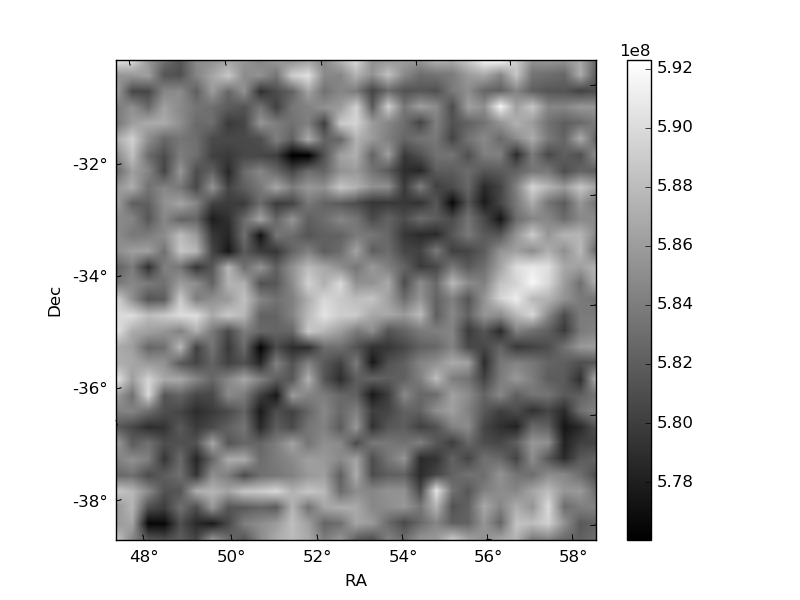
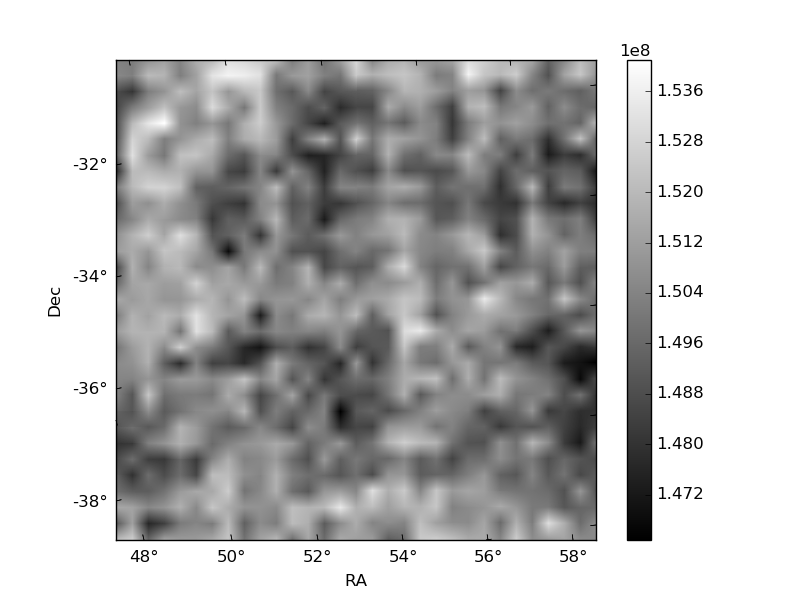
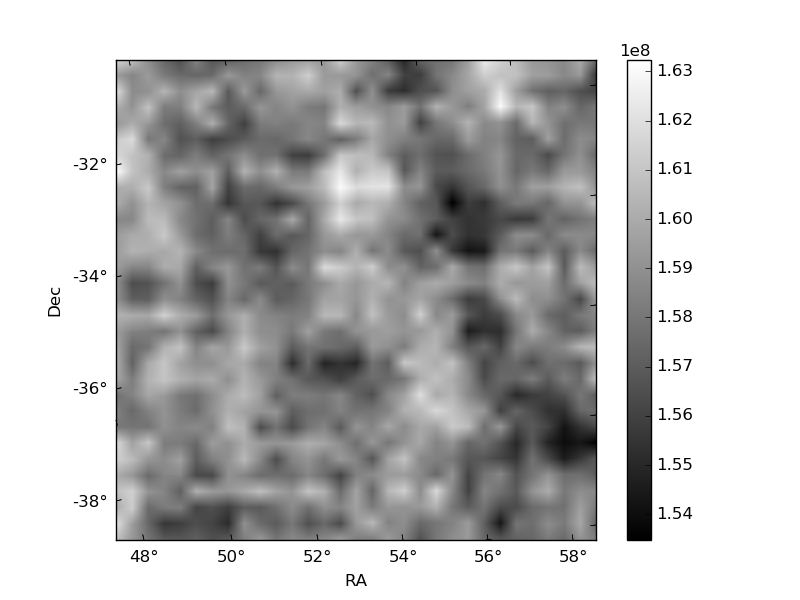
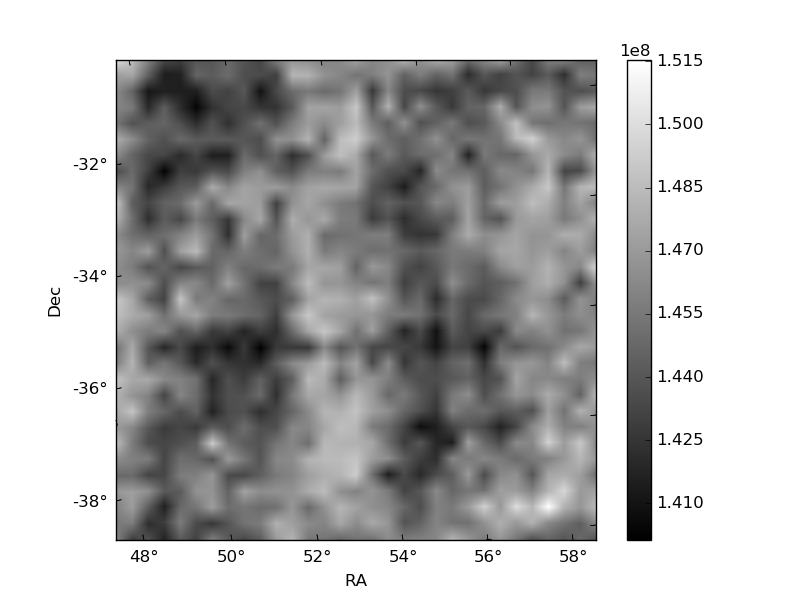
Histogram calculated using DETX and DETY for each event in the final _common_clean file
| Quadrant A |  |
 |
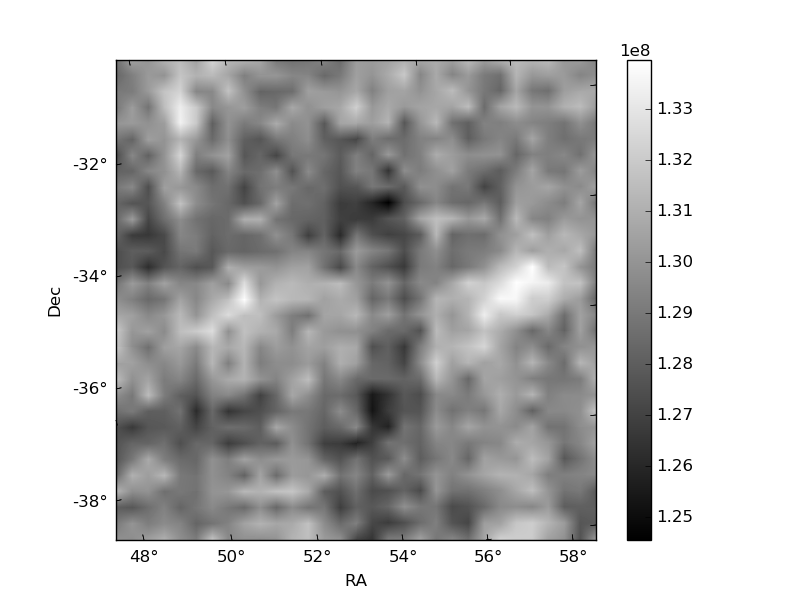
Quadrant B |
|---|---|---|---|
| Quadrant D | 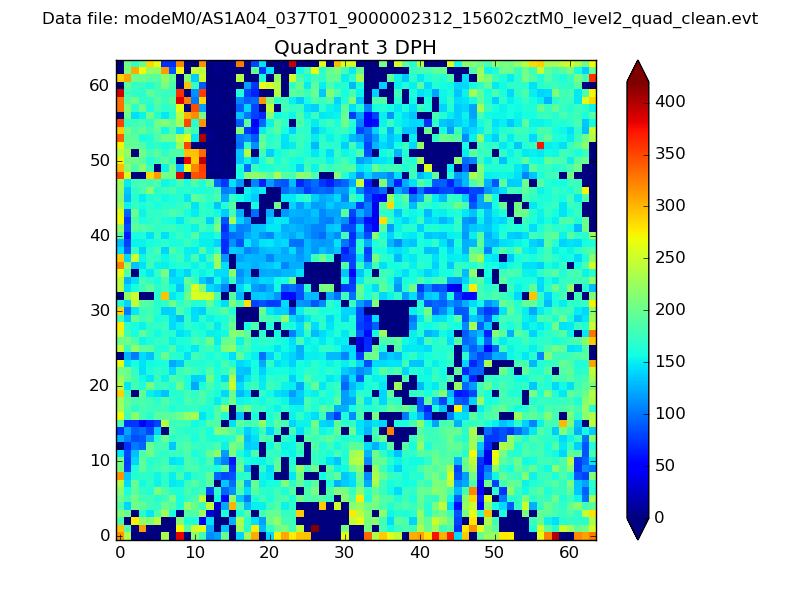 |
 |
Quadrant C |
| Plot type | Count rate plots | Images |
|---|---|---|
| Comparison with Poisson distribution Blue bars denote a histogram of data divided into 1 sec bins. Red curve is a Poisson curve with rate = median count rate of data. |
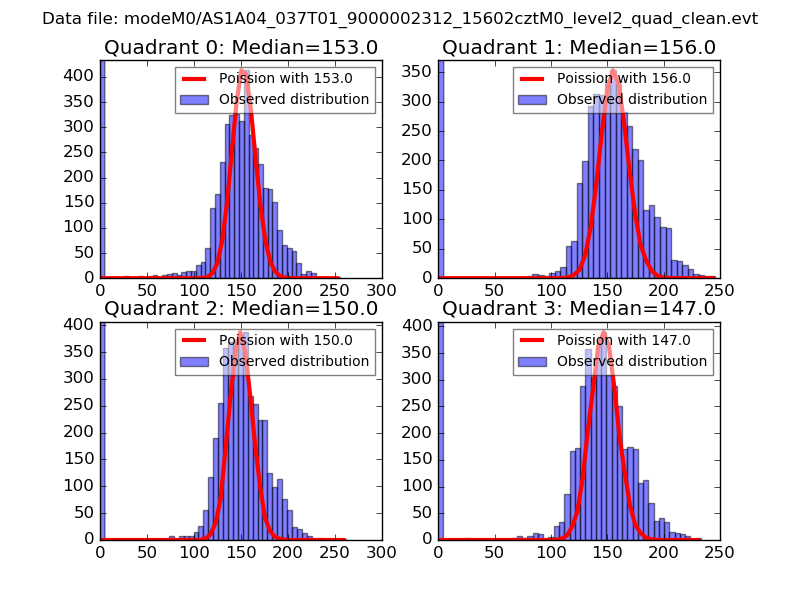 |
 |
| Quadrant-wise count rates Data is divided into 100 sec bins |
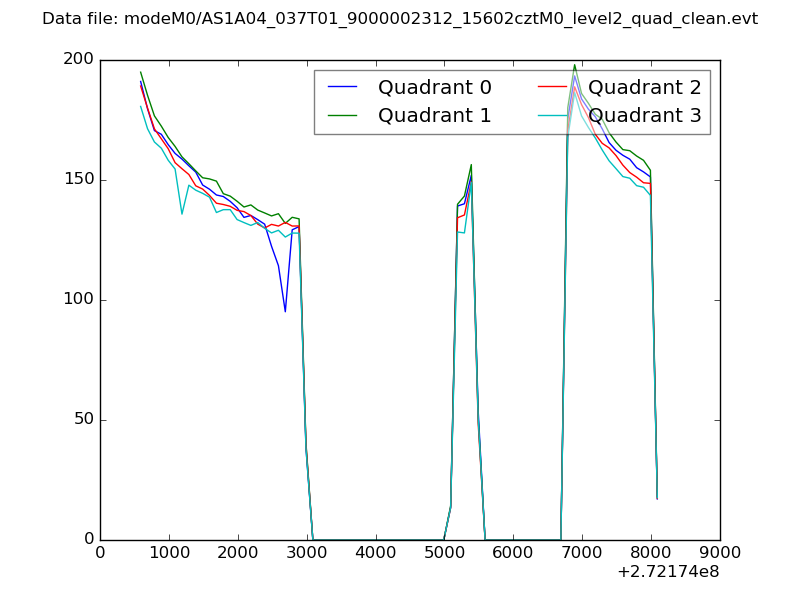 |
|
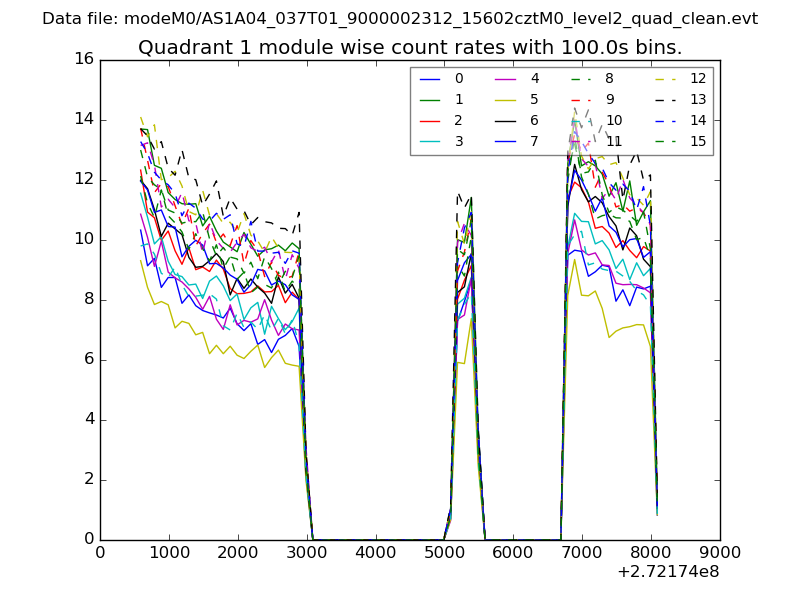
| Module-wise count rates for Quadrant A Data is divided into 100 sec bins |
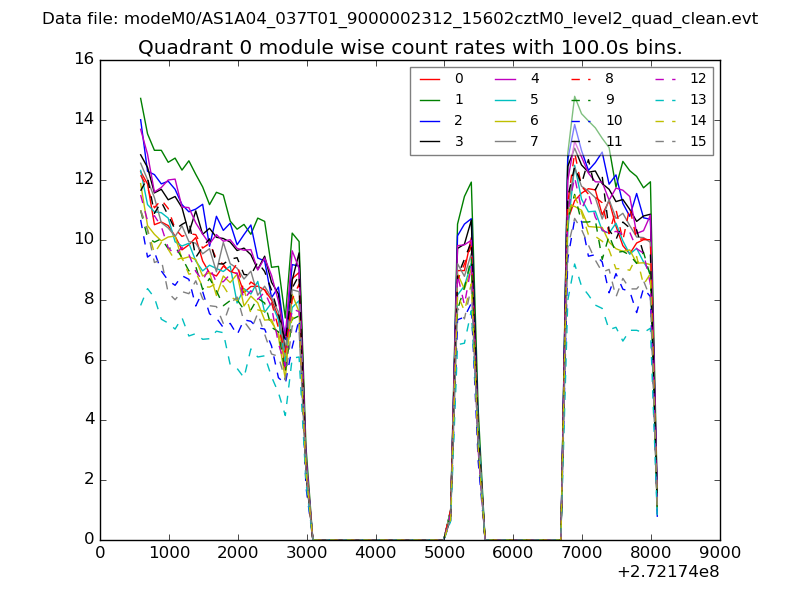 |
 |
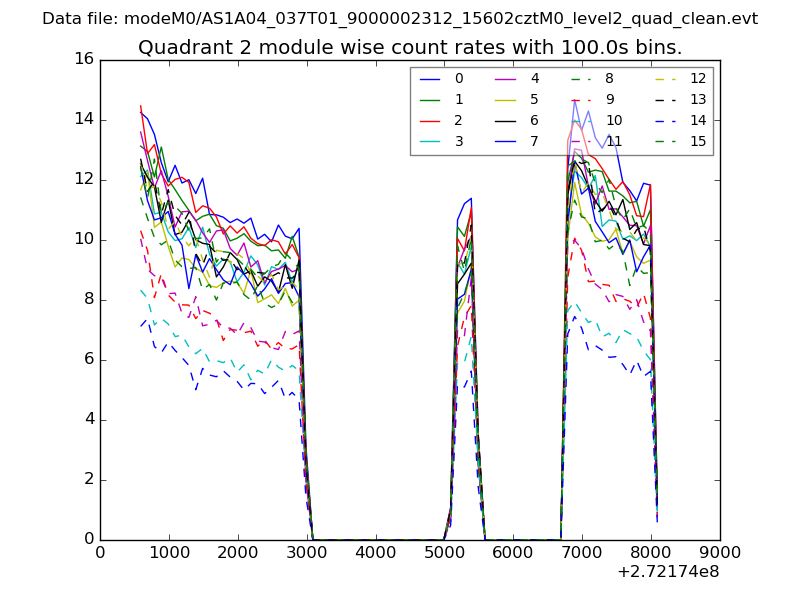
| Module-wise count rates for Quadrant B Data is divided into 100 sec bins |
 |
 |
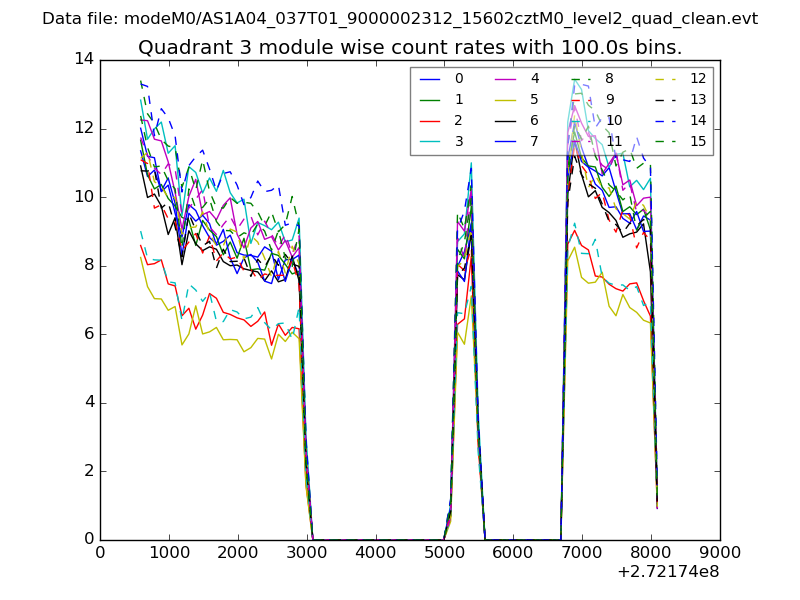
| Module-wise count rates for Quadrant C Data is divided into 100 sec bins |
 |
 |
| Module-wise count rates for Quadrant D Data is divided into 100 sec bins |
 |
 |
| Parameter | Plot |
|---|---|
| CZT HV Monitor | 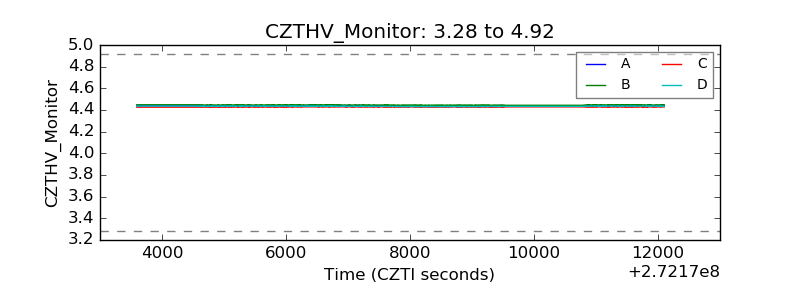 |
| D_VDD | 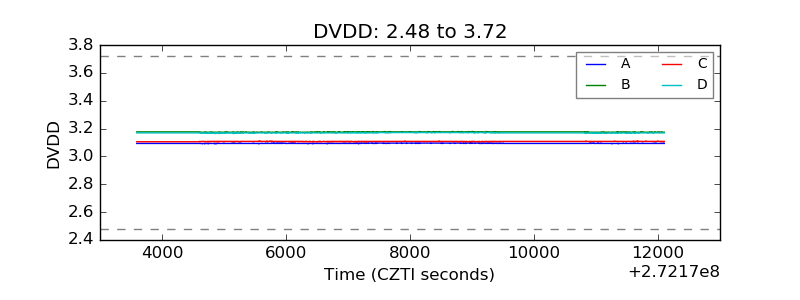 |
| Temperature 1 | 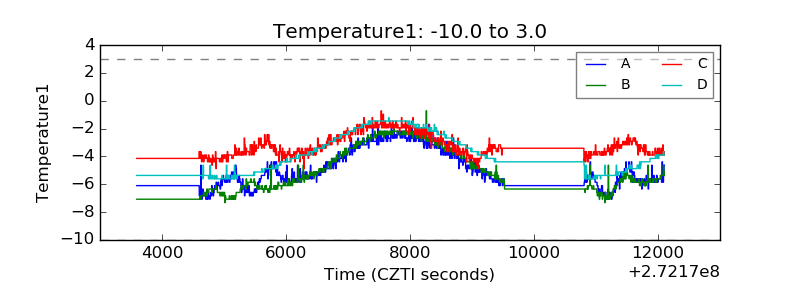 |
| Veto HV Monitor | 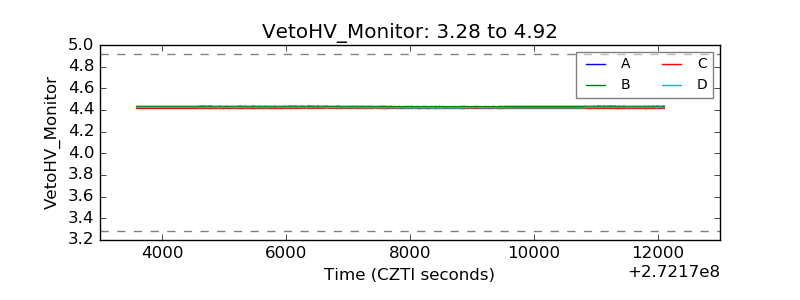 |
| Veto LLD | 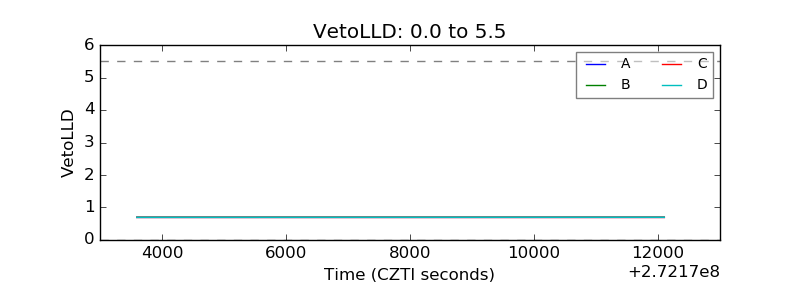 |
| Alpha Counter | 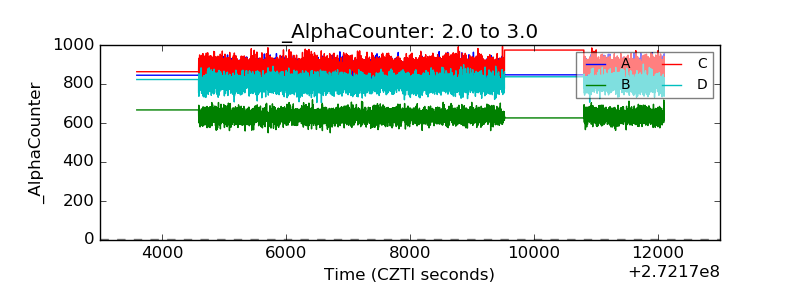 |
| _CPM_Rate | 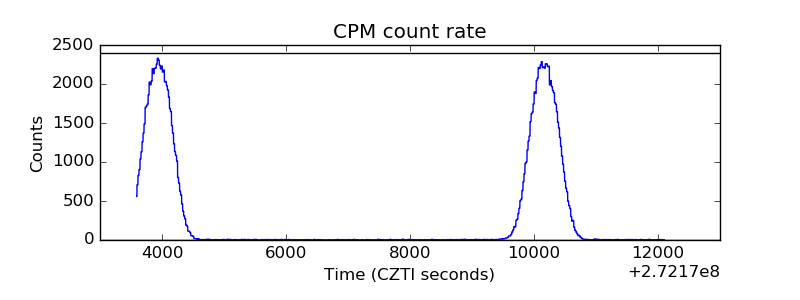 |
| CZT Counter | 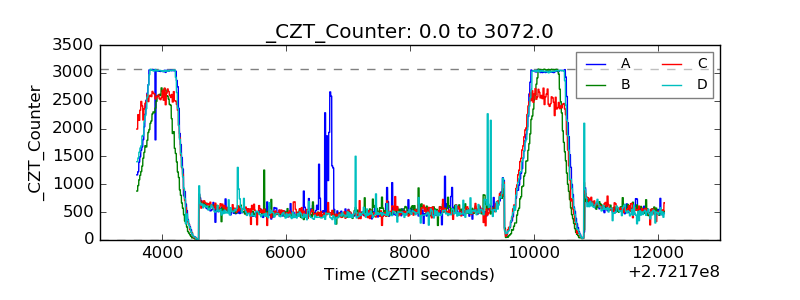 |
| +2.5 Volts monitor | 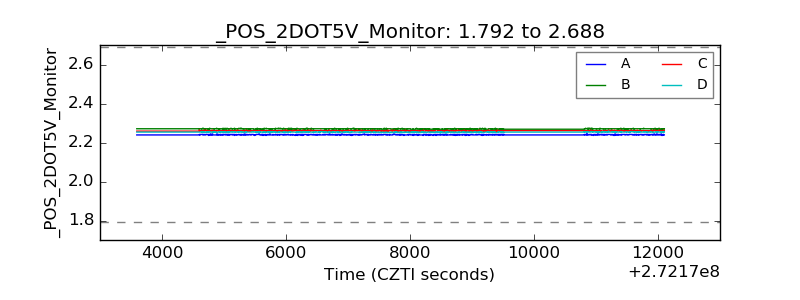 |
| +5 Volts monitor | 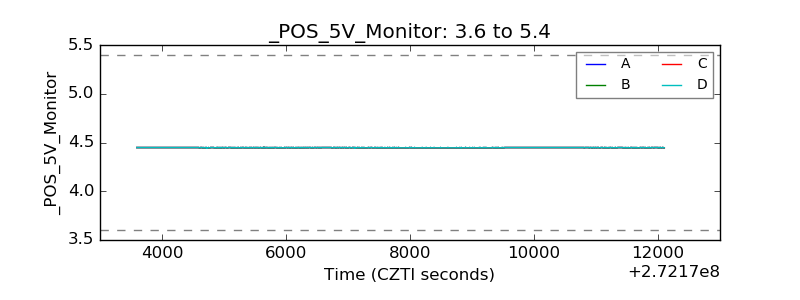 |
| _ROLL_ROT | 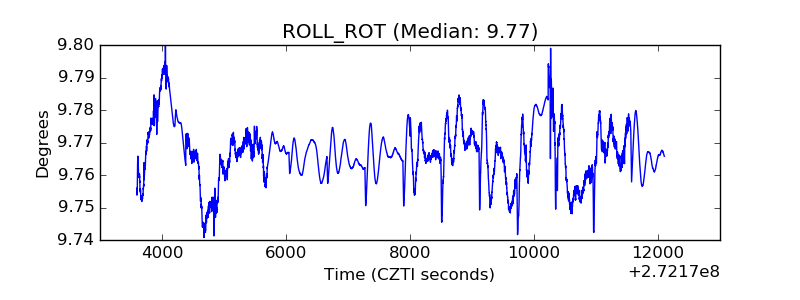 |
| _Roll_DEC | 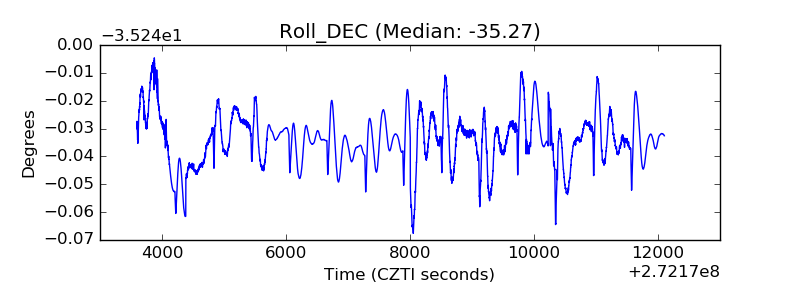 |
| _Roll_RA | 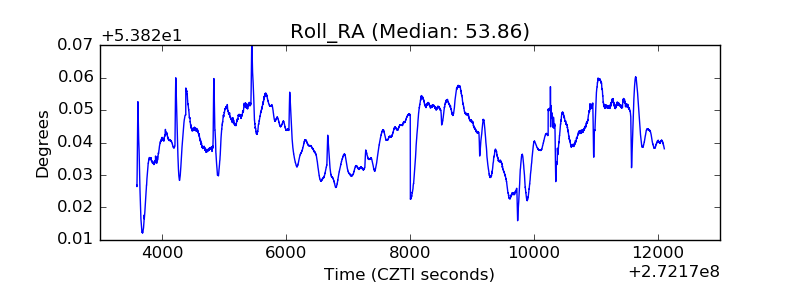 |
| Veto Counter | 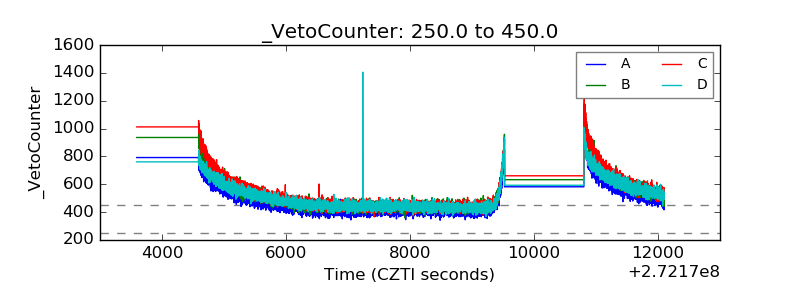 |